Arctic report card 2010: a one-way trip to warming

Last week NOAA released the 2010 update of its Arctic Report Card, covering the 2009/10 winter season and 2010 summer sea ice minimum. It makes for sobering reading. Greenland experienced record high temperatures, ice melt and glacier area loss, sea ice extent was the third lowest in the satellite record, and Arctic snow cover duration was at a record minimum. It’s worth digging through the whole report — it’s concise, well illustrated and referenced back to the underlying research — but a couple of things struck me as really important.


The first is the dramatic melting seen in Greenland this summer. From the Greenland report card:

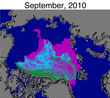
Summer seasonal average (June-August) air temperatures around Greenland were 0.6 to 2.4°C above the 1971-2000 baseline and were highest in the west. A combination of a warm and dry 2009-2010 winter and the very warm summer resulted in the highest melt rate since at least 1958 and an area and duration of ice sheet melting that was above any previous year on record since at least 1978.

And…

Abnormal melt duration was concentrated along the western ice sheet (Figure GL3), consistent with anomalous warm air inflow during the summer (Figure GL1) and abnormally high winter air temperatures which led to warm pre-melt conditions. The melt duration was as much as 50 days greater than average in areas of west Greenland that had an elevation between 1200 and 2400 meters above sea level. In May, areas at low elevation along the west coast of the ice sheet melted up to about 15 days longer than the average. NCEP/NCAR Reanalysis data suggest that May surface temperatures were up to 5°C above the 1971–2000 baseline average. June and August also exhibited large positive melting day anomalies (up to 20 days) along the western and southern ice sheet. During August temperatures were 3°C above the average over most of the ice sheet, with the exception of the northeastern ice sheet. Along the southwestern ice sheet, the number of melting days in August has increased by 24 days over the past 30 years.

Not good news for the ice sheet. The atmosphere report card draws attention to the impact Arctic warming is having further south, dubbing it the warm arctic/cold continents pattern (WACC).

While 2009 showed a slowdown in the rate of annual air temperature increases in the Arctic, the first half of 2010 shows a near record pace with monthly anomalies of over 4°C in northern Canada. There continues to be significant excess heat storage in the Arctic Ocean at the end of summer due to continued near-record sea ice loss. There is evidence that the effect of higher air temperatures in the lower Arctic atmosphere in fall is contributing to changes in the atmospheric circulation in both the Arctic and northern mid-latitudes. Winter 2009-2010 showed a new connectivity between mid-latitude extreme cold and snowy weather events and changes in the wind patterns of the Arctic; the so-called Warm Arctic-Cold Continents pattern.

So now you know where the WACCy winter weather’s coming from…

Gone for good: Arctic Ocean ice free all year by the 2040s?

A few days ago I used a combination of Arctic sea ice volume data from the University of Washington’s PIOMAS model and NSIDC sea ice extent numbers to project that the Arctic Ocean would be effectively ice-free in late summer within ten years. The key to that exercise was the rate at which the volume of sea ice has been declining — 350 km3 per year over the last 30 years for the full dataset, 410 km3 per year over the last 20, and 740 km3 over the last decade at summer minimum. The rate of volume decline has obviously been increasing. Using those numbers to project ice extent in the future is one thing, but they also tell us something interesting about the overall Arctic heat budget — and we can use that to make a rough guess about when the Arctic will become ice-free year round. The answer is surprising…

Continue reading “Gone for good: Arctic Ocean ice free all year by the 2040s?”

House by the sea (not a good idea)

The Royal Society of New Zealand has just published an interesting paper on sea level rise [pdf], the latest in a series on “emerging issues” of public concern. It’s a very good overview of the current state of our understanding of the risk of future sea level rises, reviewing the evidence that’s accumulated since the IPCC’s Fourth Report (AR4), and puts that information into the NZ context.

The paper suggests that as we’re learning more about the behaviour of the great ice sheets of Greenland and West Antarctica it’s becoming clear that there’s a risk of sea level rise this century much greater than the upper limits given in AR4 (which ignored increasing ice sheet melt). On the other hand, the extreme rates of sea level rise seen during the last deglaciation (4-5 metres per century at times) look less likely, with data from the last interglacial (LIG, aka the Eemian) suggesting 1.5 metres/century is more plausible.

The RS paper also includes a useful summary of various SLR planning guidelines issued around the world. New Zealand’s guidelines (Bryan’s take here), based on AR4, look to be on the low side, but speaking at the press conference to launch the paper, Prof Martin Manning, director of Climate Change Research Institute at Victoria University , suggested that in his recent experience Environment Court judges were taking care to stay abreast of current scientific knowledge. That’s important, because as NIWA’s Doug Ramsay pointed out at the conference, 12 of the 15 largest towns and cities in NZ are on low-lying coastal and estuarine margins, there’s been enormous pressure to develop on prime beachfront locations and large chunks of our road and rail infrastructure are within 5 metres of current sea level.

[Iron & Wine]

Monday miscellany

I‘m going to be away from my desk for a few days this week, so here’s a few interesting things to read and reflect on. First up: Wellington’s hosting this year’s New Zealand Soil Carbon Conference at Te Papa from Wednesday to Friday. Keynote speakers are Tim Flannery and Christine Jones, and topics to be covered include:

  • The science behind climate change and soil carbon
  • The on-farm benefits of biological farming
  • How research can support innovative farmers
  • An overview of the new biological economy and market opportunities
  • Practical tips to build soil carbon, humus and soil biology
  • Future directions for NZ agriculture and extension services

Full programme here — Friday’s a field trip day. Sounds very worthwhile. If any HT readers are attending (or if the conference organisers are reading this), I’d be very happy to carry a report on events.

Adding to the long list of material debunking standard sceptic & crank claims about climate change, Deutsche Bank’s Climate Change Advisors (DBCCA) have produced a nicely referenced document (PDF), prepared for them by the Earth Centre at Columbia University. Here’s a sample from the executive summary:

Claim: Human society and natural systems have adapted to past climate change.

Response: Past climate changes have often been accompanied by migration, war, and disease. The growing human population will inevitably make environmental change more disruptive in the future, even in the face of increased technological prowess.

A couple of items from Nature News: in Collapse of the ice titans, NN interviews Richard Bates, recently returned from a summer sail along Greenland’s NW coast on the Gambo (more on that voyage at Jason Box’s Meltfactor.org blog) about the melt season at the Petermann and Humboldt glaciers. Ocean conveyor-belt model stirred up looks at a new paper in Nature Geoscience that finds greater than expected variability in the great ocean current network known as the Thermohaline Circulation (THC). Understanding the short term changes in THC flows will be important in attempts to model short term and regional climate change.

The Arctic sea ice looks to be fast approaching its summer minimum, heading for somewhere between 2008 and 2009 — making it the third lowest in the record. Best place to keep up with events is (as it has been all NH summer) Neven’s Arctic Sea Ice blog. The two boats (Northern Passage, Peter 1) attempting to circumnavigate the Arctic Ocean in a single season are both now heading for the southern route of the NW Passage. In the southern Beaufort Sea the Norwegian team are reporting high sea temperatures:

We are still surprised and worried about the high water temperature. At the moment we are registering around 7 to 8 degrees Celsius, which according to the experts is far higher than normal.

Also of interest for sea ice aficionados: a new paper in Quaternary Science Reviews looks at what we know of the history of Arctic sea ice. Coverage at Climate Central and Science Daily but here’s Climate Central talking to the NSIDC’s Mark Serreze:

“They’re telling us that there was maybe no ice during the Arctic summers 7,000 years ago, and also ice-free summers during the last interglacial 125,000 years ago.” Those were due to natural factors, most notably the changes in Earth’s orientation to the Sun that brought more sunlight to the Arctic in summer. This time, says the paper, there is no known natural explanation, and climate skeptics who claim the ice is rebounding after the 2007 low, he says, “are grasping at straws.”

And finally: the British government starts planning to adapt to inevitable warming (but offers no new money). Plus ça change…

On fire inside a snowball

Fire: NOAA’s National Climate Data Centre has posted its report on global climate for July (press release). The combined global land and sea surface temperature of 16.5ºC was the second warmest in the NOAA record, 0.66°C above the average for the last 100 years of 15.8°C. The January to July period was the warmest in the record. The map below shows the anomalies for the month — spot the heatwave in Russia.

NOAA201007.gif

Meanwhile, NASA’s Goddard Institute for Space Studies (GISS) has posted its take on the the July numbers: What Global Warming Looks Like. Click on the thumbnail image at the top of the post to see their map of July temperatures. One striking point they comment on:

…the area warmer than climatology already (with global warming of 0.55°C relative to 1951-1980) is noticeably larger than the area cooler than climatology. Also the magnitude of warm anomalies now usually exceeds the magnitude of cool anomalies.

GISS also note that the 12-month running mean (below) of global temperature is well into record territory, and that it’s possible that calendar 2010 could also set a record.

GISSglobalrmJul2010.gif

Meanwhile, up North….

Continue reading “On fire inside a snowball”