The year the earth bit back: top climate stories of 2012

2012Amidst the blizzard of year-end roundups, here’s one you have to read in full — a joint effort put together by a diverse group of bloggers and scientists: Angela Fritz, Eli Rabett, Emilee Pierce, Greg Laden, Joe Romm, John Abraham, Laurence Lewis, Leo Hickman, Michael Mann, Michael Tobis, Paul Douglas, Scott Mandia, Scott Brophy, Stephan Lewandowsky, Tenney Naumer and yours truly. Lead author Greg Laden explains:

A group of us, all interested in climate science, put together a list of the most notable, often, most worrying, climate-related stories of the year, along with a few links that will allow you to explore the stories in more detail. We did not try to make this a “top ten” list, because it is rather silly to fit the news, or the science, or the stuff the Earth does in a given year into an arbitrary number of events. (What if we had 12 fingers, and “10” was equal to 6+6? Then there would always be 12 things, not 10, on everyone’s list. Makes no sense.) We ended up with 18 items, but note that some of these things are related to each other in a way that would allow us to lump them or split them in different ways. See this post by Joe Romm for a more integrated approach to the year’s events. Also, see what Jeff Masters did here. We only included one non-climate (but related) item to illustrate the larger number of social, cultural, and political things that happened this year. For instance, because of some of the things on this list, Americans are more likely than they were in previous years to accept the possibility that science has something to say about the Earth’s climate and the changes we have experienced or that may be in the future; journalists are starting to take a new look at their own misplaced “objective” stance as well. Also, more politicians are starting to run for office on a pro-science pro-environment platform than has been the case for quite some time.

A failing of this list is that although non-US based people contributed, and it is somewhat global in its scope, it is a bit American based. This is partly because a few of the big stories happened here this year, but also, because the underlying theme really is the realisation that climate change is not something of the future, but rather, something of the present, and key lessons learned in that important area of study happened in the American West (fires) the South and Midwest (droughts, crop failures, closing of river ways) and Northeast (Sandy). But many of the items listed here were indeed global, such as extreme heat and extreme cold caused by meteorological changes linked to warming, and of course, drought is widespread.

Continue reading “The year the earth bit back: top climate stories of 2012”

Arctic meltdown: two views and a bit of PIG

[youtube http://www.youtube.com/watch?v=G08xPmxR28U&w=480]

From NASA’s Earth Observatory Youtube channel: a great video showing the calving of this year’s Petermann Ice Island. Most impressive is the speed with which it passes down the Nares Strait. And to provide a little North-South symmetry, today’s EO Image of the Day shows the steady enlargement of a giant crack in the Pine Island Glacier in West Antarctica, which will calve the biggest piece of PIG in recent history, sometime soon.

For a somewhat different reaction to what’s going up North, try this video from Greenpeace’s Save The Arctic campaign. Great fun…

[youtube http://www.youtube.com/watch?v=ZOHKu2vFp34&w=480]

Ice bottom blues

[youtube]UaKqhRTqSlg[/youtube]

According to the latest bulletin from the National Snow and Ice Data Center in the US, Arctic sea ice is likely to be at or about its minimum extent for the summer (as of Sept 17th). The animation above shows how the ice melt proceeded through the summer (up to Sept 14th), and the graph below shows the extent as of Sept 17th — 3.41 million square kilometres (1.32 million square miles).

NSIDCseaice20120917

The NSIDC notes:

The current extent is 760,000 square kilometres (293,000 square miles) below the previous record minimum extent in the satellite record (4.17 million square kilometres or 1.61 million square miles) which occurred on September 18, 2007. This difference is larger than the size of the state of Texas. The ice extent currently tracks nearly 50% below the 1979 to 2000 average minimum extent.

For an insight into what the ice is really like, I recommend Julienne Stroeve’s blog of her trip on the Greenpeace vessel Arctic Sunrise. This is from her most recent entry (Sept 17th):

Continue reading “Ice bottom blues”

Greenland’s extraordinary summer #2: still melting

Petermann20120806

Greenland’s extraordinary summer is far from over. The ice island that broke off the Petermann glacier tongue last month — now dubbed PII-2012 — is edging its way out into the Nares Strait between Greenland and Ellesmere Island, as this satellite image, snipped from NASA’s fabulous daily Arctic Mosaic shows. For updates on events in Nares Strait, check out Dr Andreas Muenchow’s Icy Seas blog — he’s up there at the moment. Elsewhere on the great ice sheet, melting continues apace. Jason Box reports that ice sheet albedo has dipped again into record levels for the time of year, and there are reports of further extensive surface melting at the end of July. Box also reports that a recent update of the Greenland temperature record shows that current temperatures are unprecedented in at least the last 172 years. There’s also excellent coverage of the summer at Greenland melting.

Meanwhile, and rather unsurprisingly, New Zealand’s little band of climate deniers are insisting that there’s nothing special going on up North. And, equally unsurprisingly, they’re totally wrong.

Continue reading “Greenland’s extraordinary summer #2: still melting”

Greenland’s extraordinary summer: melting records and ice island setting sail

Petermann2012203

July has been an amazing month in Greenland. The Petermann Glacier has given birth to another huge ice island — taking its terminus further back up its fjord than at any time in the last 100 years (at least), record high temperatures have been recorded at the summit of the ice sheet at 3,200 meters, initiating surface melt over the whole vast sheet, ice sheet albedo has plummeted, and the Jakobshavn Isbrae’s calving front has retreated into the ice sheet.

The best coverage of the Petermann event, as on most matters to do with the Arctic summer and sea ice melting season is to be found at Neven’s Arctic Sea Ice blog. It’s well worth reading the comments under the Petermann post there, to get a really informative picture of what’s being going on. Here’s a description by Dr Andreas Muenchow1 of what the calving would have been like:

I described the Petermann calving to some media folks as a gentle and very quiet affair similar to a rubber duckie pushed out to sea from the deck of a flat pool.

Some duckie, some pool…

Illulisatanimated2012203
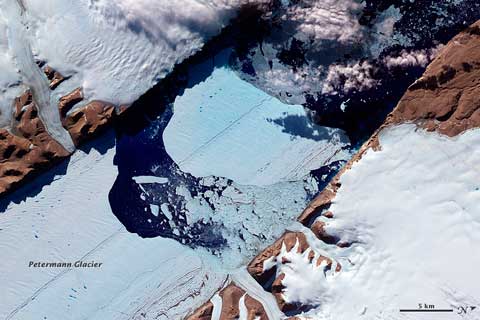
Further south, the the “root” of the Jakobshavn Isbrae has enlarged significantly, with the calving front of Greenland’s most productive glacier retreating further into the ice sheet. The “blink” image I’ve cobbled together (left) shows day 203 of this year compared with day 202 of last year2. The difference is large and very obvious. Greenland specialist Dr Jason Box was flying out of Ilulisat shortly after the retreat earlier this month, and snapped the photo below out of the window of his plane. As he commented on Facebook, it looks like the glacier has divided into two streams.

BoxGreenlandIllulisat

Up at the summit of the Greenland ice sheet at 3,200 metres, a new high temperature record of 3.6ºC was set on July 16, hard on the heels of four days in row of temperatures above freezing, from July 11 to 14. Considering that temperatures above zero had only been recorded four times in the preceding 12 years, this amounted a remarkable heatwave, and triggered an astonishing melt record.

Greenlandmelt2012

This NASA graphic shows how the melting surface, shown in shades of red, spread over the whole surface of the ice sheet from July 8 to July 12. This amounts to “the largest extent of surface melting observed in three decades of satellite observations”, according to NASA. The last such melting event occurred in 1889, and ice cores show that they occur every 150 to 250 years. However, given the steady increase in melt area over the last decade, and the precipitous drop in ice sheet albedo (see below), especially at high altitudes, it may not be 150 years before such a melt happens again.

GISalbedo201207

The last time I looked at this extraordinary summer in Greenland, it was to report Jason Box‘s view that “it is reasonable to expect 100% melt area over the ice sheet within another similar decade of warming”. It took two weeks to come true. Forgive me if I find that alarming.

  1. Andreas provides great coverage of the Petermann glacier at his blog — perhaps unsurprisingly, as he’s on his way up there to recover instrumentation soon. []
  2. Source: 2012, 2011. []