
 Earlier this month the US National Snow & Ice Data Center issued its analysis of this year’s Arctic sea ice minimum — at 4.60 million km2 on September 19, the third lowest extent in the satellite record. However extent (defined here) doesn’t tell you everything about the state of the ice — according to the University of Washington’s PIOMAS ice model 2010 managed to set a new record low for sea ice volume.
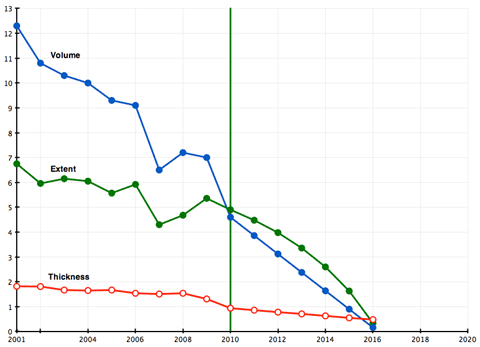
In terms of the future of the Arctic sea ice, the volume of ice remaining at minimum is a crucial metric because it represents the size of the heat budget buffer between an ocean with a perennial floating ice cap and one that’s seasonally ice-free. For the Arctic to be ice free in summer, that buffer has to disappear, or become a lot smaller. I’ve been writing about sea ice volume for some time, and considered the overall Arctic heat budget in this post a couple of years ago, so news of the new low volume prompted me to think about what it might mean for the extent metric over the next few years. To do that, I downloaded the NSIDC’s September monthly average extent for the last 21 years, and plotted that against the PIOMAS model’s September average monthly volume (kindly supplied by Jinlun Zhang). Here’s what the data looks like when you plot it on the same chart.
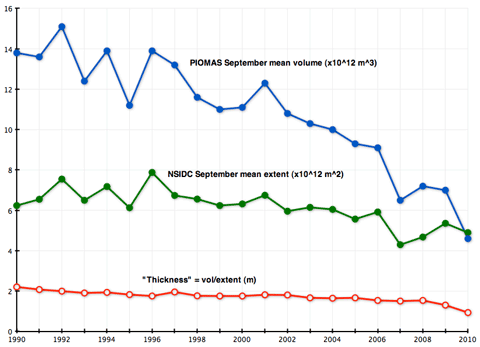
The red line at the bottom, labelled “thickness”, is what you get when you divide volume by extent, and that too has been in decline, reflecting the fact that the loss of volume has been happening faster than the reductions in extent.
“Thickness” is not a real representation of the actual thickness of the ice at minimum — that varies considerably with the age of the ice, older ice being thicker. It’s just a number that depends on the relationship between extent and volume, and that makes it interesting. Here’s what it looks like if you plot it at a finer scale:
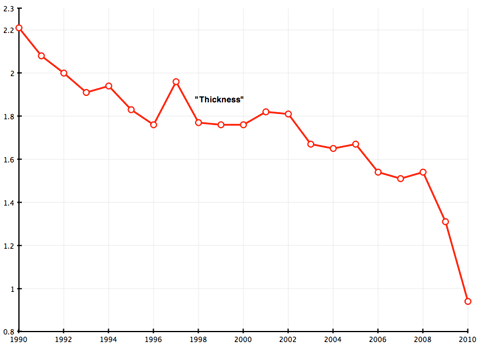
In 1990, the sea ice at minimum was 2.2 metres “thick”. In 2010 that had declined to 0.94 metres — reflecting the marked loss in old thick ice over the period. Over the 21 year period, the ice has been thinning at about 4 cm per year, and over the last decade — reflecting the steep recent drop — at 8 cm per year.
For sea ice volume, the PIOMAS numbers show an average drop of 410 km3 per year since 1990, but over the last ten years that loss increases to 740 km3 per year, mainly because of the steep falls in 2007 and 2010. For extent the 21 year trend is a loss of 110,000 km2 per annum, rising to 200,000 km2 per year over the last decade.
So what happens when we project these trends forward? To do this I plotted two graphs, the first assuming that the 21 year trends for volume and “thickness” would continue over the next ten years. From those numbers I calculated the equivalent extent:
By 2020 September average sea ice extent is reduced to 850,000 km2. The following year (not plotted) it reaches a minimum of 90,000 km2. In other words, if the rate of reduction of ice volume continues at the average rate of the last 21 years, the Arctic will be ice free in summer by 2021.
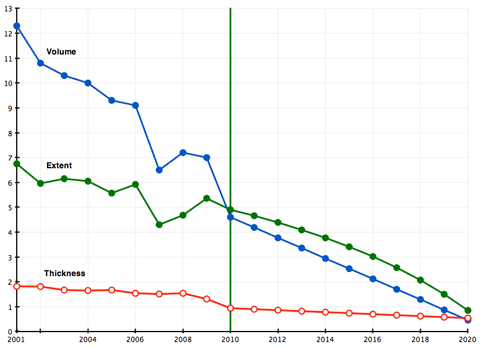
What happens if you plot the same graph, using the current (last decade) trends for volume and “thickness” to project extent? It’s a striking picture, I think you’ll agree:
If these trends continue, then September ice extent dips below 2 million km2 in 2015, before all but disappearing in 2016. Hence the title of this post…
I also looked at what happens if you use the trends in extent and “thickness” to project volume going forward. This results in ice volume reduction at half the rate observed over the last two decades (a quarter of the current rate), and so looks unlikely — although it does postpone an ice-free Arctic summer until 2030/31.
Of course, these projections are very “smooth”, and make no allowance for the year to year variations that are obvious in the records for volume and extent. That “noise” could work to our advantage, and delay the loss of ice. For instance, if volume reductions occur at the rate apparent in 2002-6, then 2020-21 looks possible. On the other hand, just one more year with a drop in volume as large as in 2007 or 2010 could bring the end of the ice before 2015.
Some caveats: the PIOMAS data is model generated, and while regarded by the sea ice community as the best available at the moment, it is subject to uncertainty. The absolute numbers could be wrong, as could the exact trends, but the big picture is all I’m really relying on for these projections. Improved volume numbers should become available as the new Cryosat 2 mission begins to produce data.
Bottom line: if the relationship between ice volume and extent evident in the NSIDC and PIOMAS data over the last 21 years continues in the near future, then the Arctic will be effectively ice-free in late summer sometime between 2015 and 2020. One interesting observation: the 10 year trend chart above suggests that 2007’s record minimum extent could remain unbroken next year, and the ice would still be on course to disappear within five years. If there’s any upside at all to this message (and I’m struggling to find one) it is perhaps that such a rapid and visible loss of sea ice might finally persuade the international community to take urgent action to reduce the atmospheric carbon load. What a seasonally ice-free Arctic might mean for global climate is something I shall look into a future post.
My thanks to Jinlun Zhang at the University of Washington for supplying the PIOMAS data. My amateur prognostications should not be taken as endorsed by him or the PIOMAS team, the NSIDC or any respectable sea ice scientist for that matter. 😉
And yes, William, I am willing to bet on it!
I’m looking forward to your upcoming post. I am particularly interested in whether the loss of the summer sea ice will “free up” very significant amounts of energy that were formerly going into melting the ice and which will (once it is gone) go into heating the ocean & atmosphere. Or rather, I am interested in the scale of this shift. Could it be a game-changer or is it likely to only make a more modest contribution to global trends?
Rather than the global, the really big initial impacts will be local, in the countries closest to the Arctic. More open water, more evaporation, more precipitation to follow but not necessarily over the ocean.
And without that icy “floor”, the weather circulation patterns in the area will also be affected – doubt that anyone knows how.
Byron, the immediate climate effect is local, as Adelady says, but the major effect (for the time being) is that as the newly open ocean cools and freezes each autumn it releases a lot of heat to the atmosphere. This pulse of heat (and water vapour) warms the surrounding land and increases local snowfall. There is also some evidence that this heat is beginning to affect the pattern of NH weather, by affecting the course of the polar jetstream. But that’s for the next post…
Byron, see this study, Does the Arctic sea ice have a tipping point? which suggests that the loss of the Arctic summer sea ice is not considered to be some “tipping point”. If there is sufficient ice cover for the majority of the year, it will still use up most of the available heat, so effects will likely be local in nature rather than hemispheric or global.
According to the author, the tipping point occurs when Arctic temperatures rise above minus 5 degrees C. But then again, given that no one had predicted the current state, who really knows?.
Thanks A&D, that is (somewhat) reassuring. I hadn’t seen much discussion of it directly other than as a potential political tipping point (and in relation to permafrost thaw).
There’s a typo in the units for extent, on your first chart. A million km^2 is 10^12 m^2, not 10^9.
Bugger. That mean’s I’ll have to redo the graph. It will be done…
The connection between extent and volume is important, because volume loss depends on heat budget which is in turn partly dependent on mean albedo, and hence extent (more strictly, area).
For this reason, volume loss is unlikely to be linear: if September volume is declining by 700 km^3 per year with current September area, then we might expect more rapid future decline in volume as area continues to trend downwards. This may or may not be part of the reason for the visible acceleration in volume loss over recent years.
So maybe one could make an interesting refinement of your projection by projecting annual volume change as a linear function of extent, while projecting extent as volume/thickness, and using a linear trend for thickness.
Of course it’s much more complex than that. For a start the albedo feedback is most important from May to July, when the sun is high. So really you should project those months, and then project September extent based on the correlation between July and September values. Or something like that.
The same albedo feedback point tells us that this will all get more interesting, and not in a good way, when the bottom falls out of the May-July area numbers.
I think the process is being dominated by oceanic heat (per Maslowski), and that albedo change is only a bit player at the moment. That will change when more of the ocean is open water at the critical period (May/June/July). Whether this will make a difference to the year a seasonally ice-free Arctic arrives remains to be seen, but I do think it will have a considerable role in hastening the arrival of a year-round ice free Arctic (of which more later).
And of course things are much more complicated than my back-of-an-envelope projections suggest. I hope that complexity works in our favour…
My amateur guess, is that you won’t be too far off the mark Gareth.
The sea ice has almost reached a stage where it can undergo a spectacular melt season given the right (or should that be wrong?) conditions. Professor Barber’s work has shown that, what the satellites are seeing as thick multi-year ice, is in fact “rotten”. Did anyone predict such a condition?.
I just hope that there isn’t some expectation of drastic climatic changes immediately after the Arctic is seasonally ice free. If the scientific understanding is correct, and the tipping point is further along, then we’ll have a whole bunch of inactivists calling the scientists alarmists, catastrophists, blah, blah.
It’ll be like one of the those lame horror movies, where the tension is ratcheted up expecting the monster to leap out of the cupboard, only for it to not happen. Then ker blammo !! , five seconds later we get nailed.
Humanity’s curiosity at the effect of emitting GHGs into the atmosphere as fast as we can extract it out of the ground reminds me of Japan’s curiosity over what it would be like to bring the United States into the war. My suspicion is that the Arctic would be the equivalent of Pearl harbour.
I have been thinking about what the courts can do. It seems like there is no legal precedent for prospective court action, it only applies retrospectively i.e. at the point when any preventive action becomes too late. Taking tobacco as an example, having a higher risk of lung cancer is useless, you have to get lung cancer to take the tobacco industry to court and even then only if you can prove that you were misled into believing that tobacco is safe. Of course once you have lung cancer, you won’t live long enough to benefit from a successful lawsuit. So unless there are substantial law changes, the courts are powerless to make a difference that could potentially hasten a transition to cleaner energy and/or a reduction in demand for fossil fuels.
If the courts decided to hear the NIWA case, then we have a precedent. If NIWA can be sued for allegedly misleading the nation then surely Treadgold et.al can be sued for very demonstrably misleading the nation through their inapt ramblings about matters they demonstrably have just enough comprehension of to get themselves deeply into trouble.
Tragically Treadgold reminds me of a boy who blew himself up when experimenting with home made explosives some 40 years ago. He knew just enough about the matter to think he could to dabble with a potent chemical mix and not enough to know not to do that….!
My suspicion is that the Arctic would be the equivalent of Pearl harbour.
Well something has got to bring the US into this war. Or, rather, help get them out of the war they (and we) are conducting on the climate. (I realise that wasn’t how you were using the metaphor, but it was the connotation that jumped out at me.)
Thanks for all the brief answers. I’m looking forward to learning more about the possibility/probability/timing of annual ice-free Arctic.
@Dappledwater – Sounds like it is already time to start preparing the public for (a) what we mean by “ice-free” Arctic (I can just picture the stories once some scientific body declares a particular year is “ice-free” and some lame denier journo takes a trip to Northern Greenland to get shots of the remaining sea ice) and (b) what an ice-free Arctic means for the climate (i.e. not necessarily immediate tipping point tomorrow but pretty damn bad news). The year that it happens (and it may happen quickly), the messages need to be ready because there is going to be a storm of media coverage.
I’ve had some discussion on “ice-free” before but I haven’t found a definition for it. Can you point me to a definition that is widely used?
Most modelling shows a rump of older, thicker ice hanging on to the north of the Canadian archipelago for some time after the rest of the ocean is seasonally ice-free. You can pick your threshold — for me, something under 1m km2 would make sense because if the modelling’s right, that would mean most of the Arctic ocean was open for shipping.
Thanks Gareth, incidentally that was my take as well. But no sources for NSIDC’s definition of ice-free?
Someone Neven’s blog said it meant below 20% of the average. As I can’t now find that comment, I can’t expand on that nor check for a reference. I’m sure someone else will have seen it though….?
Thanks Adam, but I can’t believe that’s the definition. If it was, NSIDC would have already called the Arctic ice free.
Also 20% form the average is a strange metric by itself. It would mean that (hypothetically) decades of ice free Arctic the Arctic would become non-ice-free at some point because the average gets lower and lower until small bits of ice in fjords would get within the 20% of the average.
My guess follows Gareth’s idea of a fixed amount of km2 sea ice above e.g. the 80N latitude. E.g 1m or 2m km2.
The reason I’m looking for the official definition is that without a fixed definition there is always room for the other side to twist and turn and dispute non-ice-freeness.
I suspect the term “ice-free” is not going to be useful for the reasons Byron mentioned above. Open ocean is probably a better term, as it doesn’t matter if there is the odd iceberg or floe (you get those in the Atlantic, and I don’t think anyone could deny that the Atlantic is “open”).
We certainly do not have any evidence of “open ocean” in the winter Arctic any time in the last several hundred thousand years, so if that happened, it would be a pretty strong indicator of change.
The definition of open ocean is pretty easy as well – if a non-ice strengthened ship could sail through 90°N, that would be a pretty open ocean…
Sorry, I meant the “current” average – as in the 1979-2000 – not as in a moving average.
I found the quote:
“By “ice-free” Maslowki tells me he means more than an 80% drop from the 1979-2000 summer volume baseline of ~20000km^3. Some sea ice above Greenland and Canada may survive into the 2020’s…” Joe Romm
From here: http://tinyurl.com/33q8l5n see above and below in the thread for more discussion. I guess the original quote can probably be found at Climate Progress somewhere.
CTG, thanks for your thoughtful comment!
Adam, thanks for the quote, that’s exactly what I was looking for. Btw, I’m sorry I misunderstood you so easily. 😉
No worries – my sloppy wording. 🙂
Thomas, whaaaaat?. Every thread doesn’t have to be about you-know-who.
I’ll get back to you. Sounds like we could have a bet.
Something like NSIDC Sept monthly mean below [choose threshold: 1m/0.8m km2?] on or before [choose date] would work for me. I wouldn’t mind if someone wanted to put some error bars on my projections though… 😉
A sobering analysis–albeit one whose results are not entirely unanticipated. Mind if I link to this post at my reflective article here?
For what it’s worth, I think that an ice-free summer in the Arctic will be very, very hard for the opposition to spin. No doubt valiant efforts will be made (I’m being charitable with that adjective, I suppose), but the net result may well be an erosion of their credibility.
But unfortunately the timeframe seems likely to coincide all too well with the deadline for achieving zero emission growth in time to avoid 2 C warming.
Feel free to link, Kevin.
For governments and the general public rather than the ideologically opposed the loss of summer ice will be an effective wake up call (you can already see this in the increasing jostling for strategic advantage in the Arctic). For the µWatts crew, I confidently predict we’ll hear “it’s happened before, therefore must be natural”, and much attention will be paid to the rapid rate of winter freeze…
Thanks, Gareth–will do.
From what I recall, the best hope WRT the clathrates is that the methane doesn’t make it all the way up the water column–harder to do that, apparently, than one might think.
Unfortunately, some of the biggest deposits of methane are under a warming permafrost cap on the floor of the East Siberian Shelf — where the water column is often only a few 10s of metres deep.
Thanks for that Gareth. Not.
Not good to know.
@ Gareth – my deepest concern, clathrate gun hypothesis with methane deposits near shorelines subject to further warming. Other potential impacts: albedo, permafrost loss (more CH4).
Given CH4s global warming potential (GWP) of 72 (20 yrs) should we be concerned about a GHG “pulse” kicking off 2015-2020?
I think most know what that means…
Still:
1) deeply concerning and
2) I can actually see the deniers trying to claim “it’s happened before, and part of the natural cycle of things”
Another prediction for 2015:
http://www.treehugger.com/files/2008/12/arctic-melting-2015.php
“It’s hard sometimes to make heads or tail of all these gloomy predictions — what with the projected year always changing (just scan through our previous posts on the subject to see what I mean) — but, for what it’s worth, some scientists are now pegging it at 2015. That, according to David Barber of the University of Manitoba, will be the year when all of the region’s sea ice will be gone for the first time. There will still be ice during the winter, of course, but, as Barber put it to Winnipeg Free Press’ Kevin Rollason, it will “always be first-year ice”.”
Prediction made in 2008.
No offence mate, but I really want you to be wrong.
You and me both, WTD. Unfortunately, the 30 year climate commitment (aka warming in the pipeline) makes the loss of summer ice effectively inevitable (IMHO). Whether that is also sufficient to increase methane release from the arctic sea floor clathrates to levels that make any efforts to reduce carbon emissions irrelevant remains to be seen. I’ve been on the look out for news from the East Siberian Shelf, but there doesn’t seem to be much out there now that the IPY’s finished.
Indeed, projections for 2030-50 support at least 2+ degree warming even if we implemented dramatic cuts to emissions. So one way or another a warmer world.
Let’s hope the thought of event to rival the PETM gets decision makers getting serious.
http://en.wikipedia.org/wiki/Paleocene%E2%80%93Eocene_Thermal_Maximum
Pennys will drop for even the most “sceptical” politicians at some point – just when, and how late is a matter of conjecture.
[shudder]
Well maybe the weather effects are not *whole* hemispheric, but I’d hazard a guess the weather on areas under polar and Ferrel cells will be more errant as the Polar high ceases to exist because of the loss of the ice. It’ll be Greenland/eastern Canada high then, with another patch of high pressure between W/E Siberia. I’m very much guessing here, no predictions.
Since it won’t be ice-free for more than a few weeks, may not be ice-free each year for a while, the knock-on effects will be relatively subtle, and there won’t be much shock value when it finally does happen since we’ll have been talking about it for years, I predict that it won’t be any sort of tipping point for public attitudes. Unfortunately.
Late to the party, but great article, Gareth!
What about the РоÑÑÐ¸Ñ Ð¾Ñ‚Ñ€Ð¸Ñ†Ð°ÐµÑ‚
http://en.rian.ru/russia/20100427/158771845.html
I’m afraid you could say that the good Drs Sokolov and Pokrovsky are well out of the mainstream, even in Russia, given their government’s enthusiasm for staking claims to large parts of the Arctic Ocean.
I finally got back to this: http://scienceblogs.com/stoat/2011/02/this_years_sea_ice.php