
 The National Institute for Water and Atmospheric Research (NIWA) released details of its recalculated New Zealand temperature series last week and in the last couple of days Richard Treagold and the Climate “Science” Coalition have issued statements in reply. And what a contrast they provide: Bryan Leyland for the NZ C”S”C is all bluster, demanding the resignation of the NIWA chairman and a declaration that the new series is “not valid” (whatever that means). Treadgold, meanwhile, describes the NIWA study as a vindication of his original “report”. One hopes they attend different carol services, because they’re clearly singing from different hymnals.
Lets review events to date, and see what the latest NIWA report really demonstrates…
Late last year Treadgold and the C”S”C released a “report” which claimed that NIWA’s long term NZ temperature record had been fiddled to show warming when the raw data showed none. NIWA explained that when stitching together long term temperature records from lots of different sites, you had to account for site and equipment changes by making adjustments up and down — and that’s what they had done. The original development of the series was carried out by Jim Salinger in 1981 and updated at MetService in the early 1990s. In meteorological and climatological terms neither the methodology nor resulting temperature series was controversial. NIWA moved on to show that if you took long term records that needed no adjustments, you still saw warming. Case closed, you might think.
Not good enough, cried Treadgold and the C”S”C — we want to know exactly what you did at every step, or we won’t believe you. ACT MP, government minister and parliamentary climate denier-in-chief Rodney Hide lent his weight to the crank cause and a blizzard of parliamentary questions followed. As a result funding was found to allow NIWA scientists to work on the NZ long term temperature record. Which they did, diligently and carefully.
In August, when the NIWA work was already well advanced, Treadgold and the C”S”C decided they could wring more publicity out of the affair by asking the High Court to declare the NZ temperature record (Salinger version) invalid. Cue a minor flurry of press coverage, a frisson of excitement in crank circles and then — nothing much. Until now.
As I noted last week, the “new” long term temperature series that NIWA has constructed from the raw data shows pretty much the same thing as the “old” series — the same pattern of warming, and at the same rate. In effect, all the work that the NIWA team has put in (and I’m told it was substantial) has resoundingly vindicated the old series originally constructed by Jim Salinger. It’s not a slavish reconstruction of Salinger’s adjustments — that would have added nothing to our understanding of NZ’s temperature history — but it does provide for the first time a comprehensive explanation of all the adjustments at every station used to build the record. That’s useful, of course, but hardly ground-breaking new science.
The difficulty for Treadgold and Leyland is that they now have to try present defeat as victory. Treadgold’s approach is the simplest: issue a press release that rewrites history, throw in a few red herrings and cherry-picked quotes, then claim that the new record isn’t evidence for global warming. Here’s his conclusion:
“NIWA makes the huge admission that New Zealand has experienced hardly any warming during the last half-century. For all their talk about warming, for all their rushed invention of the “Eleven-Station Series” to prove warming, this new series shows that no warming has occurred here since about 1960. Almost all the warming took place from 1940-60, when the IPCC says that the effect of CO2 concentrations was trivial. Indeed, global temperatures were falling during that period.
That’s a straightforward misrepresentation of what NIWA’s report actually says (page 8):
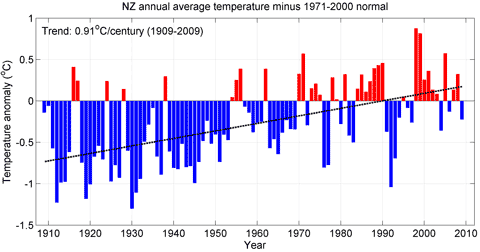
The unusually steep warming in the 1940-1960 period is paralleled by an unusually large increase in northerly flow during this same period. On a longer timeframe, there has been a trend towards less northerly flow (more southerly) since about 1960. However, New Zealand temperatures have continued to increase over this time, albeit at a reduced rate compared with earlier in the 20th century. This is consistent with a warming of the whole region of the southwest Pacific within which New Zealand is situated.
Here’s the graph:
Our unreliable witness then makes a truly heroic leap of faith:
“The new temperature record shows no evidence of a connection with global warming.”
I beg your pardon? NZ warms by 0.9ºC over the last 100 years — slightly more than the global average — and that’s not evidence? The world warms, NZ warms, and there’s no connection? Astounding intellectual “flexibility” on display.
Bryan Leyland’s press release is chiefly remarkable for the effort he makes to spin controversy out of nothing. It’s thin stuff, but I can’t resist drawing your attention to this remarkable paragraph near the end:
“We find it intriguing that NIWA now tells us that most of the claimed warming occurred in the first half of last century, whereas most of the increase in greenhouse gas (GHG) emissions did not become apparent until the second half of last century, which bears out the assertions of climate skeptics that the minimal warming that ceased about 2002 was due to natural cyclical changes, not GHG emissions and, that, therefore, there is no justification for ETS. The likely continuation of the current cooling phase will make that increasingly evident during the next couple of years,” said Mr Leyland.
Current cooling phase? At the end of what may yet turn out to be the warmest year of the warmest decade for what, at least a few thousand years? I wonder if Bryan would be willing to make a little wager…? [Terms and conditions on application.]
But there’s one final hostage to fortune in Leyland’s press release:
He added that NZCSC will conduct its own detailed analysis of the latest NIWA 7SS as early as possible in the New Year, and that it has been promised support from climate and statistics scientists at home and overseas whose qualifications are impeccable. “If NIWA can’t get it right, we will”, Mr Leyland concluded.
The mind boggles. Who can they have in mind? Ed Wegman perhaps?
“The likely continuation of the current cooling phase will make that increasingly evident during the next couple of years,†said Mr Leyland.”
Yeah, but “skeptics” don’t need science to understand global warming (or cooling). It’s real hot up here in Northland, ergo no cooling phase.
Dear Gareth:Well done with your analysis! There is very little that I can add to this. The comments by Treadgold and Leyland are not only contradictory, but also monumentally stupid. I have read the whole document by NIWA and I congratulate them on their thoroughness and exactidute. A very thorough rebuttal of the previous comments. Well done to all involved.
The NIWA report is exactly the science report that we expected, and meets all of the standards that we in the scientific community expected.
I don’t expect that my endorsement will mean much to Dunleavy and his cohorts, But to be frank, I don’t care. There are many others in the science community of NZ who will care. And that is why I am prepared to make this endorsement.
How remarkable Mr Hunter. You seem to blithely skip over the fact that the Australian BoM indicated that adjustments appeared necessary but it was unable to verify NIWA’s adjustments because NIWA failed to supply the raw data.
Niwa essentially says “the dog ate our raw temperature data but trust us to have adjusted it correctly” and you, Mr Hunter, swallow that line without a moment’s hesitation.
What joy it must be to be so gullible. Did you also write to Santa Claus this year?
Read the NIWA document. The adjustment data and reasoning is all there. Your comment is bullshit.
It’s not the NIWA document that matters, it’s the BoM document in which about 80% is taken up with disclaimers and mention of the absence of the raw data. The remaining 20%, as I mentioned, does NOT endorse NIWA’s adjustments but merely says that adjustments appear to have been necessary.
To those disapproving of my comment I say “Diddums”.
Do you realise how utterly ridiculous it is to defend an organisation by citing what that organisation’s claims about the reviewer’s comments?
Do you realize how utterly ridiculous it is to criticize a scientific organization for presenting Information in a manner that can be properly assessed by anyone competent to do so? Probably not, it would appear.
And your comments are still bullshit.
And how, pray tell, can NIWA’s claims be properly assessed or reviewed when it fails to produce the raw data that underpin those claims? Clairvoyance?
Hi Keith,
Sparring with trolls only encourages them. Some are paid to do it, some do it for lulz. None are here to learn, so they will never change their meme.
We say DNFTT – Do Not Feed the Trolls!
Cheers, and enjoy your Christmas!
Are both illiterate and innumerate?
I can see what’s wrong with the gang that haunts this blog, it can’t take the truth.
You make yourselves a laughing stock when you won’t display postings that you don’t agree with.
By the “gang that haunts this blog” I assume you mean those who keep insisting that global warming is not happening, insulting people personally and showing a general lack of understanding of climate science.
Carol,
This is a 10♥ “You Don’t Understand Us”
An industry lobbyist can buy time by saying that their positions are misunderstood. They are a sophisticated, nuanced entity that needs more time to understand before any proposals advance.
Not.
This rather reminds me of Don Easterbrook’s crop failures due to the incipient ice age. Goes to show that you really can believe anything if you put your mind to it!
(Yes John, we all know you think he’s right.)
The comments by Treadgold and Leyland aren’t as contradictory as the differences between NIWA’s 7 Station Series & their 11 Station Series. On the one hand NIWA states that the 11SS is correct due to the fact that none of the stations have ever been moved and as a result needs no adjustments, but on the other hand NIWA state that the new 7SS is correct. The fact that the 2 temperature series give different results is the real Christmas cracker for the AGW cranks.
C’mon you superior AGW brains, explain which is it the 7SS or the 11SS? Or does the picture & title of this article apply to you?
The two series are different. The 11SS was constructed to demonstrate that NZ warming could be seen in unadjusted sites — remember, this was when Treadgold was claiming all the warming was an artefact of the adjustments.
The NZ temperature record is what it is in the station data, but the exact values you get for warming in any long term series will vary depending on what selection of stations you make to construct the series. Read NIWA’s report for a discussion of why trends vary across the country.
Mr Renowden joins the gullible Mr Hunter. “warming could be seen in unadjusted sites?” You haven’t done your homework have you! Not for you this untidy matter of UHI or stations that are relocated.
… and no doubt those who disapprove haven’t done their homework either.
What foolishness it shows to be rushing in without first establishing the facts.
More bullshit
Hi Keith,
This is a 3♠ “Wait and See”
At this point, the denalist engages in delay. The problem that doesn’t exist, and the harms that do not occur will continue not occur in the future, if we just wait.
Practiced by the firm of “Dolittle and DeLay”.
Merry Christmas!
Thanks Artful: I will try to follow your good advice in the future.
Read the original report properly, then see if you can say anything intelligent about it – I won’t hold my breath. There is no fundamental inconsistency whatever. The 11SS includes outlying islands, and with the geographically variable levels of warming over the country there’s no reason why results should be identical – and the timespans of the two series are not the same either.
You ignorant, multiply-aliased trolls are all going to crawl out from under your bridges in a vain attempt to refute the irrefutable, now that the confirming NIWA report is out.
Tell me again about the standard of “science” that appends sea-level records to ones from 126m ASL? Contemptible is too mild a word to describe you lot.
There most definitely is an inconsistency between the 7 & 11 Station Series:
http://www.niwa.co.nz/our-science/climate/news/all/nz-temp-record/seven-station-series-temperature-data
http://www.niwa.co.nz/news-and-publications/news/all/2009/nz-temp-record/temperature-trends-from-raw-data
The 11 SS series shows a warming from 1950 onwards, the 7 SS doesn’t. Take the time to actually look at the data, then see if you can say anything intelligent about it – I won’t hold my breath. I find it hilarious that you accuse me of ignorance when you haven’t even looked at the graphs, it doesn’t get more ignorant (or hypocritical for that matter) than that.
If there’s ‘no reason why the results should be identical’ then it shows the futility of having a global temperature established via land temperature readings. The results can be whatever are desired. If not, then you can explain which of the 2 series gives the correct temperature record, a scientific standard if you like. According to your reasoning there is no correct temperature record, it’s just a matter of which to choose to fit your purposes.
As far as refuting NIWA’s report, that’s what is supposed to happen when the scientific method is adhered to. Why so hostile, what are you afraid of?
Contemptible is a word I’d reserve for those who extort money fraudulently.
“The 11 SS series shows a warming from 1950 onwards, the 7 SS doesn’t.”
Either you posted the wrong graphs, or what you say is plainly untrue. Both show a roughly 0.7 degree increase since 1950.
Now that really is funny. Try averaging the temperatures from 1950 onwards, instead of blindly following the existing trend line that originates in 1909, there’s little if any warming for the last 60 yrs.
You can’t be serious. The anomaly in 1950 for both graphs is roughly -0.5. Today it’s roughly +0.2. You must be hoping that no one actually looks at the graphs.
Just for laffs, I downloaded the data and truncated each series so that they started at 1950. For the 7 station data, the trend is 0.73 degrees per century, and for the 11 station data, it’s 0.96 degrees per century. This is a bit less than from eyeballing, but both are clearly positive. So you are clearly wrong.
Area Man,
Can you give me a link to where you downloaded the data so I can plot it myself?
Thanks
You can download Excel spreadsheets from the pages for each respective graph.
Here is direct link to 7 SS:
http://www.niwa.co.nz/__data/assets/excel_doc/0011/99965/NZT7_Data_FINAL.xls
And 11 SS:
http://www.niwa.co.nz/__data/assets/excel_doc/0020/103862/11station_temperature_series_data.xls
Ah, SM (that’s Skeptic Myopia) strikes again!
In this sad affliction so much time is spent picking out convenient details that the subject completely loses any capacity to see the larger picture.
Sure it does pal. I don’t know how you managed to come to that particular Michael Mann conclusion, but there’s a problem in that even NIWA disagrees with you. You and your buddy bill both seem to be a meat pattie short of a quarter pounder. But don’t take my word for it, let’s see what NIWA has to say:
‘The unusually steep warming in the 1940-1960 period is paralleled by an unusually large increase in northerly flow during this same period. On a longer timeframe, there has been a trend towards less northerly flow (more southerly) since about 1960. However, New Zealand temperatures have continued to increase over this time, albeit at a reduced rate compared with earlier in the 20th century.’ – Niwa’s 7SS report:
http://www.niwa.co.nz/__data/assets/pdf_file/0010/108928/OverView-7Stn-Series-web.pdf
The temperature increase from 1950/60 has been minimal, certainly within natural limits, and more than likely within any margins or error.
Cripes, it must take a serious lack of basic comprehension to contradict yourself like that. Let’s review.
You:
“The 11 SS series shows a warming from 1950 onwards, the 7 SS doesn’t … there’s little if any warming for the last 60 yrs.”
NIWA, referring to the 7 SS data:
“However, New Zealand temperatures have continued to increase over this time [since 1960], albeit at a reduced rate compared with earlier in the 20th century.’ – “
You claimed the 7 SS showed no warming since 1950. The section you just quoted from NIWA directly contradicts you. And the actual data, available for download and conveniently graphed on their website, also contradict you. I don’t know what mental dysfunction prevents you from just admitting that you’re wrong.
Let me explain it to you in the most basic of terms Area Man, so you can understand. If we take your statement below:
‘I downloaded the data and truncated each series so that they started at 1950. For the 7 station data, the trend is 0.73 degrees per century’.
And then we compare it to 2 facts from NIWA:
1/ The total temperature rose by 0.91C in the last century.
2/ Most of the warming occurred in the first half of the century.
If your calculation of 0.73C for 1950 onwards is correct that means that the warming in the first half of the century was 0.18C. Correct?
Really, how dumb can you get. I’m just wondering whether the public schooling system has let you down, your parents, or whether your stupidity is genetic. I thought I’d seen it all, but that one really takes the cake. Is there such a thing a devolution?
With regards to my ‘no warming since 1960’. The warming is negligible and as I said more than likely in the margin of error.
“If your calculation of 0.73C for 1950 onwards is correct that means that the warming in the first half of the century was 0.18C. Correct?”
Bzzzt, wrong. You’ve obviously confused the trend with the anomaly. If you are too innumerate to know the difference, it’s not worth wasting further time with you. It does explain how you’ve arrived at a position that anyone with two eyes can see is wrong though.
“With regards to my ‘no warming since 1960′. The warming is negligible and as I said more than likely in the margin of error.”
You originally said there was no warming at all (which is wrong), and that there was a major discrepancy between the 7 SS and 11 SS data sets in this regard (which is also wrong). Now it appears the goal posts have moved. Now it’s just that there wasn’t that much warming since 1950 (or was it 1960?).
First, this is completely irrelevant to the validity of NIWA’s analysis. You’ve basically conceded that you have no point against them. Second, you haven’t provided any evidence that the warming is within the “margin of error”, whatever that’s supposed to mean. Not that you’re capable of calculating it anyway.
If your calculation of 0.73C for 1950 onwards is correct that means that the warming in the first half of the century was 0.18C. Correct?
I know, I know Bill DNFTT……………. but this is just silly.
JW, read again what Areaman wrote, and what you just copied. He plotted the trend for the latter half of the 20th century (1950 onwards). That trend was 0.73C per century for the seven station series. Pre-1950 was excluded from his analysis. There is no 0.18 C.
We can help, but the learning part is up to you.
oh, quite the opposite; DPTLRBI – please don’t vote this into obscurity! let’s let this little Dunning-Kruger nugget stand for all eternity!
how’s your barbeque, ‘pal’?
You guys can try and dress it up how you like, but the fact remains there is practically no warming in the 2nd half of the last century. I know it irritates you, but unfortunately it’s the pure, unadulterated, inconvenient, scientific truth, that is published by your friends at NIWA.
Bill – go fuck yourself, pal.
JW – By my count from the graph over the past 50 years 27 years have had warm anomalies and 23 cold, but over the last 25 years there have been 16 warm years and only 9 cold and over the 25 years before that 9 warm anomalies and 14 cold. And even though 2006 is blue – it looks to be roughly warmer than two-thirds of the years before 1960. Also, you might want to ask yourself what years were the El Chichon and Pinatubo eruptions? (1982 and 1991 – in case you are interested). Best wishes in re-evaluating your position!
Something strange here!
The trend for the whole 100 years is 0.91/century and the trend in the 1940-60 period was about five times higher than the average. That was a result of natural variability.
The trend after 1970 (when CO2 was becoming relevant) was around a third the average.
Thanks for the links to the data, Area Man.
Also just for a bit of fun, I recalculated the 7-station series anomalies against the 1961-1990 average for each site (because that was the reference interval for the 11-station anomalies) and plotted the mean of these year-by-year against the corresponding 11-station mean anomaly data for 1931-2009. The correlation coefficient was 0.94 and slope was 0.98 +/- 0.03. Not surprising and subject to issues of auto-correlation, but nonetheless a vivid illustration of how far JW is off the mark.
Sorry, I forgot to attach this to my previous comment. What a joke.
http://hot-topic.co.nz/nz-temps-more-stations-no-adjustments-still-warming/
JW: Global temperature products aren’t just simple global averages. They include temperature maps and show how temperature varies over the globe – which parts are warming most, which parts are warming slowly or cooling.
Why can’t you grasp this simple concept – the globe as a whole is warming, no matter what happens in the fine detail. But since you lack the ability to read a graph, I won’t be holding my breath.
It’s clear that the JW-troll is myopic – and pretty damned stupid as well.
RW, this was played from the Denialists’ Deck of Cards:
8♠ “Duh!”
With “Duh!,” the denalist deliberately misunderstands, misinterprets, or plays dumb when presented with others’ questions or proposals.
Whether human activity has had any discernible influence on that warming is another matter entirely. Call me bold if you will, but I figure that coming out of a Little Ice Age does require a substantial period of warming.
“I figure that coming out of a Little Ice Age does require a substantial period of warming”
Wow. Thumbs down, eh? Addle brained alarmists sure as hell don’t like a slap in the face with a simple dose of logic. If your comment makes it to the poorly rated bin, consider that a win, JohnM!
‘Goodnight, sweet Prince’. Keep the little red clicks coming, folks!
“Considered alongside the empirical evidence, model predictions and a century of scientific research into the climate, recovery from the LIA is not a plausible theory to explain the observed evidence and rate of global climate change.” See why at http://www.skepticalscience.com/coming-out-of-little-ice-age-basic.htm
Musta rattled a few cages Gareth,
my spamfilter tells me Joe Fone sent me something but it was deleted as “suspicious”.
It seems pretty plain that the ignorant folk like Fone and Treadgold didn’t run this past their ‘science advisor’ before sending it out. Why not?
The NIWA report states that most of the warming in the 20th Century occurred prior to 1960 (as shown in the 7SS), and the graph shown on this page confirms that.
Is there any dispute here?
Actually John, most of the warming in the 20th century occurred prior to 1999, that fact seems just as relevant as yours does.
rc, I’m not sure I am following your line of reasoning here.
Ignoring the issue around century end dates, (i.e 2000 is the last year of the 20th century), you are stating that most of the warming of the 20th century occurred in the 20th century.
Yes, I am prepared to concede that point.
However, the fact that more warming occurred before 1960 is not in dispute. It is clearly stated in the NIWA report.
Whether this is irrelevant or not depends on your motivation for understanding the data.
If you wish to chose an arbitrary start and end date an claim a warming trend for that period, then so be it.
I haven’t claimed any trend.
However, at a constant warming rate, 50% of the warming would occur pre-1950, 50% post 1950..
With a (uniformly) increasing rate of warming throughout the century the mid point of the century’s warming would occur post 1950.
So I’m still wondering what your point is.
Peer-reviewed by Australia’s Bureau of Meteorology? Got to be kidding. They’re on the same Team, FFS! O man, could BOM teach NIWA a trick or two (if not already)!
http://joannenova.com.au/2010/11/australias-high-quality-data-12-year-sites-used-for-long-term-trends/
Shut them both down, pronto!
DNFTT – PTLRBI !
You want to see the foremost meteorological societies of Australia and New Zealand get shut down?
Why do you hate science?
Played from the Denialists’ Deck of Cards:
10♦ “Bureaucrats!”
The industry denialist often plays this card in order to sneer at proposals that would vest decision making with civil servants
Jo Nova and Warwick Hughes in Australia have shown up the BOM farce ….. the Aus BOM staff should be sacked – whether rain or temperature they predicted almost the exact opposite!!
http://joannenova.com.au/2010/12/could-the-australian-bom-get-it-more-wrong/
I’m sure they’ve done a similarly fine job on NIWA!
You back as well? You’ll disappear in a sea of red before long.
RW, this is a 9♣ “Nit Pick”
With nit picking, the denialist finds one problem with a fact, and then harps on the problem incessantly.
Well dealt Artful!
[Snipped: Write your own comments, don’t simply repeat others verbatim. GR]
Spot on, Lank.
Richard Christie makes a good point, but I don’t think it goes to the source of the dispute.
The report says: “The unusually steep warming in the 1940-1960 period is paralleled by an unusually large increase in northerly flow during this same period….However, New Zealand temperatures have continued to increase over this time [post-1960], albeit at a reduced rate compared with earlier in the 20th century”. From which the conclusion is drawn that pre-1960 warming was greater than post-1960 warming. Perhaps we use English a little differently here in the West Island, but I think JW / John D is/are suffering from major comprehension fail.
It doesn’t say “compared with the whole of the 20th century prior to 1960”. It says “compared with earlier”, which is not specific. Can we work out which “earlier” they meant?
The data says:
Rate for “unusually steep” 1940 – 1960: 4.36 degrees / century
Rate pre-1960: 0.71 degrees / century
Rate post-1960: 0.85 degrees / century.
So the post-1960 rate is greater than the pre-1960 rate. On the other hand, its less than the steep 1940-1960 jump. The only reasonable conclusion – assuming NIWA can read their own data – is that by “earlier”, they were referring to this peak period, not the whole century prior to 1960. The alternate is that JW / John D understand NIWA’s data better than NIWA. Pardon me while I LOL at that prospect.
Area Man……1
JW John D….0
What a completely pointless discussion.
Whether it is 0.9 or 0.8 deg of warming per century, it is quite clear from the graph that nothing unusual is happening to the NZ climate.
memo to self – don’t look at John D’s posts while imbibing fluids!…
Bill,
I am so glad you get so much mirth from my comments.
Now, please explain why you find this so funny.
Played from the Denialists’ Deck of Cards:
2♣ “No Problem”
“No problem” is the chorus of a denalist argument. The skilled denalist, even after engaging in a debate for an extended period of time, will never concede that a problem exists.
roflmao. This is Rich!
Define “unusual”. I would agree that any trend over such a small land area, unless it was pretty extreme, doesn’t mean much. If the trend were slightly negative, that certainly wouldn’t mean that there was no global warming. There must be lots of areas of comparable size that haven’t warmed. But that’s not what this is about.
This whole thing started nearly a year ago when the CSC accused NIWA of having fabricated numbers and declared that there was no warming trend at all. If it turns out that there is indeed 0.9 degrees of warming per century, and that NIWA’s original analysis was more or less correct, then the CSC is wrong and owes NIWA an abject apology. It makes no difference whether the trend isn’t that high, or tapered off a bit after 1960, or whatever. What matters is who is right and who is wrong. And whose credibility is intact.
Define “unusualâ€.
If we assume that the period prior to 1960 was unaffected by CO2 emissions ( as agreed by the IPCC) then if the rate of warming after this period is approx the same as the period before, then there are no conclusions we can deduce from this dataset with regard to the AGW hypothesis.
It neither supports nor contradicts it.
“If we assume that the period prior to 1960 was unaffected by CO2 emissions ( as agreed by the IPCC)”
Say what? When did the IPCC say that?
Hi Frank,
This is a 8♣ “Red Herring”
A red herring is a specious argument–one that sounds cogent, but isn’t really responsive to the issue at hand. Just make something up that sounds good. The more Denialists’ spread confusion, the harder it is for anyone to do anything
Merry Christmas, mate!
Where can I get a copy of that card deck? This is great!
Hi Thomas,
The card suites are HTML character codes. Simply type in the HTML-code and remember to remove the spaces in these samples:
Char HTML-code
♣ & clubs ;
♦ & diams ;
♥ & hearts ;
â™ & spades ;
Notice that each HTML-code must begin with an “&” and must be followed with a “;”
The characters will not display correctly if there are spaces inside the code string.
Hope this helps, and have fun! Remember to link to the appropriate card in the Denialists’ Deck of Cards.
Awesome, Thanks Artful!
Okay, I will more or less agree with this. Or rather, I will agree that an area as tiny as New Zealand has too low of a signal-to-noise ratio to support or refute AGW over this time frame.
This being the case, why did the CSC think it was necessary to gin up a false crusade against NIWA? Why do they care what NIWA publishes at all? It’s almost as if they’re desperate to discredit a national scientific agency that happens, like their counterparts in every other country, to maintain that the evidence supports AGW. This is the behavior of a dishonest propaganda outfit — unless of course someone has actual evidence that NIWA’s analyses are wrong.
“a national scientific agency that happens, like their counterparts in every other country, to maintain that the evidence supports AGW.”
You said it, bro. Same song sheet the world over claiming “evidence supports” what Prof Harold Lewis – to name just one eminent scientist – described as “the greatest and most successful pseudoscientific fraud I have seen in my long life as a physicist.”
A pox on your AGW crap and any craven institution tweaking warming knobs to prop it up.
Sod off, you obnoxious troll. As I said – they’re all coming out from under their bridges at present. A mass attack of illogic changes reality not one whit.
Played from the Denialists’ Deck of Cards:
10♣ “The False Expert and Growing Petulance”
The denialist is in serious trouble at this point. Whatever problem that didn’t exist has continued to capture regulatory attention…
Ah, Prof Hal Lewis, the almost 90 year old geriatric prof who lost his memory about his own publications:
From Sourcewatch: In the 1990s at a time when climate science was less certain than it is today Dr Lewis wrote a book called Technological Risk in which he states an opinion in line with the mainstream scientific view that fossil fuels are contributing to climate change. In 1992 Dr. Lewis wrote “All models agree that the net effect will be a general and global warming of the earth; they only disagree about how much. None suggest that it will be a minor effect, to be ignored while we go about our business.” He writes further demonstrating considerable understanding of the topic “the bottom line is that the Earth will be substantially warmed by the accumulation of man-made gases mainly carbon dioxide… The only option in the long run is to decrease the amount of waste gases in the atmosphere.“
Excerpts from his book here (NY Times)
http://dotearth.blogs.nytimes.com/2010/10/15/a-physicists-climate-complaints/
After the geriatric prof recently declared that “[Global Waming] is the most successful pseudoscientific fraud I have seen” and resigned from the American Physical Assoc. the APS wrote a stern rebuttal to his nonsense:
http://www.aps.org/about/pressreleases/haroldlewis.cfm
I guess Graham, the fact that you are now down to citing sorry figures like Lewis tells it all.
Your pitiful outburst of insolence only serves to enhance Lewis’ stature. His background as cited by you may well be contrary to his current persuasion. So what? It simply underscores the foresight, courage and integrity of the man to extricate himself from “the global warming scam, with the (literally) trillions of dollars driving it, that has corrupted so many scientists, and has carried APS (American Physical Society) before it like a rogue wave.”
Professor Lewis is one true scientist. There are 1000 like him.
http://wattsupwiththat.com/2010/12/08/shredding-the-climate-consensus-myth-more-than-1000-international-scientists-dissent-over-man-made-global-warming-claims-challenge-un-ipcc-gore/
You may be tempted to slander them as well, but that would be ill-advised. You alone will be diminished by that.
Before you go off on an ageist rant, had it occurred to you that Hal Lewis might have actually changed his mind about AGW?
He wouldn’t be the first one.
Clearly he did, for whatever reason. And? This still puts him in a very distinct minority.
Unusual in what sense JD? A temp trend of 1Deg/century is a very significant trend on geological time scales! And most predictions tell us that the trend will be increasing as positive feedbacks strengthen.
“And most predictions tell us”
diddly squat, Tom. Dart boards are cheaper and just as useful.
http://wattsupwiththat.com/2010/12/05/new-peer-reviewed-paper-shows-just-how-bad-the-climate-models-are/
Graham, your definition of a ‘true scientist’ appears to be one who agrees with your point of view. And there is no point referrencing Watts here, he has been shown over and over to be peddling nonsense and is not considered a credible source of information.
Hi Carol,
This is a 9♠ “Exploit Others’ Ignorance”
This tactic leverages incomplete information to promote confusion. Here, the denialist simply does not offer information, or promotes misconceptions, if it benefits the denialist.
Merry Christmas to Wellywood!
Are you suggesting that the temperature rise prior to 1960 was caused by Anthropogenic CO2 emissions?
Yes or No will suffice.
Again with the pseudo-science, John.
Yes or No will not suffice, because your question is based on a fallacy. There are multiple factors that influence global temperatures, so you cannot say that any one factor, such as CO2, “caused” temperature changes. In the early part of the C20, solar and (lack of) volcanic forcings probably accounted for most of the temperature change, although CO2 forcing was changing in that period as well. In the middle C20, aerosol (negative) forcing was fairly dominant, whereas by the end of C20, CO2 and other anthropogenic forcings took over.
As has been explained to you many times already, the real science is a lot more complicated than “was it CO2, Yes or No?”.
I don’t know why you are incapable of learning this, John.
Well I do know that the real science is a lot more complicated.
But my question has validity.
If there are natural variations caused the early 20th C warming, then can we not attribute these natural variatons to late 20th C warmings too?
I downloaded the Excel sheets and did a quick trend analysis, and I concur with the commenters above, that the pre and post 1960 rates of warmings are approx the same.
So in that respect, I’d like to thank the poster who provided the link. It clears up any confusion when you can run the numbers yourself.
and yes, I hear your comment about the aerosols, but these seem to me very speculative scenarios.
Publish or STFU.
Leyland and cohorts either need to STFU or publish in a peer-reviewed science journal their ‘alternative’ (reality) temperature data…if they have any.
Why not just rely on the historical data (as recorded) and begin the series from 1960 – so that hardly any subjective “adjustments” are necessary? 50 years tells us just as much as the hotly-debated 100 years, and is more relevant to policy decisions.
Trouble is the last half-century shows a warming trend of only 0.1°C/decade, which is probably not statistically significant. Much lower than the global figures.
Duh! 0.1C / decade = 1.0C / century = pretty much the global average trend so far.
Math problems Australis?
Btw: 1 Deg/Century is a massive global gradient on geological scales for Earth’s climate.
Sweet as, Thomas. This is a 8♠ “Duh!”
Well played! The next tune should be Silent Night… as we DNFTT.
Merry Christmas, mate!
Sorry – you are right about the maths problems.
The warming trend for the last 50 years was 0.05°C/decade. This is significantly less than the previous 50 years, so we can all take comfort from the fact that the trend is now decelerating.
Do you mean that Bob Carter (who says no warming since 1998) is wrong?
Australis, you played another 8♠ Duh card, I guess you were dealt a bad hand at kindergarten 😉
http://data.giss.nasa.gov/gistemp/graphs/Fig.A2.lrg.gif
The global trend over the last 50 years according to NASA has been about 0.1 Deg C / Decade or 1 Deg / Century.
For the mathematically challenged who find it hard to see the bigger picture looking at x-y graphs Nasa has condensed the data into a picture:
http://data.giss.nasa.gov/gistemp/graphs/Tvs.year+month.lrg.gif
So blinkers off you denier trolls. Sod off an perhaps deny that the Earth is round on some appropriate blog somewhere. Perhaps Mr. Watts will generate a sub page to his public misinformation enterprise for you there.
“I wonder if Bryan would be willing to make a little wager…? [Terms and conditions on application.]”
Yes.
Terms- UAH (satellite) temperature record
That 2010 won’t be the record high temperature year.
Amount $200.
No, Bryan, my terms, not yours.
You state: The likely continuation of the current cooling phase will make that increasingly evident during the next couple of years, and that’s what any wager will be about — the presence or absence of a “current cooling phase”.
I would wager that (in the absence of substantial volcanic activity) that the global average temperature will continue its long term upwards trend. How we might make that a reasonable bet is open to discussion. You say it’s going to cool, I’m confident the warming will continue, with an overlay of natural variation. That’s what we want to test, not global weather over the last two weeks of December.
Ok.
“The average UAH temperature – volcanoes excluded – will decline for the next two years.”
$200.
Again, not enough detail. As we know (and as Phil Jones famously pointed out) it can take up to 15 years to establish a statistically valid trend (95% confidence), and that applies to cooling as well as warming. If you and I are going to bet on near term numbers — ie over two years — the bet needs careful framing if it’s not to reflect simple variability. Something like “both 2011 and 12 global average annual temperatures below the mean of the last decade” would probably do, but I’ll think more and post something soon. Happy to wager $200 to the charity of your choice.
OK Bryan. On reflection, I think the only sensible bet is one based on ten years data. Two years is not long enough to establish the existence of any sort of trend (see Easterling & Wehner 2009). So: I will wager $200 dollars that the global average temperature (any dataset) for the decade 2010-19 will be warmer than the average for 2000-9, barring major volcanic activity. In addition I will pay $100 for every 0.1ºC below the 2000-9 average, against your $100 for every 0.1ºC over that average.
Acceptable?
First, I am 74, so you are expecting me to live another 10 years. (Or maybe hoping that I won’t.)
Second, 10 years is a long time. If I am right, there will by then, have been more than 20 years of no warming. The warming period that set the whole saga off was from 1976 to about 1998. 22 years. Surely,long before 20 years is up, the whole thing will have resolved itself one way or another.
About 10 years ago, Dr Wratt assured me that climate models were only accurate over a time horizon of 10 years or more. (Which, it now seems isn’t true..) Now you want to add another 10 years.
So overall, I can only assume that you have very limited confidence that warming will resume soon. So, it seems we are in the same boat after all!
How about three years?
“The temperature (UAH) over the last decade will be warmer than the average of the next three years.”
Regards,
If I am right, there will by then, have been more than 20 years of no warming
Errr…..riiiiight. In uppy-downy land maybe, meanwhile on planet Earth:
NOAA Global Analysis November 2010
“For the 2010 year-to-date (January–November), the combined global land and ocean surface temperature was 0.64°C (1.15°F) above the 20th century average—the warmest such period since records began in 1880.”
Bryan, may I express an interest in taking on your 3-yr bet, but for $1000, not $200? I’d also like to suggest that we use the average of the normalised results from the 5 major players, giss, hadcrut, noaa, rss, & uah, as currently illustrated by the “Temperature Composite” graph at http://www.skepticalscience.com/graphics.php?g=7
Your thoughts?
Al.
The short answer is no.
Purely because my debate is with Gareth. The ball is now in his court.
Bryan, I hope you live a long and healthy life. Only then will you be able to appreciate just how misguided you have been.
As others have pointed out, asserting that there’s been no warming for the last ten years is just plain silly, when the 2000s have been warmer than the 1990s, and 2010 one of the top two or three warmest years in the record.
Demonstrating a real cooling trend will take at least as long as it does to prove a warming trend. Two or three years is only weather — subject to ENSO variations, as you have pointed out yourself. (Do read the reference I offered).
So: I’ll offer a ten year bet as above.
Gareth, how about 5 years?
As you said, the last 10 years has been the hottest in the last 150 years, even tho’ temperatures have been more or less stable over the period. So if AGW is true, there must be a lot of suppressed warming waiting to surface. Surely it will surface in 5 years? Where is your faith?
Bryan, I don’t have faith, I have facts and an appreciation of how global average temp can vary even though there is an underlying upwards trend. You could have won a two year or three year “cooling” bet several times in the last 20 years, despite the overall trend being undeniably upwards.
That said, I will offer a five year bet in these terms: I will bet $200 that the global average temperature for the five years 2011 to 2015 will be higher than the average for 2006-10, on any global temp dataset (GISS, HADCruT, RSS, UAH), providing that no major volcanic events affect global temperatures.
Although this is a bet I expect to win, it does not really test your cooling contention, because the period is too short to establish a statistically significant cooling trend — unless a drop in temperatures is huge. In other words, natural variability could conspire to lose me my money, but you wouldn’t have proved anything!
Gareth,
I’m happy with that. But first we must clarify what you mean by “…for 2006-10 on ANY global data set..”
Does that mean that I lose if, for instance, GISS shows warming and ALL the others show cooling?
If so, I reckon it is not fair. But if you mean that only one has to show cooling for you to lose, also not fair.
My first preference is to use UAH alone because it covers land and sea and is not contentious.
If you want the others, lets go for a majority – which is difficult as there are only 4. So add in NOAA. and agree on an average i.e. Any that show cooling count for me and any that show warming count for you.
Gareth,
Just take the damn bet. The average male at 74 has a life expectancy of about 11 years, I understand (from an actuarial table), so a 10-yr bet is cutting it a bit fine, and makes little sense in these circumstances. You’re being offered even money on what we know is a biased coin. How can you turn down such odds?
Yes, but the odds only stack up over the longer term. Short term can be dominated by variability.
I’ve have taken the two year bet, since likely natural variability biases the coin even more.
The last year has been dominated by a very strong La Nina. La Nina’s appear to have the effect of tucking away relatively more heat in the ocean and have a short term cooling effect on temperatures overall (so we are a near record heat with the aircon running close to full blast). So even though he wrongly claims that temps are more or less stable over the last decade (UAH trend is +0.2 deg/decade). Bryan was right about one thing at least – there is a lot of suppressed warming waiting to surface.
While the current La Nina is predicted to last into mid-2011, conditions will eventually swing back to El Nino, dumping all that extra stored heat back into the atmosphere. When it does, look for new global temperature records to be set. Even if we only return to neutral conditions in this timeframe, we would have stopped “hiding” the heat. I would happily bet $200 on 2011-12 being warmer than 2009-10.
But as Gareth says, you can’t prove anything over such short timeframes, so taking an old man’s money is pretty meaningless (and a bit mean).
Ah, this perhaps helps explain the extra ‘guests’? Deltoid’s link here NZ Climate Science Coalition loses, declares victory.
(I have to say I got a good laugh out of comment #7 over there, particularly in light of some of the egregious performances above!)
Excellent, that post #7 is so cool, that I shall do a copy paste here. Hope the author won’t mid.
Poster #6 said:
I never cease to be amazed by the lengths that those who deny global warming and its causes will go to “prove†their position. The best they can do is distort and misrepresent the work of others and flee in terror from anything resembling peer review. That alone should make any sane person dismissive of their views.
Upon which #7 offers this great theory based on recent advances in the understanding of Quantum Physics, superb! …. 😉 :
This phenomenon leads me to postulate the existence of quantum chromodenynamics, wherein reality quarks and trope quacks are bound by a strong moronic interaction. Where the distance between reality and trope increases, the strength of the force attempting to bind reality quarks to trope quacks increases, stressing the cherry-colour field. When the field’s energy threshold is passed, new trope quacks spontaneously materialise to bind with the old trope quacks that are being separated from reality, forming new moron particles in the moronisation process inherent in cherry-colour confinement.
The frustrating corollary from my quantum chromodenynamic model of denialism is that the more energy is invested in attempting to separate trope from reality, the more tropes and morons will apparate…
Merry Christmas to you all!
Simply DNFTT.
Artful,
Have you run out of cards?
Seemed like you were on a winning streak there!
Ah, but with all that running around he’s a bit flushed!
Quote: I have often asked myself, “What did the last Easter Islander who cut down the last palm tree say while he was doing it?”
Like modern loggers, did he shout “Jobs, not trees!”? Or: “Technology will solve our problems, never fear, we`ll find a substitute for wood” ? Or: ” We don`t have proof that there aren`t palms somewhere else on Easter, we need more research,your proposed ban on logging is premature and driven by fear mongering”? Similar questions arise for every society that has inadvertently damaged its environment, including ours. : unquote
Ref. `The Weather of The Future. by Heidi Cullen.
So JW (and associated trolls) I suggest you educate yourselves first to the fate of the Easter Islanders who depleted their resources and authored their own demise and then to the issue of global climate as opposed to local weather.
But this will probably go “Over your head like a pig flying south for winter.” (Now where have I heard that before?).
I suggest that there are those who will not understand or believe what is obvious and logical to others. At the end of the day it matters not, the earth will prevail and we mere mortals will take heed or meet our fate.
The difference between us and the dinosaurs (As in `Its just a cycle`), they didn`t burn fossil fuels to wrack up the CO2s. (Kind of poetic justice that we burn dinosaurs to produce the same result don`t you think.?) The choice is yours, each and every one of you.
And a Merry Christmas to all.
Omigosh, what a ramble. Put that bottle down, eltoro.
“And a Merry Christmas to all.” That’s the bit that makes any sense.
Anyway, same to you, eltoro. Rug up, mate. With durable clobber. (If CO2 emissions warm things up, it won’t be much more than one poofteenth of a bee’s dick, so no help from that quarter.)
gee, not only an organic spambot – a homophobe as well!?
who cares? – the solutions the same either way!
Hi bill,
The correct nomenclature for an ‘organic spambot’ is ‘meat puppet‘.
Enjoy your turkey this season!
Well gee, Graham, that was a fine example of scientific erudition … NOT.
Just had a look at the 11-station series using methods that I’ve been using for Aust temps, looking for non-linear changes. There is a statistically significant step change (p|H0<0.01) in 1957 of 0.6C. There is a trend before this but it's twenty years only and not significant. There is another step change in 1997 of 0.4C at (p|H0<0.05). The series between 1958-97 is flat. The 1998 shift occurs across the southern hemisphere. The increase of about 0.9C is there for the whole series, but it is not a trend.
Just because anyone can stick a straight line through a time series doesn't mean that time series is trending. It may, but it may also be responding in a non-linear fashion. Climate is a complex system.
Actually this should be done for TMax and Tmin separately because they tend to change at different times.
And before those in denial use this as evidence for climate variability, I think you will find, along with everyone else, that change in complex systems like the Earth’s climate system is not smooth. Lock-step movements of CO2 and temp is the last thing we should expect. That's what palaeodata shows us, that's what the obs show (if we analyse them appropriately) and the models are now realistic enough to show similar behaviour. Their timing is different to obs because models have their own internally generated variability.
Dang – the editor flashed off as I was fixing the dates in the previous post. The first step change is 1953, the period of no real trend 1954-97. Sorry, got the dates mixed up with another location as I was copying them down.
Clearly, AGW deniers aren’t showing up here to advance cogent arguments, but just to foster the illusion that there is an ongoing technical “debate” amongst “scientists”.
By doing so, they hope to confuse the uneducated and delay an effective response to the extraordinary risks our civilisation is taking with its future.
Whilst some deniers are willfully blind fools, those behind them, who profit from denial and delay, are criminals and should be treated as such.
Is there any way that I can set the default to show all comments? Forget the nutjobs – but we have guys actually trying to have decent discussion here being “voted down” by the cheerleaders, and the people with their incessent posts from the denialist cards beign cheered on.
Is this a supposed to be a blog for decent science-based discussion, or an echo chamber where anyone wanting debate won’t find any?
I await my own sea-of-red.
It all depends on who you consider a “nutjob”. The red thumbs-down seems to be doing exceeding well so far in clearing the way for an informed discussion of the NIWA temperature series.
“Is this a supposed to be a blog for decent science-based discussion”
Ad hominems, not science, rule on this alarmist site, Spam. That’s why this is my last comment. Good luck to all delusionals here with reinforcing each other’s support of the unmitigated baloney of dangerous global warming /climate change / climate disruption / climate whatever driven by – of all things, FFS – life-giving CO2.
Goodbye and good riddance, you homophobic ignoramus.
And rightly so, aptly named sock-puppet playing the ‘let’s-get-back-to the-science’ troll role.
Anyone who reviews their actual commentary will discover that Graham and John M are simply boorish wreckers with nothing to offer.
JW’s obnoxious behaviour was completely unnacceptable in any forum. In fact, he was very nearly as rude as he was wrong! No loss.
The LRB shouldn’t be used for every post you don’t happen to agree with, or even every poster with a poor track record who just might be on-topic for a change – but it’s a handy tool for dealing with the irrelevant, the goading, the abusive and these periodic troll raiding parties.
Spam, it is not much effort for anyone to click on “Click to see here”, I do it all the time and I am a puny human. The comment is not deleted, just hidden – unlike other blogs where unliked comments disappear within a short time and posters who do not toe the party-line are soon unable to comment at all. Funnily enough, all of those sites are dedicated to deniall of anthropogenic global warming – coincidence or watt?
I’m trying to understand some of this. I don’t get why we cant just see a graph of the raw temperatures or even the adjusted raw temperatures. Instead we are given a graph which measures The temperature for the last 100 years against the average temperature over the last 30 years. In a period where temperatures are naturally rising following the LIA, using the anomaly against the last 30 year average will review mostly blue (negative) anomalies. Why not just show anomalies against the average of the whole time series?
Secondly, if NIWA are confident of their data, will they now change their defence in the court case to one where they are supporting their temperature record and suggesting it can be used for public research?
Finally, regardless of the above points, it seems clear the temperature anomaly has declined over the last 11 years of measurements which is during a period where IPCC expectations were that the temperature anomaly would continue to rise due to continued increases in CO2 emissions?
Read the report.
Thanks for your bleeding obvious suggestion. I did. those three points are not tackled, ergo my questions.
Next you’ll be asking why aren’t the red-bars green and the blue-bars gray? As much as the CSC and it’s “charitable” off-shoot would like it, NIWA can’t cater to the whim of every denier crank out there. The data is all freely available and the methodology described, so go do it yourself.
Your last question seems beyond the scope of the judicial review so was unlikely to be addressed in the report.
Hmmm – your name suggests you might be the same twerp who pops up on “NZ weather forum” occasionally.
Sorry, but from the nature of your questions it did not seem so. Perhaps you skipped the appendices. If so, then you the answer to your first question can be found there.
Your second question is irrelevant as the accusations before the court are (and always have been) without merit.
Your third question has been dealt many times with on this blog and others. If you truly want to understand, then read Global warming stopped in
1998,1995,2002,2007,2010, ???? at http://www.skepticalscience.com.Happy Holidays!
James-
Considering your silly comments, I suspect that your statement claiming that you have read the NIWA report is false. In fact, I doubt that you even have looked at it. Further, I doubt you know much of anything about statistics. Prove me wrong – explain the subject of the footnote 15 at the bottom of page 163.
The silly behaviour of the denialist club in this thread shows a few things …again!
Firstly, very limited scientific and statistical skills.
Secondly, rigid belief systems, probably idealogical, that make it impossible for them to look at information and take part in a discussion about it in any reasonable or rational manner.
Thirdly, the height of their ambition seems to be that of spoiler, hence the juvenile insults and sock-puppetry.
All of which, reinforces the complete emptiness of the “case” that our local loons are presenting. Gareth has it about right, and the string of nonsense that has followed from the denialist club confirms that.
Makes you wonder exactly what they think they are achieving, doesn’t it?
Threads like this prompt me to restate my theory of tryouts.
The liars and frauds of NZC“Sâ€C who sockpuppet here do not expect to convince anyone here. They come here to trial their delusions before a tough audience. We pick holes in their idiocy. They make minor tweaks and take it to another forum with a soft audience.
G’day Doug – that link seems to have an extra set of ” marks! Assume you meant this.
They’d be looking for a consistently poor standard of numeracy and comprehension! I’m sure we could all think of some appropriate venues…
johnmacmot said – Makes you wonder exactly what they think they are achieving, doesn’t it?
I came here from Lambert’s site. The trolls and the denialist crowd in your neck of the woods, talk just like those that we deal with here. Denialists are not interested in a discussion; they only want a forum in which they can create the illusion of controversy. When they throw s—t against the wall, they don’t care if it sticks or not – it only matters that they throw the s—t then use that to as proof of a controversy. This activity is an end in itself and is all that their corporate paymasters (yes, I know that many of them are simply sycophants and camp followers who are currying favor.) require of them. Truth is expendable, honesty must be avoided and facts are only useful if they can be distorted. We can make light of their apparent ignorance and duplicity but this is a minor irritant to them, it does not impede or obstruct their efforts. If, as Mike Palin did, you point them to the data they simply claim that it is, somehow, inadequate.
James said – I’m trying to understand some of this. I don’t get why we can’t just see a graph of the raw temperatures or even the adjusted raw temperatures.
Is he really trying to understand some of this? If he were, he wouldn’t need the “raw data†– is he a climatologist that can do a reliable analysis of any raw data or is he just throwing more s—t against the wall the wall? The raw data will not be a graph. And you gotta love John D’s statement: “Whether this is irrelevant or not depends on your motivation for understanding the data.†Is there any doubt as to his motivation?
Thomas – Thanks for that wonderful quantum chromodenynamics, riff.
Artful Dodger – Thanks for the link to the cards.
(note to moderator: this is dispensable – remove at your discretion.)
“[Snipped: Write your own comments, don’t simply repeat others verbatim.â€
GR, please note – I was not attempting to repeat Graham’s comments as mine – I’m working on a hypothesis – there are low grade trolls that are not skilled at disputation but are able to alert their more experienced comrades that it is time for them to enter the fray – first you get people like JW and Graham who are only capable of ad hominem attacks then James jumps in (as in tag-team wrestling) to bring his formidable skills to bear. An analysis of this phenomenon across many postings might yield a useful hierarchy of denialist relationships
Chromodenynamics should properly be attributed to Bernard J at Deltoid. Great stuff, too.
Tag team: interesting concept. We do have one or two commenters of the sceptical persuasion who do (sometimes) ask interesting questions, or questions to which finding the answer is sometimes interesting, but I’m not sure I’d count James in that select company…
Graham – do you understand that to reference Watts is to paint yourself with a brush already heavy with tar. Take a step up and follow Dunning’s example – reference junkscience for crying out loud. They, unlike Watts are serious about their junk.
Gareth – thanks for the attribution and I’m quite sure that you’re right about James.
I think this site ably demonstrates the current problem in the ‘climate change debate’. If people raise genuine questions they are immediately labelled deniers, trolls or insulted because they are clearly not the climate geniuses the rest of you are. Yet the basic questions are either only half answered, avoided or we are told they are irrelevant.
I am in fact extremely skilled and experienced in statistical analysis beyond what most so called climate scientists are. I therefore know how easy it is to present statistical data to tell whatever story you want to tell. I see this done on a daily basis in the climate arena.
If accusations before the courts were without merit, then surely the defence could have easily tackled those accusations rather than take the approach they did which was simply to say NIWA had no responsibility to provide the data which was being disputed?
Yes I know the ‘SkepticalScience’ and “RealClimate’ sites deal with the questions regarding declining temperature anomaly’s when models predict they should be increasing, but they are smeared with chronic vested interests, their explanations have been found wanting on a regular basis, often clutching at straws, their ‘party line’ changes continuously depending on what is happening in the real world. Just as with obviously overt denier sites, their content needs to be taken with more than a grain of salt.
It is no wonder that when met with the superciliousness, dodging and weaving responses to genuine questions they raise, those who have genuine questions soon turn into hard core sceptics. The more the ‘alarmists’ respond in the way you do at this site, the greater the sceptic ranks will grow. In the end you just shoot yourselves in the foot, while continuously patting yourselves on the back about how clever you are and how you ‘owned’ that denier or troll!
“Declining temperature anomalies” ?!?
Where? When? Have I missed something?
This is supposed to be an example of someone who can make a good argument for the skeptic side?
Skeptical Science and RealClimate are controlled by ‘Chronic vested interests’? Ahuh! As opposed to all those humanitarian organizations funding the other side of this argument from the proceeds of cake stalls!
If you are indeed the mathematical genius you claim – we get a lot of that – feel free to point out any peer-reviewed commentary on the subject you have published.
Incidentally, to my knowledge no-one here has ever claimed they ‘owned’ a troll – or the even more ridiculous ‘pwned’ – I’ll wager you say this only because this is a standard cut-and-paste spiel you routinely trot out.
And lets have a look at the poor, sweet, little inoffensive trolls whose innocent desire to learn has been thwarted, shall we?
First up, ‘John M’ tells Professor Keith Hunter –
Find me the bit where he was provoked into that!
Do you think we can’t review what’s written above? Oh, that’s right – you’re only dropping by because you fancy yourself as some sort of specialist, apparently, you don’t actually have to read this stuff.
This charming gentleman continues makes unfounded and unreferenced assertions, and tells anyone who objects to his behaviour ‘diddums’!
Please explain to me how this is acceptable?
Then we have the equally innocent JW, who begins with
He then proceeds to demonstrate that if based on the logic he demonstrates here he’d be hard pressed to distinguish between the function of the odometer and speedometer in his car! In the meantime, he gives us –
Well, clearly he’s just here to learn!
But wait – when people start to point out his errors we get –
Culminating in ‘f you pal’! Seriously. Check it out, ‘Mr. Fixer’!
Scrolling down ‘Graham’ kicks in with ‘addle-brained alarmists’ – demonstrating his pure desire to learn – and proceeds to spam the blog, along the way giving us ‘A pox on your AGW crap and any craven institution tweaking warming knobs to prop it up’ and ‘one poofteenth of a bee’s dick’ just to demonstrate he’s a homophobic jerk on top of everything else!
I could give you many examples of John D’s routine abusive comments, but he’s one of the regular black sheep of the family, rather than one of these boorish out-of-town blowins clearly out to make trouble!
Which brings us to you; on cue, you sweep in with your ‘high-minded’ posturing and nonsensical ‘tone troll’ claptrap.
Who do you think you’re fooling?
If this is the best your bedraggled little tag team can do I suggest I just ‘owned’ it.
In your first post, you started with a classical troll opening. You followed this with a classical denialist assertion, and then you finished with a cherry picked topping.
In this latest post, whilst taking a swipe at climate scientists, you now claim to be a statistical expert, despite the fact that you self admittedly cannot interpret a simple graph. You imply that people are being mean and nasty to you, asserting that this will repel a “Genuine Truthseekerâ€, another classic troll response. Then you allege that two highly regarded climate science sites, places where you can get very patiently explained science, are somehow deficient, easily swayed and full of vested interests. Finally you suggest that through some form of magical alchemy a Genuine Truthseeker will be transformed into a hard core sceptic, yet more classic trollish behaviour.
Tell me, given your new found statistical brilliance and the number of positive indicators of troll behaviour that you have displayed, should we classify you as a troll of limited imagination?
James said:
“I am in fact extremely skilled and experienced in statistical analysis
beyond what most so called climate scientists are.”
You need to back that one up. A good way to demonstrate this would be to see you pointing out the flaws in the claims of some denialists. For example, what, in your statistical opinion do you make of Bob Carter’s ‘”no warming since 1998″ claim?
A post that contains that assertion is worthless. Perchance his 3-word phrase is a high-falutin’ way of saying “cooling”? Pray elaborate, oh great sage James.
clearly
You are just proving my point nicely with your superior attitudes, when unless you are really stupid you know exactly what I mean. But if you must play smart arse and stupid at the same time, I am just using the English language in the way it was meant to be used. On the graph in the article above it can be seen that the annual temperature anomaly in each year since 1998 has been lower than that of 1998. Put simply, the temperature anomalies have declined over recent years. You can play smart and clever as much as you like and again avoid actually addressing the matters raised, but it does not help your cause, even if it gives you an unwarranted sense of superiority.
Heh.
“On the graph in the article above it can be seen that the annual temperature anomaly in each year since 1998 has been lower than that of 1998. Put simply, the temperature anomalies have declined over recent years.”
Good grief, how many times do we have to say that taking a trend from an anomolous high point (or low point, for that matter) is meaningless!
It’s like: I weighed 85kg in April 1989, now I weigh 80 kg, therefore I have lost weight – but, o yeah, I was pregnant in 1989.
Anyway, the NASA temps show that 2005,2007 & 2009 had higher anomolies than 1998, so even that argument is wrong. http://data.giss.nasa.gov/gistemp/tabledata/GLB.Ts+dSST.txt
PS just realized you were referring to NZ temps, I am referring to global temps, but the argument is still the same, you are taking trend from an anomolous year.
James,
Since you are, by your own admission, extremely skilled in statistical analysis, could you tell us the level of statistical significance in these “declining temperature anomalies” after 1998 for the NIWA data?
And since your original reference to these declining temperature anomalies was intended in reference to global trends (“…declining temperature anomaly’s when models predict they should be increasing…” – ie GCMs), could you tell us whether global temperatures have also decreased since 1998, what the trend is, and whether the trend is statistically significant?
Please make sure your reply, as you put it, “addresses the matters raised”.
Tsk, tsk, James – surely, a man of your erudition couldn’t just be another “cooling since 1998” zombie troll?
I was just going to ignore any further comments because in general they didn’t warrant my time and effort. However, as this touches on an issue which is often discussed but poorly understood, it may be worth a brief comment.
Firstly, I will make the statement that ‘Statistical Significance’ does not necessarily mean ‘Scientific Significance’, and vice versa. This is the first area many researchers make mistakes. If you do not understand what I mean by this then you need some basic understanding of both the scientific method and introductory statistics. I don’t have the time or inclination to go over all that.
One of the biggest issues when carrying out any research and statistical measurement is understanding the variables at play. If you don’t understand them, then your statistical analysis could be irrelevant because the measurements may not be in context. In climate, there can easily be a variable or multiple variables, which impact on temperature measurements which is not understood or which is not present almost all of the time over which temperature is being measured. This variable, or these variables could only come into play during the sample period (not the entire record against which the sample is being measured). This would easily lead to statistically significant temperature results over the sample period which are not scientifically significant because of the impact of the particular variable. (Think say solar, orbit, currents. UHI, volcanic etc). So climate scientists would have to have confidence that they understand all the variables at play which can impact on temperature before they could say whether any sample of temperature or temperature anomalies was both statistically and scientifically significant.
The short answer then, to the question of whether the series of temperature anomalies since 1998 is statistically significant (putting aside the issue of scientific significance), is that it may or may not be. If I wanted it to be, I could make it so simply by choosing the period of time I am measuring the series against, and also the hypothesis against which I am measuring the series.
So what period do I take? Since 1998. since 1960, since 1910, since 1850? Since the birth of mankind? Who decides and why?
However even more important is the hypothesis against which I am measuring the statistics. Most automatically assumed that we should judge statistical significance against the null hypothesis (or no change), but is that really appropriate in the context of the Climate Change debate? After all the hypothesis of anthropogenic global warming is that human carbon emissions contribute to the greenhouse effect which leads to increasing global temperature. therefore, temperature anomalies (or raw temperature), should perhaps be more correctly measured against some hypothesised increasing global temperature. In that case, and depending on the period being used in the statistical analysis, 12 years of declining temperature anomalies, or even 12 years of unchanged temperature anomalies could indeed be calculated as statistically significant.
However, proper science does not and never has relied very much on merely statistical significance – scientific significance is critically important. Even if we do not fully understand all the variables at play, if there are past periods which have demonstrated similar anomalies over a similar sample size, and those past periods are not included in the statistical analysis, then you could well end up with a statistically significant result which is not scientifically significant.
James, you said, “…the hypothesis of anthropogenic global warming is that human carbon emissions contribute to the greenhouse effect which leads to increasing global temperature…”.
This is correct. However, global temperatures are not the only data that can be used to test the AGW hypothesis. One reason there is a consensus amongst climate scientists (and many other physical scientists) that AGW is real and a growing threat is that it is supported by a wide range of data – not just local temperature records such as those assembled for NZ by NIWA. These include:
1) Measurements of increasing CO2 in the atmosphere as well as isotopic “fingerprints” that prove the source of the added CO2 is combusted fossil fuels.
2) Satellite data that indicate Earth’s radiative energy budget is currently out of balance by an amount equal to increased absorption of IR radiation by the higher levels of GHG in the atmosphere.
3) Additional satellite data that show the stratosphere is warming and the troposphere is cooling by amounts explained by the this “trapped” IR energy.
4) Sea-level rise as a consequence of thermal expansion of the oceans and melting of ice sheets. AGW hypothesis 4 from 4.
5) Lower ocean pH (acidification) due to dissolution of CO2 resulting from higher atmospheric concentrations.
Will my listing of this evidence make it any more acceptable to you than if you were to read it yourself on realclimate.org or skepticalscience.com where it would be more fully explained with links to the primary peer-reviewed sources? I think we both know the answer.
James, not unexpectedly, you have totally avoided the question.
I asked, very simply, your opinion of Bob Carter’s “no warming since 1998” claim.
As you are doubtless aware Carter and his zombie followers like de Freitas and Leyland use this to say things like “…there has been no global warming since 2002” (Listener April 19 2008).
I say that these claims are fraudulent cherry picking. To speak of climate change and use 5-6 years data is deliberate deception and professional incompetence.
With your statistical wisdom how do *you* interpret such a claim of significance for such limited data?
Note that Carter, de Freitas and Leyland explicitly accept the temperature records.
Phil Jones told Roger Harrabin on BBC (in response to a question with written notice) that there has been no statistically significant warming since 1995. Wouldn’t that mean that there has been none since 1998? or since 2002?
Although 15 years may be short-ish, the difficulty is that the models relied upon for both the 2001 and 2007 IPCC Reports ‘projected’ that temps would increase by 0.20°C over the succeeding decade. They were clearly wrong. So, what happened to the heat (if any)?
Australis, you already know the answers to these questions because you’ve asked them before, and been told the answers.
What Jones actually said was, in effect, the warming trend since 1995 just fails to meet one test of statistical significance (from memory, I think it was about 93%, as opposed to 95%).
The IPCC made no explicit projection for the near term, beyond saying that warming was likely to continue at around 0.2ºC per decade. In fact, the actual global temp curve for the 00’s handily fits inside the multi-model range of projections.
Mike Palin – You assume I haven’t read Realclimate and skepticalscience. I have. There is some good material there, but unfortunately they are tainted sources. You can’t read them and assume you are getting the full story. Unlike this site, which publishes all views, just ‘hides’ comments which receive a high number of thumbs down, they simply refuse to publish many comments which they cannot easily refute or find holes in. They also simply do not address much recent peer reviewed research which does not fit their scientific and/or ideological position. And in anticipation of all those who will ask me to site examples I will say I will not bother simply because if you don’t read wide enough to know this is true, then there is no point. But you seriously have to question a source which so vigorously defended Mann’s disappearing act on the MWP, and think there was nothing of significance in the CRU leaked emails.
Doug Mackie – It may surprise you that I don’t really see my role is to answer any and all questions posed to me, particularly when questions I pose have been specifically ignored. But in fact, in a way I answered your question in that statistically, I could get the data since 1998 to say whatever I wanted it to say. It is interesting that you are accusing Bob Carter of cherry picking a short time period when most warming alarmists ignore his long term data which he also extensively writes about.
What is my opinion of the claim there has been no warming since 1998? I agree that in climate terms such a short period of time should not be used to make any long term assumptions particularly as there could be other variables which are not accounted for correctly at play, as already discussed. But if I was forced to give an opinion on that statement alone I would say that there definitely hasn’t been any statistical warming since 1998 using the normally accepted methods of calculations in this regard. I have read and looked at Hansens claims that 2010 could be the warmest year yet, and believe them to be tenuous at best.
James-
Look, it’s hard to be kind to you even on Christmas Day, but I find your claims of having read much of the material on realclimate,org and skepticalscience.com very difficult to believe. The comments are mostly a waste of time. Instead, use the sites to get to the primary peer-reviewed research literature. Read at least some of it. If you are as smart as you claim, you’ll soon realise how moronic your previous statements sound. If not, well, then you’re just a moron.
James, do you have proof for the claims in your first paragraph?
Carol Cowan – I will assume your enquiry is genuine and make some effort in response. I assume you are referring to evidence about the two site’s approach to selective editing and distortions.
I have personal experience at both sites mentioned, where posts have either been excluded, or where vital contents of the post have been edited. The purpose of my response here is to simply demonstrate to those interested that you should be sceptical about anything you read (from so called alarmist or sceptic/denier sites).
For brevity I will deal just with RealClimate, but my experience has been the same at Skeptical Science. I am not an important player, so I have provided links to detailed examples of editing and distortion later in this post for your information. These involve higher profile individuals.
First here are a couple of examples of two key RealClimate contributors and co-founders and their disregard for balance and objectivity and editing of comments.
Michael Mann – one of the RealClimate co-founders – leaked email
Update: East Anglia Confirmed Emails from the Climate Research Unit – 1139521913.txt
“I wanted you guys to know that you’re free to use RC in any way you think would be helpful. Gavin [Schmidt] and I are going to be careful about what comments we screen through, …We can hold comments up in the queue and contact you about whether or not you think they should be screened through or not, and if so, any comments you’d like us to include.
Think of RC as a resource that is at your disposal… We’ll use our best discretion to make sure the skeptics don’t get to use the RC comments as a megaphone.”
– Michael E. Mann, IPCC Lead Author (2001)
William M Connolley – RealClimate co-founder banned from Wikipedia
In August 2010 Connolley was banned for a minimum of 6 months from Climate related editing at Wikipedia. Here is a short summary of his Wikipedia career where he used his editing and fact distortion skills honed at RealClimate to impressive effect.
“Connolley took control of all things climate in the most used information source the world has ever known – Wikipedia. Starting in February 2003, just when opposition to the claims of the band members were beginning to gel, Connolley set to work on the Wikipedia site. He rewrote Wikipedia’s articles on global warming, on the greenhouse effect, on the instrumental temperature record, on the urban heat island, on climate models, on global cooling. On Feb. 14, he began to erase the Little Ice Age; on Aug.11, the Medieval Warm Period. In October, he turned his attention to the hockey stick graph. He rewrote articles on the politics of global warming and on the scientists who were skeptical of the band. Richard Lindzen and Fred Singer, two of the world’s most distinguished climate scientists, were among his early targets, followed by others that the band especially hated, such as Willie Soon and Sallie Baliunas of the Harvard-Smithsonian Center for Astrophysics, authorities on the Medieval Warm Period.
All told, Connolley created or rewrote 5,428 unique Wikipedia articles. His control over Wikipedia was greater still, however, through the role he obtained at Wikipedia as a website administrator, which allowed him to act with virtual impunity. When Connolley didn’t like the subject of a certain article, he removed it — more than 500 articles of various descriptions disappeared at his hand. When he disapproved of the arguments that others were making, he often had them barred — over 2,000 Wikipedia contributors who ran afoul of him found themselves blocked from making further contributions. Acolytes whose writing conformed to Connolley’s global warming views, in contrast, were rewarded with Wikipedia’s blessings. In these ways, Connolley turned Wikipedia into the missionary wing of the global warming movement.â€
Those interested may wish to read a detailed story of how Connolley wielded his power at Wikipedia in this frightening account: National Review: Wikipedia Is A Stunning Example Of How The Propaganda Machine Works read at: http://www.cbsnews.com/stories/2008/07/08/opinion/main4241293.shtml
Here is more specific evidence of the editorial control at RealClimate which I referred to in my previous post.
Classic Example of RealClimate editing and distortion by Mann.
http://cstpr.colorado.edu/prometheus/archives/climate_change/001180a_little_testy_at_re.html
Examples – this time by Schmidt
http://climateaudit.org/2005/10/29/is-gavin-schmidt-honest/ and http://climateaudit.org/2005/10/02/389/ and http://newsbusters.org/blogs/noel-sheppard/2008/07/17/nasa-climate-alarmist-attacks-newsbusters-sheppard
Another more general editing example which shields readers from the facts
http://www.nationalcenter.org/Z031507=realclimate_climate_censorship.html
If you aren’t already bored reading criticisms about RealClimate, there is extensive coverage here which again points to specific examples and criticisms including by well credentialed climate scientists: http://www.climatedepot.com/a/1742/Climatologist-slams-RealClimateorg-for-erroneously-communicating-the-reality-of-the-how-climate-system-is-actually-behaving–Rebuts-Myths-On-Sea-Level-Oceans-and-Arctic-Ice
Few will bother to read this far if indeed this post gets published, but many with closed minds will simply use this as ‘evidence’ that I am just another ‘denialist troll’.
Relying on Lawrence Solomon for analysis of William (Stoat) Connolley’s efforts at Wikipedia tells me a very great deal about your respect for the integrity of your sources. Similarly, quoting ClimateAudit on RealClimate hardly represents unbiased analysis. And relying on Morano’s Climate Depot? A fossil-fuel funded propaganda effort.
Pure wibble.
Gareth, We are not talking science in this instance – therefore your comment about “analysis” (unbiased or otherwise), is irrelevant. Carol asked for proof of editing and distortions. If you think the claims made of editing and misrepresentation I have cited are false, have the balls to make your specific accusation, and you can post it here and on the sites you refer to. Then you may have the opportunity to back up your accusations in court.
The claims you are happy to repeat are either false or misrepresented, or both. For Solomon, read Frank D’s comment below.
James-
You appear to have an impressive familiarity with the contrarian blogosphere. Have you made any similar attempt with the primary peer-reviewed scientific literature on climate science?
By the way, any progress with footnote 15 at the bottom of page 163 of the NIWA report? Of course, because you’ve read the report and are “extremely skilled and experienced in statistical analysis beyond what most so called climate scientists are” you will be able to tell us all about it, won’t you? Come on, show us your best stuff.
Mike – at least your responses are civil. Most contributors at this site won’t care a jot what I write, but for your information, I read widely. I have a successful private practice but also do some work at a couple of tertiary institutions in a totally unrelated field to climate science. I have been very interested in the environment and climate for many, many years. I have invested in reforestation, rehabilitation of rural land and made significant (for me) investments in solar and wind technology dating back to 1996. I am a past member of Greenpeace, make regular donations to various rainforest rescue, and wildlife rescue projects and I was a major contributor to the campaign of a Greens politician (unsuccessful) at the last election. Until IPCC AR4 I was a true believer. I was at the Australian premiere of “An Inconvenient Truth”. Then some of the Earth Science and Physical Science professors at one of the Universities I am involved in, started showing me some peer reviewed research with refuted some of the claims made by the IPCC and some climate alarmists. They also showed me that there was a fair gap between the IPCC summary for policy makers and the detailed report contents. It has opened my mind to the sceptical position. Of course I know there are some sceptics with a vested interest just as there are ‘alarmists’. I am currently travelling so can’t continue the story at great length. I have no problem with a special tax to encourage clean energy technology, improved land use, reduced pollution and environmental rehabilitation. I believe the justification for a tax on CO2 emissions has a lot of holes. I believe an emissions trading scheme is economically flawed and philosophically flawed. Perhaps that will stop some of the really stupid comments and assumptions others have made on this site. But I don’t really care that much as I have decided this site has nothing of value to offer any side of the debate, it simply appears to be a cheers squad for the alarmist side of the debate. That achieves nothing except perhaps a warm fuzzy feeling for the unquestioning ‘true believers’ at this site.
James-
That is an interesting background story you’ve constructed, but I’ll need some proof of your previous statements that you read the NIWA report and are “extremely skilled and experienced in statistical analysis” before I believe any of it. Please explain footnote 15 on page 163 or keep your fantasies to yourself.
“Then some of the Earth Science and Physical Science professors at one of the Universities I am involved in, started showing me some peer reviewed research with refuted some of the claims made by the IPCC and some climate alarmists”
And you’d have some links to these, or some other evidence that they actually exist? outside of your imagination, I mean…
Note that in Solomon’s “wibble” (LOL) about Connolley, he doesn’t actually say why he was “banned from Wikipedia”. He just insinuates that it was for … what, I don’t know, being biased, or something. To save you the trouble of wading through the ArbCom hearing, evidence, decision, appeals etc, the story went like this…
Firstly, Connelley wasn’t banned from Wikipedia, he was barred from editing articles on Climate Change. The very admins who topic-banned him have been encouraging him to improve mathmatics / statistics articles where his expertise is well-regarded. And why was he barred from climate change articles? For being biased? No. For “edit warring” and generally being rude to people who, frankly, deserved it.
It worked like this: Trolls would post a new article on the denialist meme-de-jour. Connolley would correct the worst failings of the article. meat puppets revert the edits, Connolley reinstates them, repeat cycle until troll whines to the administrators that Connelly is abusing his powers. In maintaining the quality of several thousand articles in the face of concerted campaigns by trolls, meat-puppets and sock-puppets, Connelley would occasionally get frustrated and pay out on the f**kwits he was dealing with, and then get tone-trolled about being rude.
It’s worth noting that over a dozen denialist trolls got topic-banned in the same exercise, which was aimed only at stopping the constant warring on this topic.
The most laughable comment in James’ pathetic bait-and-switch is his quote: “over 2,000 Wikipedia contributors who ran afoul of him found themselves blocked”. Stoat devoted a lot of effort to finding and removing sock-puppet accounts. Nearly all of these >2000 accounts were set up be people whose original account had been blocked for vandalism or other abuses. Solomon seems to think that there is something wrong with Connolley blocking idiot vandals and spammers from ruining Wikipedia articles (on a wide variety of topics).
Connolley’s efforts are a lesson in everything that is/was right about Wikipedia, and his banning is a lesson in everything that is/was wrong. In particular the “even-handed” decision to block everyone who was edit-warring, was a cop out by the arbitrators, reminiscent of the “false balance” we see in a lot of media coverage. I say that as a former editor who left because I got tired of seing my useful content (some climate, but never climate change) FUBAR’ed by some well-meaning but ignorant editors. In Connolley’s case, there was nothing well-meaning about it.
James, a tip for you – if you don’t want to be labelled a denialist troll, don’t do things that denialist trolls do. Maybe you could get back on topic and share your statistical expertise on the question of New Zealand temperature trends, instead of continuing this Gish Gallop. We’ve all seen it too many times before.
FrankD – I can’t believe you wrote this with a straight face. “Banned’ vs ‘Barred’ for 6 months. Gee what’s the difference?
If you read the detail of the evidence considered in the Wikipedia decision process, the ‘barring’ of editing Climate Topics )for at least 6 months – to be reviewed at the end of that period), was for far more than being rude to a few people. Connolley placed his opinion above many well respected climate scientists. He also amended content to satisfy the views of his mates at RealClimate as evidenced by continuing to support Mann’s clearly discredited work.
I am sure Connolley appreciates your unwavering and unquestioning support, but it is not well placed, no matter how noble Connolley believes his motivations are.
” Gee what’s the difference?”
Try to pay attention, James – the difference is that he was topic-banned (which he was) not Wikipedia-banned (which you claimed). Just another example of you playing loose with the truth.
Read the Wikipedia Arbitration decision – he was banned for “being uncivil and antagonistic” and for “making edits to biographies of living persons that may not have been neutral”.
So, evidence for your laughable claims? (and I did laugh)
Any response to the dozen or so questions from Doug, or Mike, or Carol or RW or Rob or anyone for which we are all waiting breathlessly?
Or is it time to gallop some more?
Giddy-up, dobbin…
FrankD – Read what I wrote – “Connolley was banned for a minimum of 6 months from Climate related editing at Wikipedia.” Sounds pretty muc the same as “topic banned” as you say. So it looks more like you are the one playing loose with the truth hoping others won’t actually read what I wrote.
Thank you for replying to my question, James.
Shorter James: I’ll claim I’m a top gun statistician, but I either can’t or won’t answer straightforward questions about statistical significance. Instead, I’ll post a wall of evasive twaddle, featuring exactly the same “superciliousness, dodging and weaving” that I whined about earlier.
The answer, for people playing at home, is that no statistically significant trend can be drawn from such a small data set. Taking more data from more stations (ie global) for more years (ie more than 15) shows a warming trend with a high statistical significance.
James insinuates that models predict uniformly rising temperatures for these seven stations. They don’t.
James tone trolls about “geniune questions” and then shows his questions weren’t genuine. Instead of answering, he lays down a hand drawn from the Denialist Deck of Cards that Lodger reminds us of – 8♣, 8â™ , 9â™ ,10♣,J♣.
Oooh, a busted straight! So close. But thanks for playing…
Again, for the home viewer, the question of “no warming since …” is addressed here: http://web.archive.org/web/20080308164113/tamino.wordpress.com/2008/01/31/you-bet/
Tamino gives the full treatment for “no warming since 2007”, but using the same methodology for “no warming since 1998”, the “no warming” side will definitively lose the bet in about 7 days, when the 2010 anomaly comes in above +0.60 degrees C, despite the biggest La Nina in 20 years. That’s more than 2 standard deviations above the “no warming” line for the second time since 1998.
It’s very hard to feel charitable to these denialists, even today. This weekend’s Dom. Post features a highlighted letter to the editor – the one that sports a photograph – from none other than the late unlamented troll Joe Fone. It’s a brew of cherry-picking irrelevancies that clearly shows he has no interest whatever in scientific truth. It is disturbing to think that many members of the public could be influenced by such offensive tosh.
“However, proper science does not and never has relied very much on merely statistical significance – scientific significance is critically important.”
I’m willing to accept that James is genuine and knows a bit about statistics. A critical component of your analysis should include the obervational data such as the acclerating rate at which glaciers are melting globally. An obvious starting hypothesis is that this is attributable to rising temperatures. However, we are all open to suggestion regarding alternative explanations which I suspect are probably all testable.
Hi Tony. This is an example of “Trollcraft” (see para. “5.3: Stealth by eclecticism”)
The last thing a missionary troll wants is for his prospective mark to find existing refutations of his position. To conceal his dogma, the troll poses as an eclectic opener of debate, saying all he seeks is to “open mindsâ€. Stealth eclecticism also has the advantage of giving the troll a wider selection of crackpottery to plagiarize.
The made-up term ‘Scientific Significance’ is substituted above for Research Design. Scientists discuss these issues using terms with precise meanings like Reliability and Validity, rather than the obfuscating babble above.
Expect the next round of comments to attack the Science on thinly disguised 9♠ “Nit Pick” issues. These are routinely resolved during Peer Review, and debunked on sites like Skeptical Science.
So sit back, and enjoy! I predict we will see a new high score on the “Climate Denier Crackpot Index“. Feel free to call your scores as you see them!
Thanks Artie.
I have to admit, that James is starting to remind me of my early varsity years when I was looking for work in summer holidays. I came across some Encylopedia salesmen who early on seemed so sincere and promising. Then I discovered just how difficult it was to make a commission and it further became clear that they were just trying to rip us off. The university then served a notice round to avoid these dodgy characters.
James-
Any progress with footnote 15 at the bottom of page 163 of the NIWA report? Remember, you claim to have read the report and be “extremely skilled and experienced in statistical analysis†so you should be able to tell us all about it – if you’re being truthful.
James-
We’re still waiting for your explanation of footnote 15 at the bottom of page 163 of the NIWA report. You seem to be taking an awfully long time in light of your claims to have read the report and be “extremely skilled and experienced in statistical analysisâ€. You did make those claims, didn’t you?
Mike I am travelling with unreliable internet access. I am also pretty unimpressed by most contributors on this site. I haven’t relooked at the report or the footnote since the original read so not sure what it refers to. My internet time is up. May catch you later.
“I am also pretty unimpressed by most contributors on this site.”
fair enough. it is very unhospitable of people to ask that you back up your claims of statistical expertise with some evidence that you know anything at all. but of course just when you were about to impress us all, sadly, your time is up. we’ll be counting the minutes till you return!!
OK. I have some internet time again. I am travelling, whether you believe it or not, and in areas with limited and slow internet access.
Firstly, some of you think it is significant that I haven’t immediately responded to your taunts and challenges. Those people should know that some of us actually have lives and don’t live for this site. After all, we are in the middle of a major holiday season often spent with family and friends, (for those with lives).
Secondly, for those who are gloating about me not responding to your specific question or challenge. If you are so clever you may have noticed that the two questions I originally posed in my first post were diligently avoided by everyone one of you clever lemmings. If you set certain standards of others, you should first meet them yourselves.
Thirdly, when I did provide a detailed referenced response to someone who asked for proof of what I had said, apart from a thank you for the response from Carol, the rest of the responses were simply insults or taunts which did not address the content of my response.
Clearly if I say anything which disputes the quasi religious beliefs of most contributors to this site, I simply get labelled a troll or denialist. If I provide referenced information, that simply gets labelled a denialist source. The content, doesn’t even get addressed.
If there are any readers of this site who don’t know that there are well respected scientists who do not support the assertions being made by the IPCC summary for policy makers, Al Gore, Michael Mann, Hansen, and so on – then you need to get out more. I have read peer reviewed published research at the rate of two or three papers a week (admittedly many just skimmed), which would be classed as ‘sceptical’ or ‘contrarian’ this year.
Even the temperature records on which much of the ‘climate change’ assumptions are based have been rightly questioned – not just in New Zealand but around the world. Why do you think it is going to take the UK Met at least three years to check the temperature records used by the CRU and provided to support the IPCC reports and models? If the records had been properly maintained and adjustments and homogenisations properly recorded, there would be no need for the three year plus project. (Please don’t some dumb ass ask for a reference for this. If you don’t know about it, you don’t know anything!).
I do not have the time or the inclination to respond to any of the other individual challenges, when none of the ‘oh so clever’ people at this site could address the original questions I raised.
There have been any number of slurs and accusations and uninformed assumptions made against me at this site. Even to the point of denying I could possibly have the background I have stated here. I am then challenged to prove who I say I am. Well I am hardley going to expose my email address and credentials to some of the uninformed, vigilanty nutters who patrol this site. As it is, I don’t use a clever internet ‘handle’ to hide my identity, so some people in academia, would probably be able to work out who I am, but I doubt that would include any of the moronic respondants who have populated this site. (Apologies to the handful of reasonable people here).
I will continue to seek knowledge and balance on this subject, but that is clearly not available at this site.
If anyone makes a post in response to this, who wants to attack me or my character or motivations, perhaps they could firstly attempt a well reasoned and referenced response to the original questions I raised?
James-
You have obviously forgotten our initial exchange. My first response to your three questions of Dec 24 was for you to read the NIWA report. You replied, “Thanks for your bleeding obvious suggestion. I did. those three points are not tackled, ergo my questions.”
I then apologised and pointed out that the raw data you asked about in your first question was in fact available in the appendices. Links to Excel files of these data were subsequently made available thanks to Area Man. You can easily replot them against any time period. Have you done so?
You have since claimed many things: an expertise in statistics, a backstory as a one-time AGW “true believer”, and now to have “read peer reviewed published research at the rate of two or three papers a week (admittedly many just skimmed), which would be classed as ‘sceptical’ or ‘contrarian’ this year.” Well, dude, this latest claim is just freaking impossible – you would quickly run out of weeks. I hesitate to ask the obvious question because I’m sure there is some deficiency in the internet connection you’re using that prevents you being able to give references to any such papers.
By all means seek knowledge on climate science, but don’t be disappointed when you fail to find “balance” in the arguments and evidence. That’s not the way science works.
I have questioned the truthfulness of your claims to have read the NIWA report and that you are “extremely skilled and experienced in statistical analysisâ€. I have provided a simply way for you to prove me wrong. Enough with the obfuscation – explain footnote 15 on page 163.
Mike – Sorry I didn’t understand your reference was actually answering my question. My question was more generic than asking whether the raw data was in fact available. I can’t go to the data at the moment in any event, but at this stage I am sceptical whether I would be looking at the ‘raw data’ or the ‘adjusted, homogenised data’. As you know, most of the data we can access now is the latter. But that’s a whole other issue. Still no answer re NIWA’s defence lodged with the court, which is way more important. However I know you may not be able to answer on behalf of NIWA, but didn’t it make you wonder why they didn’t just defend the accuracy of the data? Or why they haven’t lodged their latest report as their defence?
I apologise in advance but I am continuously being asked to prove there are peer reviewed sceptical research papers and other articles. As if anyone sceptical is just part of some loony fringe.
I haven’t kept them all and I don’t have the time to re-search for them. My estimate of the quantum may be plus or minus, but I have kept some articles which were of interest to me in a word document with just summaries of contents and URL’s to the original source.
These do not of course represent all the sceptical peer reviewed research papers or non-peer reviewed articles., but here are some which I found of interest during my December reading. I have of course extracted the non-sceptical articles I also read as you will be familiar with them.
Please note – I am NOT supporting all these articles, just producing them as examples (as you and others question their existence), so don’t ask me to justify the contents. Sorry for the presentation, but I don’t think the copy and paste transfers bolding or hyperlinks. Here they are:
African Floods Are Not Being Caused By Human CO2 Emissions, Latest Peer-Reviewed Study Reports
Di Baldassarre, G., A. Montanari, H. Lins, D. Koutsoyiannis, L. Brandimarte, and G. Blöschl (2010), Flood fatalities in Africa: From diagnosis to mitigation, Geophys. Res. Lett., 37, L22402, doi: 10.1029/2010GL045467.
Based on the results of both continental and atâ€site analyses, we find that the magnitude of African floods has not significantly increased during the Twentieth Century (Figures 2 and 3), and that climate has not been a consequential factor in the observed increase in flood damage. This is consistent with the results previously obtained [Kundzewicz et al., 2005; Bates et al., 2008; Petrow and Merz, 2009; Lins and Slack, 1999; Mudelsee et al., 2003] in different areas, such as North America, Europe, and Australia.
James Hansen’s Outlandish “Alpine Plant Extinction Claim” Is Debunked by Real-World Data
Scherrer and Korner say their findings are “important in the context of climate change,” because they show that “species do not necessarily need to climb several hundred meters in elevation to escape the warmth.” Quite often, in fact, they say that a “few meters of horizontal shift will do,” so that for plants “unable or too slow to adapt to a warmer climate, thermal microhabitat mosaics offer both refuge habitats as well as stepping stones as atmospheric temperatures rise.”
In discussing their results more broadly, the Swiss scientists state that their data “challenge the stereotype of particularly sensitive and vulnerable alpine biota with respect to climatic warming,” noting that “high elevation terrain may in fact be more suitable to protect biodiversity under changing climatic conditions than most other, lower elevation types of landscapes.” Thus, in what would appear to be a bit of good advice to all — and James Hansen in particular — the two researchers say they “advocate a more cautious treatment of this matter.”
http://www.co2science.org/articles/V13/N49/B1.php
NASA Peer-Reviewed Study Finds Low Sensitivity To CO2 Doubling: The UN’s IPCC Global Warming Science Is Imploding
Read here and here. The infamous, never-before-seen, IPCC climate model prediction of scary, positive AGW-feedback has now been vanquished by scientific empirical research. NASA’s researchers have just pushed the button of detonation, which will likely hasten the collapse of the IPCC’s version of “climate science” upon itself.
Simply stated, the IPCC’s Climategate scientists and computer models conjured up the scary prediction of a 3 to 5 degree Celsius temperature increase from a doubling of CO2, along with requisite, speculative, calamitous events of biblical destruction proportions. But now the latest research finds that CO2 doubling causes an increase of only 1.64 degrees, which is within the range of outcomes that skeptical scientists have been saying for decades.
Per physicist Luboš Motl, the NASA researchers, Bounoua et al., concluded the following:
“The article in Geophysical Research Letters combines their climate model with the feedbacks linked to vegetation, especially evapotranspiration – the sum of plant transpiration and evaporation from leaves…What is their result?…The resulting climate sensitivity attributed to the CO2 doubling from 390 ppm today to 780 ppm expected in 200 years from now (under business-as-usual) is just 1.64 °C – less than a Celsius degree per century or so. This figure is below 2 °C, the low end of the interval guessed by the IPCC.” [Note: study’s authors – L. Bounoua, F. G. Hall, P. J. Sellers, A. Kumar, C. J. Tucker, M. L. Imhoff (2010)]
http://www.c3headlines.com/2010/12/nasa-peer-reviewed-study-finds-low-sensitivity-to-co2-doubling-the-uns-ipcc-global-warming-science-i.html
Peer-Reviewed Study By Amateurs Trumps Bogus Antarctic Temperature Study By The “Experts”
Read here and here. A group of interested individuals (amateur climate enthusiasts) took serious issue with the mathematical/statistical techniques used by climate-scientists to reconstruct Antarctic temperatures in a 2009 peer-reviewed study. As it turns out, this group of amateurs were better versed in proper mathematical/statistical analysis than the experts, and they brought that specific expertise to bear on the 2009 temperature reconstruction study. Objectively, even AGW alarmists are praising their work!
The result of this new peer-reviewed study? The Antarctic climate is not this monolithic warming environment that the IPCC Climategate “experts” attempted to portray to the politicians and taxpayers in the 2009 study. Instead, like all other large regions of the globe, Antarctica exhibits areas of warming, cooling and temperature stability. [Ryan O’Donnell, Nicholas Lewis, Steve McIntyre, Jeff Condon (2010)]
Based on this new analysis (O’Donnell et al.), modern temperature trends are no threat to the continent-sized ice sheets.
http://www.c3headlines.com/2010/12/peer-reveiwed-analysis-by-amateurs-corrects-bogus-antarctic-temperature-study-by-the-experts.html
Russian Mega Heat Waves & Mega Forest Fires Documented To Be Of Frequent Occurence
Read here. The 2010 summer Russian heat wave and resulting forest fires have been claimed to be the result of global warming and climate change. Unfortunately for the AGW alarmists and activist scientists, NASA found these claims to be of little merit.
More importantly, modern heat waves and forest fires in Russia are not unprecedented. These severe weather events happen with some frequency, including the documented severe events of these years (link above for more info):
1298, 1364, 1431, 1735, 1831, 1839-1841, 1868, 1875, 1885 and 1917
http://www.c3headlines.com/2010/12/russian-mega-heat-waves-mega-forest-fires-documented-to-be-of-frequent-occurence.html
Geologic Record Shows No Relationship Between Temperature And CO2
http://ff.org/centers/csspp/library/co2weekly/2005-08-18/dioxide_files/image002.gif
From 150 million years ago to 65 million years ago, CO2 levels decreased by 1000 ppm. During that same period, temperatures rose by 7 degrees Centigrade.
Why does this scam continue?
https://stevengoddard.wordpress.com/2010/12/13/geologic-record-shows-no-relationship-between-temperature-and-co2/
Real Estate Prices In Tuvalu and Maldives Unaffected By Impending Armageddon
The prime minister of Tuvalu, Apisai Ielemia, said rich Westerners were allowing his nation to perish. He showed a group of journalists, me among them, a video of floods that threaten to wash his tiny Pacific island nation to the sea…
‘Mr Prime Minister. In view of the impending deluge, how much have land prices fallen on Tuvalu?‘ I stammered.
For some reason my question completely silenced the room packed with environmental press. After what I will charitably call an inquisitive stare, the prime minister gave his longwinded answer full of long-term projections of rising ocean levels. To be fair, he concluded with a simple declaration: ‘Land prices have not been affected.’
http://blogs.news.com.au/heraldsun/andrewbolt/index.php/heraldsun/comments/if_their_islands_are_drowning_why_is_the_real_estate_so_dear/
Hottest year ever? ‘Does this have anything to do with Hansen’s constant claims of 2010 as the hottest year ever? That is simply ridiculous. GISS is not credible’
GISS shows temperatures rising sharply since July. We have been having a record cold La Niña since then, and everyone else shows temperatures plummeting.
GISS also showed a huge spike in March which nobody else saw. Does this have anything to do with Hansen’s constant claims of 2010 as the hottest year ever? He shows peak La Niña temperatures almost as warm as peak El Niño temperatures. That is simply ridiculous.
http://stevengoddard.wordpress.com/2010/12/11/giss-temperatures-out-of-line-with-the-rest-of-the-world/
Ocean Acidification slapped down: ‘The oceans are alkaline, not acid.
The oceans are alkaline, not acid. The 30% number is something they pulled out of their posteriors. Corals and shellfish evolved when atmospheric CO2 levels were 10-20X higher than today. It is beyond ludicrous to claim that CO2 is reducing their ability to form shells. The chemical properties of Aragonite have not changed.
http://www.climatedepot.com/a/9027/Ocean-Acidification-Slapped-Down-The-oceans-are-alkaline-not-acid-The-30-number-is-something-they-pulled-out-of-their-posteriors
New peer reviewed paper shows just how bad the climate models really are
One of the biggest, if not the biggest issues of climate science skepticism is the criticism of over-reliance on computer model projections to suggest future outcomes. In this paper, climate models were hind cast tested against actual surface observations, and found to be seriously lacking.
Examining the local performance of the models at 55 points, we found that local projections do not correlate well with observed measurements. Furthermore, we found that the correlation at a large spatial scale, i.e. the contiguous USA, is worse than at the local scale.
http://wattsupwiththat.com/2010/12/05/new-peer-reviewed-paper-shows-just-how-bad-the-climate-models-are/
New Discoveries
What new things have science discovered since 2001, since the knowledge base that was used to concoct that last IPCC report (AR4)? As it turns out, quite a number of surprising discoveries have been made. Here are a few which offer scientific alternatives to the IPCC’s unproven theory of Anthropogenic Global Warming (AGW) due largely to CO2 emissions:
• Ocean Circulation. In the past, oceanographers have viewed the great global currents that circulate heat energy around the globe as a fairly orderly system. New research began to question this conventional view starting a few years back with a report detailed in “Conveyor Belt Model Broken.†This was followed by “Ocean Conveyor Belt Confounds Climate Science†and “Ocean Conveyor Belt Dismissed.†It now looks like all those general circulation models (GCM) do not reflect physical reality.
• Aerosols & GHGs. While the IPCC stressed the supposed importance of CO2 real scientists were making important discoveries. In “Arctic Aerosols Indicate Melting Ice Not Caused By CO2†and “Warming Caused by Soot, Not CO2†the importance of tiny dust particles, called aerosols, was revealed. This was driven home to everyone who attended the Beijing Olympics, as outlined in “Fire & Ice: Black Carbon vs Sulfate.†Some of the blame for climate change was also shifted to oxides of nitrogen, as described in “Laughing Gas Knocks Out CO2,†only to have human blame dismissed when it was found that “Agriculture Reduces Greenhouse Gases.†Of course, even the authors of the 2001 review article knew the truth, “It’s The Water Vapor, Stupid!â€
• Tracking Heat. There seems to be a lot of confusion regarding ocean temperatures these days. Scientists are having a hard time balancing the heat budget as outlined in “Missing Heat Hides From Climate Scientists.†Of course, that could be because there was an “Atmospheric Solar Heat Amplifier Discovered.â€
• Chasing Carbon. Many predictions had been made that Earth’s environment would lose its capacity to absorb carbon, leading to accelerated CO2 build up. But the ocean was found to not be loosing its capacity to absorb, as told in “Ocean Absorption Of CO2 Not Shrinking.†In fact, microbes were found to be better at absorbing carbon than previously thought in “Ocean CO2 Storage Revised†and a new absorption mechanism was found in “New “Jelly Pump” Rewrites Carbon Cycle.†Back on land, fungi were found to be doing their part to balance the ecosystem in “Soil Fungus Soaks Up CO2†while Earth’s forests seem to be flourishing in “Forests Flourish On Human CO2.â€
• The Lazy Old Sun. Science continually questions that which it thinks it knows, so it is still news when “Scientists Discover The Sun Does Affect Earth’s Climate.†It was also confirmed that the “Sun & Cycles Heat Up Ice Age Interglacials†and that “The Sun, Not CO2, Caused Ice Age Glaciers To Melt.â€
That is only a partial list of some research highlights since I started reading on the subject: and people wonder why I am an AGW sceptic!
U.S. Decade-Plus Long Cooling Trend Sinks Further, To a Minus 9.1 Degree Per Century Rate
Source here. This chart represents the 12-year period starting December 1, 1998 and ending November 30, 2010. The most recent 12-month period ending November 2010 was the 3rd coldest November-ending period since 1999. At some point warming will resume, but the current decade-long plus global cooling trend continues. None of the IPCC climate models, nor “consensus” experts, predicted this level and extent of cooling for the continental U.S. This trend has persisted since the super 1997-98 El Niño event.
With the continental U.S. having the most extensive thermometer network in the world, this suggests that possibly other areas of the world would be reporting a cooling trend if they also had the extent and quality of actual temperature measuring coverage that exists in the U.S.
The AGW hypothesis calls for global warming, which is obviously not happening in the U.S. – the case for AGW is significantly weakened by this type of empirical evidence. As a reminder, the climate models predicted “global” warming, not partial-global warming, as seems to be the present situation.
http://www.c3headlines.com/2010/12/us-decade-plus-long-cooling-trend-sinks-further-to-a-minus-91-degree-per-century-rate.html
GREEN HYSTERIA MEANS WE FACE A BLEAK FUTURE
AS we shiver in the coldest start to winter in living memory, you may wonder whatever happened to global warming. Good news! Doomsday is indefinitely postponed. Three years ago, the UN inter-governmental Panel on Climate Change (IPCC) made blood-curdling fore- casts of melting ice caps causing sea levels to rise 13ft by 2100. Such low-lying countries as The Maldives and Bangladesh would be submerged. London and New York would be swamped.
Last week, the Met Office downgraded the prediction to a “worst case†threat of only 6ft. in a masterpiece of understatement, even this is said to be “unlikely†and a more plausible figure is eight inches. Only five weeks ago the Met Office predicted a “milder than average winterâ€. Yet we have had the coldest start to winter on record!
Will this chink of doubt silence the prophets of doom? No. There’s too much money at stake for that. Man-made global warming is a new religion whose high priests and acolytes’ well-paid jobs depend on propagating their vision of hell- fire and destruction.
Read more: http://www.express.co.uk/posts/view/217018/Green-hysteria-means-we-face-a-bleak-futureGreen-hysteria-means-we-face-a-bleak-future#ixzz18FlVlAIT
Hurricane/Cyclone Predictions from IPCC Climate Models Fail Spectacularly – Models Are Worthless
Read here. The images (below) from this article really say it all. Almost all the severe weather predictions produced by climate models that are based on human CO2-induced warming have miserable prediction records. This is especially true for global hurricane and cyclone activity, which the models in the past predicted greater frequency and intensity of hurricanes/cyclones. (click on images to enlarge)
Policymakers should reduce, immensely, the funding for the climate model quacks and any hurricane “expert” who got sucked in to the eye of the model fiasco. Funding should be made available to those researchers focused on why such variability in severe weather occurs, sans the human CO2-causes-everything-science of IPCC Climategate “scientists.”
“New Little Ice Age Cannot Be Ruled Out” by Rickmer Flor
Everybody is talking about global warming – but in Germany and also in many other countries around the world people are currently fighting with the adversities of extreme cold. And indeed: “The year 2010 will be the coldest for ten years in Germany,” said Thomas Globig from the weather service Meteo Media talking to wetter.info . And it might even get worse: “It is quite possible that we are at the beginning of a Little Ice Age,” the meteorologist said. Even the Arctic ice could spread further to the south.
It is already clear: the average temperatures in Germany this year (8.1 degrees Celsius) were 0.2 degrees below the long term measured average of 8.3 degrees. “I fear we will end up still significantly lower by the end of the year”, said Globig. The long-term average is actually the average of all German stations from 1961 to 1990.
Coldest December in 100 years: In Berlin, there was an absolute cold record in early December, “For 100 years it had not been as cold as in the first decade of December,” said Globig. This also applied to other regions. But why is it so cold just now? Might it have anything to do with climate change? “I’m very sceptical”, replied Globig. A few years ago when we had a period of mild winters many climate scientists warned that winter sport in Germany’s low mountain ranges would soon no longer be possible anymore because of global warming. “Now they are saying: the cold winters is a consequence of global warming – a questionable implication,” according to Globig. http://climaterealists.com/index.php?id=6859
NOAA & NCDC Pursue Goal of ‘Warmest Year Ever’ For 2010 – Release Newly Fabricated Global Temperatures
Within the last few days, NCDC released a revised global temperature data set stretching all the way back to 1880. The chart below shows the monthly changes NCDC made to temperature anomalies based on the previous data set, which was the global temperature anomaly record through October 2010. (click on images to enlarge)
New NCDC data, source here. Previous (October 2010) NCDC global temp anomaly data here. The chart depicts the monthly difference between these two NCDC data sets.
Amazingly, they found mucho, newly discovered degrees of global warming during the late 19th century. (How did they miss all this “warming” during their last fabrication revision of global temperatures way back in 2009?)
What the chart above also clearly indicates are major changes (cooling adjustments) to the global temperature record starting around 1938. The cooling adjustments continue up through 1965. After 1965, the majority of the adjustments made to the old 2009 temperature record are of “global warming” nature.
The chart below shows the cumulative adjustments for the two periods: 1938-1965 and 1966-2010. Based on this simple analysis, it is clear why NOAA/NCDC continues to fabricate revise global temperature records – they need to “cool” down the 1930 and 1940’s and “heat” up modern temperatures to lend credence to the very wobbly AGW hypothesis.
Warmists predict the snow they once didn’t, now it’s up to their ears
The Potsdam Institute for Climate Impact Research says a new paper concludes that the snow now burying Europe and North America is just what global warming theory predicted: The overall warming of the earth’s northern half could result in cold winters… Recent severe winters like last year’s or the one of 2005-06 do not conflict with the global warming picture, but rather supplement it. But is that the sound of goalposts being shifted? The Intergovernmental Panel on Climate Change was once adamant that Europe was predicted to have not colder winters but warmer (see page 862 table 11.2): Fewer cold outbreaks; fewer, shorter, intense cold spells / cold extremes in winter†as being consistent across all model projections for Europe
http://blogs.news.com.au/heraldsun/andrewbolt/index.php/heraldsun/comments/warmists_predict_the_snow_they_once_didnt_now_its_up_to_their_ears#78014
AGW Alarmists Predicted More & Bigger Hailstorms Because of Warming: Peer-Reviewed Study Proves Prediction Wrong
Climate alarmists contend that various types of extreme weather events become both more frequent and more extreme as the world warms; Xie and Zhang first noted that Xie et al. (2008) had already found there was a “significant decreasing trend of hail frequency in most of China from the early 1980s based on 46 years of data during 1960-2005.” So for this vast country, they began with the knowledge that one of two types of potential hail extremeness (hailstorm frequency) had not lived up to climate-alarmist hype. Therefore, the two researchers focused on the other type of extremeness (hailstone size), noting that “changes in hail size are also an important aspect of hail climatology,” and they went on to study the long-term trend of hail size in four regions of China over the period 1980-2005, using maximum hail diameter data obtained from the Meteorological Administrations of Xinjiang Uygur Autonomous Region (XUAR), Inner Mongolia Autonomous Region (IMAR), Guizhou Province and Hebei Province.
Xie and Zhang report that their work revealed an uptrend in maximum hail diameter in Hebei, a flat trend in XUAR, and a slight downtrend in both Guizhou and IMAR; but they add that “none of the trends is statistically significant.”
http://www.co2science.org/articles/V13/N51/C3.php
Unprecedented Medieval Arctic Warming Confirmed By New Study – Significantly Hotter Than NASA’s Fake Temps
Read here. Other than the typical lamebrain MSM reporters (scroll down to Arctic temps “reported” by George Monbiot), just about everyone else knows that NASA completely fabricates modern hot Arctic temperatures from wishful alarmist thinking.
NASA’s blatantly, bogus temperatures (lies?) are an attempt to scare the public into thinking the ice sheets of Greenland are quickly melting away because of unprecedented “high” temperatures, including those maximum high temperatures forecasted for the ice sheet this week: an average of a -35°F (yes, minus) for the daily high temps. Obviously, the northern ice sheets are safe despite the bogus NASA and Monbiot Arctic alarmism.
While NASA’s computer jocks spend their time and our money on fabricating fake temperatures, real scientists continue to conduct expert scientific research on the Arctic. Their latest peer-reviewed findings confirm a previous study that the Medieval Period experienced Arctic temperatures some 2-3°C higher than modern Arctic temps. Map source here.
Study Shows Half Of Warming Since 1980 Due To Clear Skies
Read here. The number of major volcanic eruptions has diminished over the last two decades, resulting in a significantly cleaner stratosphere that allows more solar energy to strike the earth’s surface. The net result: at least 50% of modern “global warming” is due to less volcanic activity.
http://notrickszone.com/2010/12/19/study-shows-half-of-warming-since-1980-due-to-clean-skies/
New Paper: Solar UV activity increased almost 50% over past 400 years
A peer-reviewed paper published today in the Journal of Geophysical Research finds that reconstructions of total solar irradiance (TSI) show a significant increase since the Maunder minimum in the 1600’s during the Little Ice Age and shows further increases over the 19th and 20th centuries. A significant new finding is that portions of the more energetic ultraviolet region of the solar spectrum increased by almost 50% over the 400 years since the Maunder minimum (second graph below). This is highly significant because the UV portion of the solar spectrum is the most important for heating of the oceans due to the greatest penetration beyond the surface and highest energy levels. Solar UV is capable of penetrating the ocean to depths of several meters to cause ocean heating.
Reconstructed solar irradiance in the ultraviolet Ly-a band at 121.6 nm shows almost 50% increase
JOURNAL OF GEOPHYSICAL RESEARCH, VOL. 115, A12112, 11 PP., 2010
doi:10.1029/2010JA015431
http://www.mps.mpg.de/projects/sun-climate/papers/uvmm-2col.pdf
Looks like the response did make it after all. Note the hyperlinks under ‘New Discoveries’ sections are not apparent. If anyone has a particular interest in the URL, Let me know, I will check back in a day or two if I get a chance.
James-
Your internet access does appear a bit dodgy – it just coughed up a long list of distorted interpretations and non-peer reviewed opinion copy-and-pasted from the contrarian blogosphere. I hope you had to pay to spew that garbage.
And please, enough with the pretense of having read the NIWA report. You obviously have never even glanced over the report or you would realise how stupid it is to say, “at this stage I am sceptical whether I would be looking at the ‘raw data’ or the ‘adjusted, homogenised data’.” All the raw data are graphically presented in the appendices with all corrections – entirely necessary for consistency within and between sites – explicitly detailed and justified year-by-year for each of the seven stations.
I continue to question the truthfulness of your claims to have read the NIWA report and have expertise in statistics. You can prove me wrong simply by explaining footnote 15 on page 163. Why do you refuse to do so?
Below is a transcript of the relevant Q&A from the Harrabin/Jones interview. Obviously the warming of 1995-2002 and the cooling of 2002-09 were tiny variations of negligible scientific interest. So we are a long way from the dramatic changes of 0.2°C/decade expected by the IPCC.
B – Do you agree that from 1995 to the present there has been no statistically significant
global warming?
Yes, but only just. I also calculated the trend for the period 1995 to 2009. This trend (0.12C per
decade) is positive, but not significant at the 95% significance level. The positive trend is quite
close to the significance level. Achieving statistical significance in scientific terms is much more
likely for longer periods, and much less likely for shorter periods.
C – Do you agree that from January 2002 to the present there has been statistically
significant global cooling?
No. This period is even shorter than 1995-2009. The trend this time is negative (-0.12C per
decade), but this trend is not statistically significant.
Mike my previous two posts do not appear to have ‘made it’ possibly due to length or internet connection quality. I did attempt a response. Have a good life!
James-
I have called your truthfulness into question. You have made no attempt to explain footnote 15 on page 163 of the NIWA report to prove me wrong.
Mike Palin – I couldn’t ‘reply’ direct to your comment above.
Anything with which you disagree simply gets tacked as contrarian and dismissed without justification (with the odd insult thrown in for good measure). In any event, as an economist, being described as a contrarian is not really an insult, or a bad thing.
The problem with such lengthy ‘conversations’ and my current situation does make the communication a bit patchy and not real precise. Believe it or not I am travelling and have ad hoc access to internet not always via my laptop, and not always reliable, with frequent ‘drop outs’. Therefore I tend not to re-read the threads, particularly as they appear all over the place. It is easy therefore to not remember the precise context of what I wrote previously. In this case, as mentioned previously my comment on anomalies vs raw data was more of a generic question, so with my mind in that set, and without checking the precise context, I was just thinking about checking temperature records in general. You are correct in stating the NZ raw and adjusted temperature records are available. but I am sure you are aware that this is not necessarily the case globally. As Phil Jones has testified (but I have not checked), The CRU in some instances have not retained the raw temperature data or indeed the ‘adjustment’ details. they simply have the ‘adjusted’ temperature data. In other instances, such as the Australian Bureau of Meteorology, the only temperature data which is available for public access on the website (at least as far as I am aware) is their ‘adjusted’ data. In general, the data presented for public consumption by NASA GISS is also the adjusted data. The difference can be quite dramatic as shown here: http://climateaudit.files.wordpress.com/2010/12/nasa_us_adjustments.png There are of course lots of other examples I could site but that would involve cutting and pasting from so called contrarian sites which you would automatically dismiss anyway. Nevertheless I contend my general scepticism regarding temperature data is well placed, though I accept it wasn’t well posed in this particular example because of context and for that I apologise.
My answer to your last question remains simply that in asking questions myself, I don’t have to answer questions others may wish to pose to me. Given my questions remained unanswered, i wasn’t particularly disposed to answering random questions, particularly if it meant re-reading a lengthy report on-line with my currently dodgy internet access. What fascinates me is why you think it is so important yet you dismiss without any reasonable argument, any contrarian information posted at this site? I think it’s all a game to you.
I have read the footnote just now and don’t find anything particularly exciting about the statement that the trend line shown for both raw and adjusted temperatures has a 95% confidence level of plus or minus 0.32 C, but that further research is required before they can quantify the impact cumulative adjustments may have on the level of uncertainty for the ‘adjusted’ trend line. By the tone and insistence of your repeated requests for me to address this footnote you clearly think there is something more vitally interesting than I do in it. Good for you.
James-
Many thanks for (finally) addressing my question at the end of your comment. I didn’t think there was anything particularly interesting about the footnote either, but I did doubt you had access to it. I was clearly wrong.
Now, you can demonstrate that you know something about statistics by explaining what a 95% confidence interval is and how one would go about calculating it for the slope of a linear time series. If you do so, then you can expect this (not-so-Spanish) inquisition to come to an end.
Mike – this is becoming juvenile. Are you showing off your high school knowledge? You are asking me to describe something I learnt in High School, but I am sure it can be readily googled.. I normally do simple calculations on my TI-30X IIS calculator, or for larger, more official work on proprietary software. I don’t think I have done manual calculations for years, nor have my colleagues I am sure.
Now, now James, there’s no reason to spit the dummy. I understand that you are traveling and may be away from the comfort of your calculator and proprietary software. I only asked you to explain a basic statistical parameter and how the corresponding calculation would be done. I wanted to know the depth of your self-proclaimed skill and experience in stats and you have kindly obliged.
BTW, I’m an RPN (HP-11c) man myself.
You an economist, James? How do you then discern which scientists are credible and which are not? Do you have any science training? You must work at an interesting university where the economists get to mingle with the scientists.
To be fair, I have a science degree in geology – earned with blood, sweat and tears – and have been following global warming research since 1979.
James. I can’t seem to post this as an inline reply.
Later on you do clarify that Connolley was only topic-banned. I’m afraid that after reading the misleading headline “William M Connolley – RealClimate co-founder banned from Wikipedia”, my small intestine leaped up and strangled my brain to prevent it from further damage, a risk attendant on all your walls of copy-paste text. I mean, your latest effort – a ridiculous three foot long post of link-spam (to which I could simply reply: http://www.sketicalscience.com), and which you even say you won’t justify and don’t even claim are legitimate. Why would we bother?
But I’ll bite on one point – I’ll give you some answers from your original post:
“Why not just show anomalies against the average of the whole time series?” Because the baseline for comparison would need to change every time new data was added. It’s unnecessary, confusing and misleading. The point that has been made time and again is that the anomaly doesn’t matter, the trend does. And for that, the baseline period is relatively inconsequential. You’d think a competant statistician would know that already. So are you a competant statistician as you claim, or was that not a genuine question…?
And: “…during a period where IPCC expectations were that the temperature anomaly would continue to rise due to continued increases in CO2 emissions?” has been answered. Your assertion about IPCC expectations is false, so the question is meaningless. When asked to explain why you think the anomaly is significant (in any sense), you simply evaded with an off topic wibble.
So you have your answers. There are still many questions that have been put to you with no answers forthcoming. Please make sure your reply, as you put it, “addresses the matters raised†(ie no more link spam, but your responses). You see, its not that you haven’t replied to all questions, its that you have not replied substantively to any.
FrankD – thanks for finally admitting it was you that in fact hadn’t read what was written and made an erroneous response, even if you were not gracious enough to apologise for your sledge on me which followed your error.
You may not appreciate the articles which I cut and pasted, but it was done in response to challenges made to actually produce examples of sceptical peer reviewed literature. I know I included non peer reviewed articles too, but that was mainly to accommodate my access to a very iffy internet service at present. To say you may as well post a link ‘skepticalscience’ in response is inappropriate. I am not listing skeptical or non-sceptical blog sites, I have shown specific articles over a certain period to back up what I had previously posted and in response to requests made of me. If you choose not to read them, that is your right. This site is not here just for your satisfaction.
That also applies to your criticism that I have said I wont justify the references. That wasn’t the point of the posting. It was to ‘put up’ as requested, examples of sceptical peer reviewed research papers. I am not setting myself up as a climate science expert and have not attempted to do so.
With regards to my comment: “Why not just show anomalies against the average of the whole time series?†My point here really is that you can sway the reader of a graph easily when showing anomalies over a long time period when you selectively choose the ‘normal’ to be over a shorter time than the series. Depending on the ‘normal’ time frame, the graphing of the anomalies will ‘look’ different and can be manipulated easily to show a particular story. A straight graphing of the ‘raw’ data does not have the same problem and there are no ‘baseline’ issues as you mention, because the start period remains the same. Showing anomalies to determine trend can be useful, but is certainly not necessary and can be manipulated (just as choosing the start date will manipulate results).
I can’t imagine why you think my assertion re IPCC expectations is false. Are you saying that the IPCC scenario projections in AR4 displayed an expectation that temperature anomalies would remain static or decline?
You state I have not replied substantively to any questions raised. I would just ask readers to read my responses to demonstrate that is a false assertion.
Frank I still haven’t re-read the NIWA report to answer your specific question, so I don’t even know the relevance of that question. But as you and everyone else did not answer or even address my question regarding NIWA not defending their previous temperature record, I feel no compunction to do so. As you would know NIWA have now essentially changed their previously published temperature record along with the many ‘adjustments’ made by Singer. The new NIWA record does appear to show a slightly different story, that is, the rate of warming has slowed since 1960. This of course differs from what we are commonly lead to believe.
Woops I am referring to Dr Jim ‘Salinger’, in the above when referring to adjustments made by ‘Singer’ .
In your first post here you said: Finally, regardless of the above points, it seems clear the temperature anomaly has declined over the last 11 years of measurements which is during a period where IPCC expectations were that the temperature anomaly would continue to rise due to continued increases in CO2 emissions?”
I assume from your claim that the anomaly has declined, that you are referring to New Zealand temperatures, in which case, the IPCC (or more correctly the ensemble of models that the IPCC use in their summary of the science) have never said that these seven stations in New Zealand should metronomically rise. This is why I asked about statistical significance at the time – the trends from these seven stations do not form a statistically signficant trend in your cherry-picked date range. If you are referring to NZ, the IPCC have never made the claim you attribute to them.
If you are referring to global temperatures, then your statement that the anomaly has declined is simply wrong.
To take up your “scientifically significant” point, nothing be concluded from so few stations over such a short date range, without considering the local effects of ENSO, and other factors. You make this point, but then imply that the “declining anomaly” by itself suggests the IPCC is wrong, without considering any of the scientific factors influencing the data.
To take one example – I’m not sure about the NZ impacts, but I presume they are similar for Eastern Australia: the cyclical difference (a few degrees) between El Nino (your cherry picked start point) and La Nina (your end point) would be expected to mask the long term rise of 0.1 to 0.2 degrees over the short time frame. Comparing like to like – peak to peak between comparably strong El Ninos (1998 was one of the strongest ever recorded) – might be a bit fairer. Scientifically, the data we see in the NZ record since 1998 is pretty much exactly what we would expect to see, considering both long term and short term influences.
I don’t care much for apologies either way, but will you concede that your original post was simply misleading? That it was wrong to imply (as you did) that having a fixed baseline against which anomalies are measured is somehow a dubious and misleading process? That it was wrong to imply (as you did) that the IPCC claimed NZ would rise in line with CO2?
Simple “yes” or “no” answers, where appropriate, places no undue pressure on your time or connectivity issues.
James. I think you should stop now, you’re embarrassing yourself and making the rest of us cringe!
For an “expert statistician”, you appear to show all the appreciation of baselines and anomalies of one of Anthony Watts’s acolytes.
It took me three links and two minutes to find the data, another minute to look at the data. Two minutes to make a graph with trendline.
Recognise it? It’s a recreation of the NIWA graph complete with 0.91°C trend per century.
Thirty seconds to create a new 1920 – 2009 baseline, and the anomaly series. Another minute for the new graph.
The trend from 1920 onwards is 1.05°C per century. Oh my God! Look at all the red! Should we panic now, or would you just like to go away and learn to interpret graphs?
A Freudian slip, James?
Your response to questioning reminds me of the apocryphal advice to young lawyers: “… and when neither the facts nor the law are on your side, then just do your best to confuse the issues…”
Yes probably was a Freudian slip. Many at this site would benefit from reading some of Fred Singer’s stuff to get some balance.
PS: You must be easily confused Rob Taylor. How would you get past the IPCC summary for Policy Makers?
au contraire, James, to me it seems all your contributions to this comment thread seem to be made with the intention of creating confusion. you seldom respond directly to questions, and when you finally do it’s a few hundred comments down the list. you make all kinds of wild claims which you fail to back up. you cut and paste a bunch of rubbish which you claim to be peer reviewed science but actually turn out to be articles from denier blogs about trying to analyse climate trends using such reliable proxies as “lunar eclipse brightness” and “tuvaluan real estate prices” and then expect us to treat you as anything other than a laughable troll.
as soon as the pressure is on you suddenly need to go on a journey to deepest darkest guatemala where the internet is carried in by donkeys. you are a ball of denier confusion
You might be interested in this.
Many eminent scientists and researchers predicting global cooling.
http://notrickszone.com/2010/12/28/global-cooling-consensus-is-heating-up-cooling-over-the-next-1-to-3-decades/
Boy, I bet Mojib Latif (Mr Global Warming), Noel Keenlyside and Mike Lockwood would be pissed off at being so blatantly misrepresented.
I do note, with considerable laughter, that Girma Orssengo & Piers Corbyn are supposed experts on the list.
Nice bit of disinformation campaign on wind energy in the Herald by you Bryan Leyland!
http://www.nzherald.co.nz/nz/news/article.cfm?c_id=1&objectid=10696886
As you certainly know, NZ’s wind farms receive no price subsidy and compete directly with the rest of the generation. They are build because they make economic sense to the investors because they are profitable. Would US pension funds otherwise invest into them?
Also you know to well that the true cost of fossil fuel power generation is not at all factored into the price of their generation. For as long as so called “liberal free market economics” have ruled the field, inconvenient externalities such as pollution of the environment have been conveniently absent from the corporate balance sheets.
If they were factored in (and the ETS that you so much hate does all but lip service to the real cost) then the benefits of alternative sustainable energy production would be much harder for you to deny.
You write: “Windpower is a totally ineffective way of ‘fighting climate change’. Firstly, it is widely accepted that a 20 per cent contribution by wind is about as much as our system can accept without running into excessive costs and serious problems with system operation.”
Now if we indeed eventually succeed in generating 20% of our power needs in NZ using wind energy, that would in fact be a great achievement. NZ will never generate all its power from one source. Sustainable living arrangements will require us to intelligently utilize a number of energy streams we have access to and our generation will always be a mix. 20% less coal, oil or gas burned because of the contribution of wind power will be a good step in fighting AGW.
Windfarms in New Zealand receive benefits from not having to predict output and not being penalised for failing to do so. A major benefit. Without that, no-one would be building any. They also receive some benefits from lower cost transmission. As I pointed out, the name of the game is to lock up sites rather than actually build something.
Everywhere else in the world, windpower is heavily subsidised. 2-3 times the cost of alternatives. Therefore, by definition, it is uneconomic. Over the last few weeks, UK wind power has made a tiny contribution – at times, nothing! If the UK switched from coal to gas, it would achieve a huge reduction in CO2 and little cost. And with shale gas now becoming available, there is heaps of gas. Nuclear is even better for CO2 reduction.
If you believe that manmade CO2 causes dangerous global warming, there are much better ways of reducing it. Hydro in particular. But the greenies oppose all hydro development. Especially storage – which is what we need.
20 % wind does not imply a 20 % reduction in CO2 because the wind blows hardest in the springtime when we usually have heaps of hydro power. So much of the wind power will cause spill at hydro stations. As it did this year.
Wind power – especially at 20% – will require backup from open cycle gas turbines – expensive and inefficient.
Bryan if you actually went to some of the NZ Wind Energy conferences and worked through the papers given there you would not carry on publishing this sort of misinformation.
NZ’s wind energy fluctuations are actually smaller than the hydro fluctuations. Spread over the country NZ’s wind generation has given predictable output over a long time. Wind forecasting has become a lot better over time and is now quite accurate.
As far as artificial storage lakes (one of your hobby horses) its rubbish. You will need to pump water up before letting it run through the turbines again. This creates not an insignificant loss factor. For NZ it is much easier to simply throttle back existing hydro generation when sufficient wind energy is available. This causes no extra losses.
Also Wind has often been available when highly expensive peak power generation plants would have otherwise had to be fired up. This is another area where real savings are made when power is available from wind at a fraction of the cost of these.
As far as CO2 is concerned, flooding large valleys to make room for lakes is releasing vast amounts of CO2 as the old top soil and vegetation rots away. Some figures put the CO2 output of new storage lakes ahead of that from coal fired power plants. I assume you are reading the journals.
UK and Gas: Well where have you been over the last years? North Sea Oil and Gas production is in sharp decline.
http://www.peakoil.net/OilGasUK.html
How on earth can you recommend to the UK to add more dependency to an already stretched and rapidly declining resource?
Your economic arguments still suffer from complete myopia regrading the actual cost of operating fossil fuel power plants as you simply fail to comprehend the true cost our current lifestyle on the environment and the rights and aspirations of future generations.
And even if open cycle gas turbines have to kick in at times of non-met peak demand (they do that already and not because we have 4% of wind generation in the NZ mix but because of drought conditions and times of insufficient alternative generation capacity) the more wind generation there is in the mix the more often we will have times where turning these gas stations on will be able to be avoided.
In the end it will also be consumers who through smart metering and other technical advances will be able to adjust their power demand in times of critically peak times.
Living sustainably is not achieved by demanding the comforts of our unsustainable current enterprise to be retained at any cost.
Compromises will need to be made also by the consumer and the industry as we go into a future without the benefit of abundant and cheep but unsustainable fossil fuels.
Hey Thomas!
You think Britain is going to get energy security by building windmills?
You are funny dude!
Between 0 and 1.5% of energy was provided by wind over the last few weeks.
Britain will have to build between three and ten windmills every day for the next 10 years, and even then it has to build the equivalent amount of gas stations as backup generation.
(this is actually what they are planning, which is why the project will cost twice as much as it should do)
JD: Alternative energy concepts will always be a mix. There is no one golden bullet.
But at least whatever wind they can harness, its not going to to go away as the fossil fuel surely will be as you can see from the graph I linked to. The UK is well past peak oil and gas production. Imports will get harder and harder to get and prices will sky rocket over time. Yet the cost of the wind will remain zero….!
Living in a post peak oil world will look very different from the life of the last century where we grew our economies exponentially on the basis of unsustainable cheap flows of oil and gas.
Better to invest in sustainable energy flows now while there is still some life left in the momentum of the economy.
Hi Thomas
I agree that a sustainable energy future needs to have a mix of sources, but currently the UK sector has only planned for wind. There are no practical hydro schemes available, the Severn Barrage has been abandoned, and wave power is only a research project
Therefore it is wind or nothing.
In order to make “free” wind competitive, the UK are imposing a 26 pound per tonne CO2 tax on fossil fuel generation. So when you say that wind is “free” is somewhat elaborating on the truth.
One can of course go into all sorts of mental contortions to justify this, but the bottom line is that power prices will probably triple of the next 10 years. A lot of domestic industry will be offshored, further speeding the demise of the UK.
Half a million pensioners stayed in bed this Xmas, in the UK, just to stay warm.
If and when the next cold Christmas arrives, maybe next year, we can expect an increasing number of these people to die a cold and lonely death brought upon by fuel poverty.
These deaths will be directly attributable to government policy.
Also, items 6 and 20 refer to the same person, a withered Gray eminence.
Ha rotflapmp, ‘James’ anonymously slags off Mike Palin and then invokes tobacco shill Fred Singer.
If your paymasters really want you to sow confusion then you’d better shift over to the unquestioning mob at Muriel Newman’s because anyone who holds up Singer as anything other than a sack of shit is in for a fight at this blog. Come on. Try harder. Explain in detail why Singer is not a fraud and all who venerate him are not equally fraudulent.
Doug – What I wrote could hardly be described as slagging off Mike Palin, except perhaps to someone with no objectivity. Also, what I wrote about Singer would hardly be described as veneration – I am just suggesting some balance. If we went back into any scientists history to discover if they were ever wrong and then dismissed anything they ever had to say in the future if they were, you would have ZERO scientists you could rely on, including those you idolise. Grow up!
I think I will leave you to your comfortable, back slapping, none investigative little blog site, there is nothing for the open minded here. You can thank the likes of Doug for creating such an isolationist site.
“there is nothing for the open minded here”
you’re only open minded in the sense that you are easily convinced and have little ability to differentiate between scientifically robust information and the kind of denialist rubbish you vomited up above.
Good riddance. You’ve added nothing but irrational inconsistent nonsense, probably deliberately in terms of bad motives. Who will be the next clone?
I think I will leave you to your comfortable, back slapping, none investigative little blog site, there is nothing for the open minded here
Yes, James, you’ve failed in your mission to convince us that the scientists are wrong, and the ignoramuses are right.It is always a hard sell to the rational and well educated (like us warmists).
Your completely naive comments about raw data and anomalies were the final straw for me. Be honest, you’ve never attended a lecture on statistics in your life, have you?.
Be honest, you’ve never attended a lecture on statistics in your life, have you?.
But he has read Anthony Watts, who recently ran exactly the same specious “fraudulent baseline” meme at WTFUWT. Tamino, predictably, provides a clear rebuttal to this nonsense: tamino.wordpress.com/2010/12/13/odd-man-out/
James,
I am somewhat confused by your position on this issue. On the one hand you insinuate that NIWAs temperature data are useless and/or show negligible warming trend. And then you point out:
“Reconstructed solar irradiance in the ultraviolet Ly-a band at 121.6 nm shows almost 50% increase” and further “This is highly significant because the UV portion of the solar spectrum is the most important for heating of the oceans due to the greatest penetration beyond the surface and highest energy levels. Solar UV is capable of penetrating the ocean to depths of several meters to cause ocean heating.”
Explain
1) How can there be negligible warming and then suddenly there is warming but it was solar activity all along?
2) Just precisely what is the expected forcing of the increased Ly-a band? And how does this compare to the effect of CO2?
Before you answer these questions, you should just be aware of one more thing. The paper you cited:
JOURNAL OF GEOPHYSICAL RESEARCH, VOL. 115, A12112, 11 PP., 2010
has a senior author Sami Solanki. Sami is an oustanding solar physicist in fact director of the Max Planck Institute for Solar System Research and on this forum we all respect his knowledge and expertise on solar activity and GHGs and their respective roles in warming. However, this is what Sami says on the matter,
http://www.ens-newswire.com/ens/aug2004/2004-08-03-03.html
which I think you will agree entirely contradicts your interpretation of the data. Still not convinced? perhaps his position has been taken out of context? Perhaps we could put on a small wager on that one. I have his email address, care for us to drop him a line?
Why not be truthful? Just admit that you are trying to confuse the uninformed, and that you don’t really care about the truth nor the consequences of climate change, its just profits that matter right?
“James”, if you want people who think like you then go to Muriel Newman’s house of green crayon letters.
I am delighted to have driven you away with the cold light of reason. I await your next sock puppet incarnation and hope to see it off more quickly.
The problem is that you are just not trying. Seriously, work on your material before trying it here. Indeed, I am happy to offer editing – just like Bob Carter did for EG Beck – the mind boggles at how crazy it was before the Carter edits.
Send your stuff to me and I’ll do my best to make it coherent. I promise I can bring the standard of your wordsalad up to the lofty heights of erudition exhibited by the likes of Ken Ring. (Though he does do it all by himself).
Doug-
Thanks for the link to the RC discussion from 2007 of the Beck “paper” on historical measurements of atmospheric CO2 in E&E. That second plot of CO2 versus year of measurement is a hoot!
It may be a hoot but it’s not very original.
Anyone who works in early years education could show lots of work like this – but with better choice of crayon colours.
A challenge to the Climate Conversation Group, Climate Science Coalition, Hot Topic, Open Parachute and NIWA.
1) Plot a 15 year moving average of the 7SS NZTR composite actual temperatures 1909-2009
http://www.niwa.co.nz/__data/assets/excel_doc/0011/99965/NZT7_Data_FINAL.xls
Excel: Copy the 7SS composite actuals to A1
Tools – Add Ins – Data Analysis – Moving average – A1:A100 to B1
Insert Chart B15:B100
What do you see?
2) De-trend the 7SS actuals for the normal warming since 1850 that the latest science shows to be 0.5 C/100 yr that is accounted for by solar variation and climatological causes or use the IPCC figure of 0.45 C if living in the past is your preference.
Excel:
Create a column 1850 to 2009 (A1) [Start the series 1850 1851 1852 then extend using the bold + bottom right corner of the last entry]
Create a column 0 to 159 (B1) [Use the bold + as before]
Create a column (C1) =0.005*(B1)+13.6 [Use the bold + again to extend to row 160]
Now copy in the 7SS composite actuals from row 59 to 159 (D60)
Calculate the anomaly (E60) =(C60-D60)*-1 and extend to row 160
Plot a 15 yr moving average using the technique in 1).
What do you see?
3) Perform a linear regression on the 15 year moving average de-trended anomaly data.
Excel: Tools – Data Analysis – Regression
For 1923 (E74) to 1953 (E104)
What do you see?
For 1953 (E104) to 1963 (E114)
What do you see?
For 1963 (E114) to 2009 (E160)
What do you see?
———————————————————————————————————
Note: the column:row addresses have not been checked on an actual spreadsheet so you’ll have to check for yourself.
1) A moving average
2) A typo? Unreferenced values, some simplistic assumptions and a correspondingly simplistic analysis
3) The unusually steep warming in the 1940-1960 period is paralleled by an unusually large increase in northerly flow during this same period. On a longer timeframe, there has been a trend towards less northerly flow (more southerly) since about 1960.
However, New Zealand temperatures have continued to increase over this time, albeit at a reduced rate compared with earlier in the 20th century. This is consistent with a warming of the whole region of the southwest Pacific within which New Zealand is situated.
Holy cow Richard C2, that’s one helluva spreadsheet you have there. The formula: (E60) =(C60-D60)*-1 tells me that you are real whiz-bang when it comes to matters quantitative. Did ya get James to help with that? Sure makes my head ache.
People, people, people,
You’ve totally misunderestimated (thanks, Dubya) poor James. You see, he never actually claimed to have attended
a lecture on statistics in his life; he just claimed that “I am in fact extremely skilled and experienced in
statistical analysis beyond what (sic) most so called climate scientists are. I see this done on a daily basis in
the climate arena.”
Leaving aside the slightly Jennings-ish English, this is perfectly reasonable hyberbole, because it obviously
means that he has daily read the headlines from WUWT, and consequently is able to meaningfully comment on the
skill of climate scientists. This has provided much of his experience, but he has also been able to gain further
extreme skill from the one occasion that his boss asked him to use Excel to graph projected growth in sales. He
wasn’t actually able to produce the graph, but in the process he did manage to find an Excel function to average
past growth and his boss was so grateful he said, “Thanks James, I’ll get my secretary to finish it off from
there.”
The only thing I can’t understand is why anybody actually bothers to reply to a single one of his comments. The
“Hidden due to low comment rating.” feature makes this blog the best for following the stream of “added value” and
surely enables you to easily ignore James’ erudition.
Sorry about the hard-coded CRs above.
John D says:
In order to make “free†wind competitive, the UK are(is) imposing a 26 pound per tonne CO2 tax on fossil fuel generation. So when you say that wind is “free†is somewhat elaborating on the truth.
ClimatBiz Article on 10-21-10: “UK’s Carbon Tax Bombshell Takes Business by Surprise†said:
“The CRC requires companies that consume more than 6,000 megawatt hours of electricity to pay £12 ($18) to purchase an allowance at the beginning of each year for every tonne of carbon they emit.”
Where does the ’26 pound per tonne’ figure come from? Are you prorating the 1B pound investment in the green energy bank as part of that?
It is a thing of wonder for me that ‘the business community’ sees any imposed carbon tax as being an unwarranted intrusion by government. Is there not some awareness that the energy companies have operated in a way that amounts to a public subsidy from the beginning? Who will address the environmental costs, if not governments? Capitalists are supposed to be market realists yet they somehow manage to ignore the environmental costs associated with production. It’s somebody else’s problem and the ‘somebody else’ is the public. More to the point of you comments – how do you reach the conclusion that the purpose of the carbon tax is(was) imposed “In order to make “free†wind competitive“? It may just be a leveling of the ‘playing field’ – wind turbines produce no CO2 – how else would alternative energy schemes compete when traditional energy production gets a free ride?
I am suspicious of off-hand projections, such as, “the bottom line is that power prices will probably triple of the next 10 years.†And your last three paragraphs, tug at our heartstrings but contain ‘facts’ which seem drawn from a hat and projections of dubious value that are obviously skewed. Does the UK government really know that – “Half a million pensioners stayed in bed this Xmas, in the UK, just to stay warm?â€
Even your opening comment quickly deteriorates to become the springboard: “Therefore it is wind or nothing.†If it is true that there are no other alternatives available, given the UK’s geography, why shouldn’t wind become the preferred alternative? Wind, in fact, is not only free but, in the UK, abundant.
Well, we can check back in a few years can’t we?
I am 100% convinced that wind will fail in the UK. Wind is not abundant. It is scarce and unreliable, and it is certainly not free.
I think even the Greens are starting to realise this.
As for links to my info. I don’t see why I constantly need to spoon feed you guys. If you take your head out of your backside for just one minute, you might actually see there is another world out there.
“I am 100% convinced that wind will fail in the UK”
I’m sure you are, but things that you’re erroneously convinced of is a fairly large set.
“If you take your head out of your backside for just one minute, you might actually see there is another world out there.”
it has long been clear to most people here that you inhabit another world, John.
Here’s a few starters for you
Concern over huge fluctuations in the supply of electricity from Britain’s 3,000 wind turbines has prompted National Grid to begin detailed forecasts of wind strength.
The turbines have delivered well below their usual output this winter and in the 24 hours to 5pm yesterday contributed only 0.5 per cent of the country’s power. Parts of the day were so still that wind power’s contribution fell below 0.2 per cent. On the windiest days, the turbines deliver about 8 per cent. A record of 10 per cent over a 24-hour period was set on September 6 last year.
But since the beginning of December, turbines have been operating at only 20 per cent of their maximum capacity compared with an annual average of about 30 per cent.
(Source – The Times)
And then there’s Louise Gray, normally a gushing supporter of WWF press releases:
Wind farms in Britain generated practically no electricity during the recent cold spell, raising fresh concerns about whether they could be relied upon to meet the country’s energy needs.
http://www.telegraph.co.uk/earth/energy/windpower/8234616/Wind-farms-becalmed-just-when-needed-the-most.html
big deal. I’m pretty sure it’s obvious to everyone that when the wind doesn’t blow no power comes out. that doesn’t mean it’s not a worthwhile investment for the times when the wind does blow.
I wonder if you’ll sing the same tune when the headlines are: we’re all out of coal so our coal-fired plants didn’t produce any power this week…
Big deal?
What is going to provide the power when the wind doesn’t blow [gratuitous insult snipped]?
[JD: second warning. GR]
Hang on, gratuitous insult snipped. I apologised for the last one, yet Rob Taylor seems fit to call me a “denilist Koch Sucker”
Doesn’t seem like a level playing field to me.
RT’s comment had the merit of being funny. Yours didn’t. Make your insults amusing, and they’ll stand a better chance of getting through… 😉
Ah, someone who’s just not getting it and then there’s the recent Carry On references – at this point I feel I must include a link to Mitchell and Webb’s bawdy 70’s hospital sketch. (Warning: a bit rude)
“What is going to provide the power when the wind doesn’t blow [gratuitous insult snipped]?”
you can’t see the point for the straw. there is nobody at all arguing that wind power should be the only form of power generation employed.
wind, when available, should be the preferred source over more highly polluting options which deplete natural resources.
your argument = mankind should abandon apples as a food source because they don’t provide all our dietary requirements and don’t grow all year round
np. Oh, I do like that apples can’t supply all our dietary requirements line. I’m going to use that – somewhere, sometime.
John. Have you yet worked out the cumulative subsidies provided to fossil fuel power generating industries? I’ll listen to your arguments about wind / solar / tides / whatever – when the totals are equal.
One scarcely needs to argue with you, John. I will note in passing, however, that your inability to grasp the meaning of an average filters through into your perception of overall wind resources. “‘The wind isn’t blowing in Cornwall today – therefore wind power is a failure in the UK” is exactly the kind of weather=climate ‘reasoning’ you constantly exhibit here, and if anybody reading is silly enough to believe it I doubt they can be reached by rational argument anyway.
Which Wind Utility is providing yours, by the way? Good rates?
Though I don’t doubt that you are as convinced as you say, your convictions bear no relationship to reality, and since a small hind-part of your brain actually knows this, you become abusive very quickly. You do our cause a lot of good in these forums by highlighting the intellectual inadequacies of the denier mentality and I seriously cannot conceive of what you imagine you’re achieving.
and since a small hind-part of your brain actually knows this, you become abusive very quickly. You do our cause a lot of good in these forums by highlighting the intellectual inadequacies of the denier mentality
Bill, you expect me to remain polite whilst you spew out this kind of shite?
Your grasp of simple arithmetic seems non-existent.
Wind consistently provides a tiny fraction of UK power. It is heavily subsidised, to the point where it is almost the most expensive form of electricity generation available.
Any transition to a new technology is going to need subsidies to allow it to compete with large-scale incumbent generation methods. Do you actually expect wind power to be instantly competitive with a generation option that has had decades of investment already poured into it? Why would you expect this?
If you think that Coal supplies are limitless and that climate change is not happening then perhaps there is no need for wind generation, but if you believe both or either of those things it is clear you are not very well-informed (big surprise there). It is obvious that since wind has much lower operating costs, low fuel overheads and low emissions it is going to out-compete any fuel-burning based generation in the long term since fuel prices are bound to increase as finite supplies of fuel are depleted and/or carbon costs become part of the global economy. if you think these things aren’t going to happen , then I have a used car you might like to buy…