
 The cranks in the NZ Climate “Science” Coalition have sunk to new lows in a desperate attempt to cash in on the far-right driven furore about the Hadley CRU data theft. Here’s an extract from a press release which was doing the rounds of NZ’s newsrooms this morning:
New Zealand may have its own “Climategate”, including manipulation of temperature readings, according to a combined research project undertaken by members of the Climate Conversation Group and the New Zealand Climate Science Coalition. The researchers claim that temperature readings from seven weather stations throughout New Zealand have been adjusted to show a higher degree of warming than is justified by a study of the original raw data.
The author of the press release and the “research project” into NZ’s long term temperature record is blogger Richard Treadgold, not unknown to readers of Hot Topic. Unfortunately for him, and for the credibility of any of the members of the NZ Climate “Science” Coalition, Treadgold’s approach to the issue is ignorant, his results meaningless, and he can have no excuse for not knowing he was wrong. Worse, Treadgold, Dunleavy and the rest of the NZ CSC seem determined to smear NZ’s best-known and most respected climatologist, Jim Salinger (who did much of the early work on NZ’s temperature record), based on little more than straightforward lies. Their press release continues:
“NIWA’s official graph (done originally by Dr Jim Salinger, who features also in the emails leaked from the Climatic Research Unit of the University of East Anglia) shows considerable warming, which they give as 0.92°C per century, saying this is consistent with global warming over the 20th century. But the actual temperature readings taken from the thermometers show an almost flat trend for 150 years.
These figures all come from NIWA. So, why are they so different from each other? Because NIWA has adjusted the earliest temperature readings downwards by up to 1.3°C, which has the effect of introducing a false warming as the graph then “climbs” to the present day. It’s a disgrace. So far, neither Dr Salinger nor NIWA has revealed why they did this,” said Mr Treadgold.
The real disgrace is that this analysis has been conducted by a team seemingly hell bent on ignoring the facts, preferring instead to make up their own.
Let’s check out the NZ CSC/Treadgold “research project” [PDF]. They begin by showing a graph of NIWA’s long term temp record:

They then compare it to a graph based on the uncorrected data series. Here’s how they did it:
To get the original New Zealand temperature readings, you register on NIWA’s web site, download what you want and make your own graph. We did that, but the result looked nothing like the official graph. Instead, we were surprised to get this:
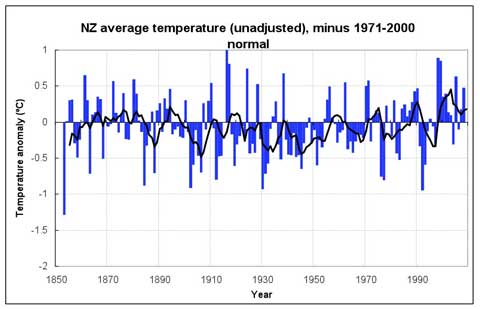
Straight away you can see there’s no slope — either up or down. The temperatures are remarkably constant way back to the 1850s. Of course, the temperature still varies from year to year, but the trend stays level — statistically insignificant at 0.06°C per century since 1850.
Putting these two graphs side by side, you can see huge differences. What is going on?
Have the readings in the official NIWA graph been adjusted?
It is relatively easy to find out. We compared raw data for each station (from NIWA’s web site) with the adjusted official data, which we obtained from one of Dr Salinger’s colleagues. Requests for this information from Dr Salinger himself over the years, by different scientists, have long gone unanswered, but now we might discover the truth.
What did we find? First, the station histories are unremarkable. There are no reasons for any large corrections. But we were astonished to find that strong adjustments have indeed been made.
Did you miss it? The big lie? There are no reasons for any large corrections. That’s it, there. And it’s a lie because the NZ CSC has known for at least three years why adjustments have been made to certain stations.
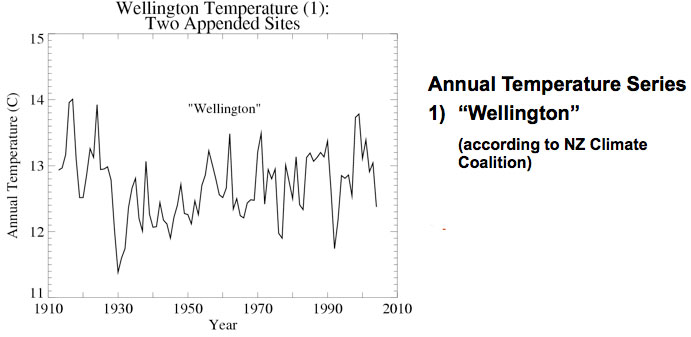
Let’s take Wellington as an example. Look closely at the Treadgold/NZ CSC graph on p6 of their pdf. Look at the blue line (the unadjusted temperatures) between 1920 and 1940. Now look at this graph, prepared by NIWA’s Brett Mullan back in 2006, the last time the NZ CSC were agitating about the NZ temperature record:
Pretty similar, eh? Big drop in the late ’20s. Now look at Mullan’s second graph:
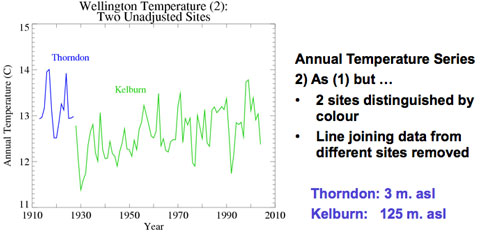
Look again at Treadgold’s graph. He makes no distinction between the blue and green lines — he just joins them up. Temps before the mid-20s were recorded at Thorndon, near sea level, but then the recording station moved to Kelburn at 125 m above sea level. It’s pretty basic meteorology that temperatures fall as you move above sea level, so the two stations are not directly comparable. Treadgold affects not to know this… But there’s no need to throw out all the old data, you can apply a correction. Here’s how NIWA (and Salinger) went about it:
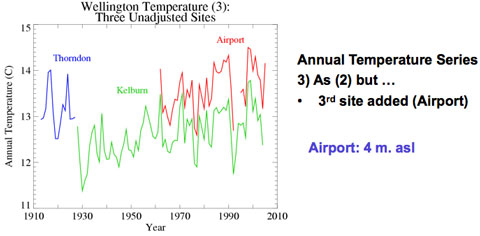
Enter the Wellington airport series. Like Thorndon, the station is very near sea level, and warmer at all times than Kelburn although the “ups and downs” of the record are the same. It’s a relatively easy matter to work out the difference: 0.79ºC. So if you lower both the airport and Thorndon series by that amount, you get:
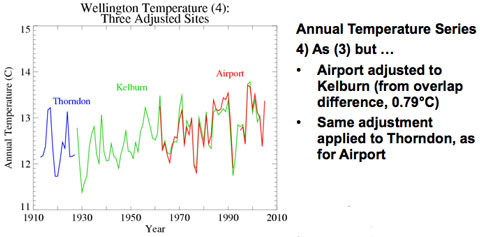
And it’s a very good long term record, with a pretty distinct upward tilt. This sort of correction is commonplace, and not remotely controversial amongst meteorologists and climatologists who are trying to build long term records from disparate data series. Apart from station moves, changes of thermometer and alterations in the environment around the recording station can all have an affect on temperature data, and are commonly corrected for.
So what was Treadgold saying again?
The shocking truth is that the oldest readings have been cranked way down and later readings artificially lifted to give a false impression of warming, as documented below. There is nothing in the station histories to warrant these adjustments and to date Dr Salinger and NIWA have not revealed why they did this.
Nothing in the station histories? It’s all there for anyone who can be bothered to look, or to ask politely. But Treadgold and the NZ CSC have no excuse, because the NZ CSC were told about this information at least three years ago, the last time they tried to make a fuss about “adjusted data”. In other words, Treadgold and whoever in the NZ CSC helped him with the data are being more than economical with the truth, they are lying through their teeth. But they keep on digging.
One station, Hokitika, had its early temperatures reduced by a huge 1.3°C, creating strong warming from a mild cooling, yet there’s no apparent reason for it.
Yes there is. Another station move.
We have discovered that the warming in New Zealand over the past 156 years was indeed man-made, but it had nothing to do with emissions of CO2 – it was created by man-made adjustments of the temperature. It’s a disgrace.
The real disgrace here is that the NZ CSC and Richard Treadgold have published a piece of incompetent research and are either too ignorant to notice or are deliberately attempting to mislead the press and public. They have pushed it to the media and the more credulous blogs, and attempted to smear a respected scientist.
This is disgusting behaviour, a sad travesty of the science that Dunleavy, Leyland, McShane, Gray and their “scientific advisor” Chris De Freitas so loudly claim to hold dear. What’s worse is that De Freitas, at the very least complicit in this arrogantly erroneous document, claims to be a respectable scientist. It’s hard to imagine a more blatant academic faux pas…
None of these cranks should be accorded any respect in future. By their words shall we know them, and their words show them to be ignorant, bullying fools. De Freitas should withdraw and apologise, or resign from his post at Auckland University, and if Treadgold, Dunleavy, McShane, Leyland,or any other member of the NZ CSC want to partake in public debate on the subject of climate science, they should expect derision to be heaped on them and their views.
[Update: NIWA’s official response is here, and their page describing the Wellington corrections here.]
[Update 2: Added date Mullan’s graphs were first prepared, altered “at least two years” to three.]
[Update 3: Paul Gorman reports in The Press.]
[Update 4: NIWA release more info 2/12.]
Thanks, Gareth – NZC”S”C revealed yet again to be idealogues and propagandists with little knowledge of either climate or science; mere shills for the fossil fuel industry who fund them through the Heartland Institute.
par for the course… I expect that there will be many more ‘reports’ such as this put out in the next couple of weeks as the world’s media gears up for Copenhagen.
“Such site differences are significant and must be accounted for when analysing long-term changes in temperature. The Climate Science Coalition has not done this.
NIWA climate scientists have previously explained to members of the Coalition why such corrections must be made. NIWA’s Chief Climate Scientist, Dr David Wratt, says he’s very disappointed that the Coalition continue to ignore such advice and therefore to present misleading analyses.
NIWA scientists are committed to providing robust information to help all New Zealanders make good decisions.”
I like their response!
Hey Gareth why do you have the red line on the graph spiking upwards in the last year? It’s not in the green line (the raw data) and there’s no reason that justifies that adjustment.
Could it be you’re trying a little slight of hand?
Nope. The airport data runs a year longer in the graph, that’s all.
Yeah, I’m sure it does. What year is that extra year on the red line?
Also you mention the following in your article:
“…And it’s a lie because the NZ CSC has known for at least three years why adjustments have been made to certain stations. …”
Can you please be specific and let us know what stations needed adjustments and what were the reasons. Leaving it vague as you did, lends one to mistrust the messenger.
Gareth,
It’s been three days that I’ve asked you for that info. Is it safe to say that you’re looking for it or are you ignoring my post?
I’ll repeat the question. Can you please specify what stations needed adjustments and what exactly were the reasons?
It can’t really be that difficult to find if you claim that the NZ CSC were in possession of that info for three years.
Sal, if you want that info, you can do what Treadgold should have done: download all the station data, read through the metadata, dig up the relevant papers and reconstruct the data series.
What was the reason for the Hokitika adjustment?
Can you not read? A site move.
It seems Dr Wratt became angry quite quickly. Too quickly?
WRATT: “Basically it’s not up to us to justify ourselves to a whole lot of people that come out with truly unfounded allegations.”
Dr Wratt, you created an inconsistency between the data and the graph, on your web site. We’ve just noticed it and now we’re asking how it happened. Any “allegations” were inferred by you and not implied by us.
WRATT: “We work through the scientific process, we publish stuff through the literature, that’s the way that we deal with this stuff and I can’t have my staff running around in circles over something which is not a justified allegation.”
Oh, so there have been scientific studies done on these station adjustments? We’d like to see the papers. Would you kindly provide references, please? But there’s no need to be getting yourself upset! We agree you shouldn’t “run around in circles” over unjustified allegations. On the other hand, we have a different opinion of your proper response to questions.
WRATT: “I’ve told you we’ll put out information about Wellington.”
Look, we’ve been talking amongst ourselves, and we’ve decided that Hokitika might make a more interesting case than Wellington. We’d like to know why such large adjustments were made, since nothing even slightly interesting has happened there in the last 15,000 years. So if you’re going to put out figures, would you please give the adjustments and reasoning for Hokitika instead? Yes, that would be far more useful, thanks.
My goodness, this could go on for ages. We need more popcorn.
There’s more on http://www.climateconversation.wordshine.co.nz
Thanks for your support.
Richard Treadgold,
Convenor,
Climate Conversation Group.
If Richard wants to come here and defend his dog of a report, let him do so. You do yourself no favours by pasting his words here.
Great response….. so Hokitika?
(my mind is not made up either way, but I want to see more than just the Wellington explanation before I am convinced of the NIWA side)
Did you not see my response above? A station move. If you really want to know precisely what move, I can try and find out, but it will only prove that Treadgold couldn’t be bothered to do even minimal due diligence in his “research”.
yeah, wondering how the quantum was calculated
The Hokitika station moved at least three times. I’m told that, as with Wellington, there were data overlaps that allowed scaling, but the quanta I don’t have (they were done long before the days of computers on every desktop, so not easy to access).
Maybe R2 *is* Richard Treadgold?
“Any “allegations†were inferred by you and not implied by us.”
eh? Alzheimers already?
“NZ climate scandal: NIWA “adjusts†records to show warming…”
“…temperature readings from seven weather stations throughout New Zealand have been adjusted to show a higher degree of warming than is justified by a study of the original raw data.”
… NIWA has adjusted the earliest temperature readings downwards by up to 1.3°C, which has the effect of introducing a false ‘warming’ as the graph then ‘climbs’ to the present day. It’s a disgrace.
Trouble is, the average joe reading a release like this from Treadgold, won’t think past “scandal”. I do hope that Gareth’s evisceration of it does the rounds as well.
Stupid NZ glaciers. Don’t they realize they’ve been conned?.
NZC”S”C don’t have to make sense; their instructions will simply be to say or do anything that helps create the illusion of an “ongoing debate” prior to Copenhagen.
As with the Tobacco Papers, we can but hope that, one day, all this will be laid out to view as a result of anti-racketeering action against their US sponsors.
I love how in the space of a week you have turned evidence of racketeering amongst alarmists into suggested racketeering by sceptics. Orwell would be proud 🙂
Surely you are not following Roger and Mikh and only reading denialist crap on the CRU leaks? I thought better of you. Followed any of the scientists responses – context and explanation? Gavin Schmidt in particular has been provided a lot in information. I dont think Gareth is accusing anyone of racketeering but he is certainly accusing them (correctly) of publishing MISINFORMATION about NIWA when they had been made aware of why there were corrections. Anywhere in Treadgold statement is there a suggestion that he knew the reasons for the adjustments? Yet Niwa had told him.
Now tell me is there a headline over at WUWT saying whoops, Sallanger exonerated as following standard meteorological practise in correcting temperature records for station move?
Obviously R2 doesn’t know or remember the “Climate coalition” back in the nineties. Originators of many of the denier canards.
http://en.wikipedia.org/wiki/Global_Climate_Coalition
Dear R2D2
Some direct question for you, which requires a yes/no answer;
1; Do you think the correct, NIWA data above represents a sufficiently accurate picture of NZ temperatures to show a warming trend?
2: Given that Treadgold et al appear to have been previously made aware of the reasons for the temperature adjustments, do you think that they are wilfully causing trouble? If no, why did they do this?
Thanks.
1. Neither the NIWA or NZCSC is entirely accurate. The only pure temperature record is the constant Kelburn record. This shows a runs from the mid 20s and shows no warming. AGW suupsedly kicked in post 70’s so to explain the effect of AGW on NZ you shouldn’t need to use the other data set.
If you did use the other data set you shouldn’t presume that because the airport is the same altitude it will have the same temp. Firstly it is a large concrete area. Plus there are many other factors that could play a part.
2. Yes. As I have said, both sides are not entirely accurate in their description of the facts it appears. I will make my mind up as the facts turn up. I am not ignorant of the fact that the NZCSC have bad blood with NIWA, however I don’t think they are on the payroll of Exxon.
In the mean time I don’t think you should forget about the emails that came out last week before accusing sceptics of collusion.
The best way to solve this issue is to look at some proxies of New Zealand temperature. Did Sallanger do a Waitomo stalactite study? I have never been able to find a copy. That would be better for us to look at then any of these as they will never be perfect. Even if the temperature station stays in the same place, Wellington changes.
R2D2 – the stalagmite data is well published – I would not expect Sallanger to do such a study since he would be way outside his field. These proxies have issues of their own and are vastly imperfect compared to instrument record. And single station measurements are not a good way to estimate a regional effect – when the data exists you should use it.
This CSC tripe was first circulated in the days of the late Auer at CSC, and they continue to do it despite repeated explanations from NIWA. These people are beyond contempt.
R2D2, you know absolutely nothing about Wellington local climatology. If you are trying to imply that Wellington Airport exaggerates altitudinal differences between sea level sites and Kelburn, you are dead wrong. Networks of observing sites set up in Wellington show that is perfectly reasonable, if not a little conservative.
NO warming at Kelburn? What absolute crap. I have monthly and annual graphs for the Kelburn series (in fact all the daily data), and if I could post it here it would give the lie to you anti-GW morons.
The size of the “corrections” are remarkable for being so large, and apparently in one direction. If we had a similar change on the Northern California coast – a station at a higher altitude replacing one near the coast – we would have to increase the temperatures in the old records to be comparable, since the higher altitude is further away from the cooling effects of the ocean. As with the explanations for the Climate Research Unit e-mails by RealClimate and others, there are now more questions than answers.
What an inane and irrelevant comment. Message to majormike: NZ is not northern California. Try learning some NZ climatology before fully demonstrating your total lack of understanding of the situation.
Thanks R2D2
The only pure temperature record is the constant Kelburn record. This shows a runs from the mid 20s and shows no warming. AGW suupsedly kicked in post 70’s so to explain the effect of AGW on NZ you shouldn’t need to use the other data set.
This is interesting to me.
Assuming the Kelburn data is internally consistent (I don’t know – I presume someone here does), why do you say it doesn’t show a warming trend?
Eyeballing it (yeah yeah…), to me it does seem to be trending upwards. Perhaps someone with more skills/software than I can do a trend analysis? Or has already done so?
edit;
Ooops – just read RW’s comment. Can someone show/point me towards solid analysis of this to settle the issue please?
Thanks.
If you are prepared to use the feedback form on my website (rupertwood.co.nz) and provide your email address I can send some simple graphs – but I will not eneter into any debates, as I am not interested in wheel reinvention.
Fair enough. Will do. Thanks.
RW
Obviously you Kiwis are different, and you apparently have your own physical laws that counter the Pacific’s cooling and higher temperatures as you move away from the ocean. Also you apparently only have to correct in one direction, and your corrections have to be quite large. In California we often find our corrections should reduce recent temperature records to compensate for the effect of urban heat islands. Unlike you, we don’t correct the records, thereby giving us warming where there isn’t. You do make the corrections, and get historical cooling where there probably was none.
One similarity you do share with many in the UK and the United States is discomfort with having your position on climate change questioned. I thought the essence of science was “wheel improvement,” but now I see that the science of the wheel is unquestionable and settled.
mm, Wellington is at the southern,and very slender,tip of the North Island of NZ. It is essentially an oceanic site. It lies at windy latitudes;a lot of air gets moved over the measurement sites. If you move east away from the ocean,you very soon arrive at the ocean again! So your argument is based on ignorance of this particular site. Your second and third sentences seem to be contradictory,as well. Do you ‘correct’ or not?
As opposed to california which is west of a big hot desert…
Note the sly smear by association: “Dr Jim Salinger, who features also in the emails leaked from the Climatic Research Unit of the University of East Anglia”
Jim Salinger has collaborated with people at East Anglia, so it’s not surprising he’s mentioned in their emails. But (forgive my ignorance) has anyone suggested there’s anything in those emails that discredits him? If so, I haven’t heard about it.
Majormike, do you have any idea where New Zealand is? No, its not attached to Australia by the Sydney Harbour bridge… try looking east and south…
Yes, we are those small islands set in a vast ocean and, unlike California and Australia, we are not an urbanised coastal fringe of land that is mostly desert.
Now find a relief map of Wellington, note the latitude and have a little think about what the effect of Cook Strait might be on the prevailing winds…
Rob Taylor
In my Air Force years I was at Christchurch for Operation Deep Freeze – the annual resupply of McMurdo Station, Antarctica. Have you been to Gualala, California? It’s on the coast north of San Francisco. Except for the towering redwoods, it reminds me a bit of New Zealand. We still have more sheep than people.
The correction applied in Wellington is looks awfully close to the simple enviromental lapse rate for difference in altitude (which would be 0.79 by my calculation). If you dont make corrections of about that order when moving a station, then you arent doing it right. You would have to argue some special physics to get a UHI effect at Kelburn! Check out its wind record.
Whoops should have read the article more closely – 0.79 IS the correction applied. The simple lapse rate adjustment.
And, importantly, they didn’t just make a correction based on theory, they calibrated against a known record to make sure.
Here’s the press release I would have liked to seen from NIWA.
What R2D2 and the NZCC are really doing is harrassment – pure and simple. The press release was slanderous and they should be sued. These questions have been asked and answered before. They simply will never believe the answers given. They have a position on the issue and they will never change that postion regardless of the evidence provided. They are no more climate scientist than the rear end of a horse. It would be nice to think they were just thick as Pig S**t, but essentially they are captive to a manifestly demonic agenda.
In particular, with headlines like this: ‘BREAKING: NZ’s NIWA accused of CRU-style temperature faking’ on Ian Wishart’s blog, I would really, really like to see NIWA take out a lawsuit against Wishart. And win.
David Wratt has been extraordinarily patient and professional in answering Wishart’s questions, but he’s clearly getting tired of what can only be described as harrassment and bullying.
The first lawsuit looks like featuring ‘Piltdown’ Mann, or one of his fellow data fiddlers, as the defendant! I gave you the URL but guess who deleted it.
And if he wins any lawsuit what then of your NIWA reputation ?
For a very similar scam in the US (plus some light relief), here’s the “Climate Denial Crock of the Week” video that a prominent denier tried to censor on You Tube.
http://www.desmogblog.com/directory/vocabulary/4386
Just in case anyone missed it, there’s a promise at the end of the Treadgold/NZ CSC “report” of comedy gold in store:
Chortle.
Regardless of which NZ record is used, temperatures are undershooting the catastrophist predictions made in 1988.
http://www.youtube.com/watch?v=3Bbs7_qM_I4
And please get over this being my YT vid. The predictions are there in the MFE report.
So, Steve, are you defending Treadgold’s crass incompetence? Do you think the NZ CSC’s smear tactics are to be encouraged?
Um, I dont get Steve. The 1988 prediction would be Hansen et al.?
The paper does 3 scenarios. The forcings we actually got are closest to scenario B (about 10% below). The predicted temperatures for scenario B fit pretty well with what we actually got too. (eg fig 2, http://pubs.giss.nasa.gov/docs/2006/2006_Hansen_etal_1.pdf)
Not bad for a model as primitive as the ones used in 1988. A long was from perfect either as has been discussed in the literature.
Hansen’s 1988 predictions are global averages. NZ is in the middle of the southern Pacific ocean. The climate models indicate that NZ will have lower and slower warming than much of the rest of the world, which is obvious given the thermal effect of all that water on our local climate.
I think the earlier commentator is being either disingenious or ignorant, I am not sure which.
Really, Steve, 1988?
Just as well the Kyoto Protocol came in, then, or we’d be in even more trouble than we are…
MajorMike, your continued wittering establishes you as a total Meteorological Moron – you haven’t he faintest idea about NZ’s climatology – Kelburn does not suffer in the faintest degree from UHI, and the area is very windy. And by the way, genius, I live in the area, but am also very familiar with the the temperature effects around San Francisco. You should stop digging.
I am saying that even if the official NIWA record is used, it is conclusive disproof of the ’80s catastrophist predictions. So why should we believe the latest catastrophist predictions when the modellers admit ” we can not account for what is happening in the climate system …It is a travesty!” (Trenberth) ?
Newsflash to RT: The so-called “pollutant” GHGs have continued to build up (as many on this site are fond of pointing out). So, “…there should be even more warming: but the data are surely wrong…” (Trenberth again)
So, Steve, are you defending Treadgold’s crass incompetence? Do you think the NZ CSC’s smear tactics are to be encouraged?
SW – again, I dont see those 1988 predictions being wrong. If you mean, we didnt get scenario A forcings, well they are not a prediction. The prediction is what you will get if you had scenario A forcings. We cant changes solar and volcano but the other forcings are pretty much up to mankind.
As for your attempts to spin Trenberth, unsurprisingly, the context for those remarks is now well commented on by those concerned. Havent you looked? – or are you just hoping readers here havent looked?
Hint:
http://www.cgd.ucar.edu/cas/Trenberth/trenberth.papers/EnergyDiagnostics09final.pdf
“I would really, really like to see NIWA take out a lawsuit against Wishart. And win….”
Carol, you are expressing my sentiments exactly. This is certainly actionable, and if Dr Salinger takes this to court it would dispel the heat and produce the truth. Conversely, a reluctance to seel legal redress would speak volumes too.
If ever there is a journalist who can sense the dividing line between what is actionable and what is not it is Wishart as his destruction of Helen Clark demonstrates.
“I would really, really like to see NIWA take out a lawsuit against Wishart. And win….â€
I don’t think this’ll happen…. if IW only said ‘accused of’… then I doubt it’d be considered slander/libelous.
Well, I don’t think so. I think the implication is very clear indeed. And of course there’s this from today’s NZH…
Not mentioning Dr S., but very straightforward…
http://www.nzherald.co.nz/environment/news/article.cfm?c_id=39&objectid=10611930
So again we see the damage of people who only see the side of the story they want to. Do you suppose Hopkins is going to look for the truth either.
Hey mikh – since you think WUFT is so much the purveyor of truth, then we see the libel about NIWA and yet .. complete silence when refuted… like just about every “story” there is over there. If you only look at WUFT and never look at refutations, then you get a pretty warped view of reality.
And yes, I would like to see NIWA sue – there has to be cost to slander.
The opportunity for a rethink on legal action will probably come with the issue of Investigate next month. I am looking forward to it, as I’m sure you are too.
The words fraud and lies have been used frequently as I’m sure you’re aware, and careers are being ruined.
“Investigate”. Ye gods.
Mikh, when you have conflicting stories from different sources, what process do you use to evaluate the relative trustworthiness of those sources?
Scaddenp: When your emperors have been caught pants-down, wobbly-bits-flying-everywhere, chased-by-the-batsman, bollocking-starkers, you’ll have to come up with something better than random links to their work (which neatly show how sea-level rise isn’t accelerating).
Gareth, I don’t accept the premise of your loaded question. The point is that even the NIWA climate record that is being disputed denies catastrophism.
“caught pants-down, wobbly-bits-flying-everywhere, chased-by-the-batsman, bollocking-starkers,”
Only in your delusions is this true because you havent bothered to look an alternative view and prefer you dreams instead. It would appear you havent even read comments here and continuing with your straw men punching.
Definitely not a climate specialist so please be gentle!
If I follow correctly the skeptics are treating the blue and green lines as if they were from the same station. NIWA is saying that is wrong because they were from different locations and I agree.
But then to say we can work out what the correction should be, because we have another record that comes from a 3rd location at the same altitude is also wrong. Red – Green = Blue – Green implies Red=Blue. Wouldn’t you expect significant heat island effects from an airport?
JaMike – as noted the correction would appear to match simple lapse rate. That would be the default in absence of other data.
Heat island affect at Wellington airport? You must be joking! The air has to be some time over heating surfaces to gain any extra warmth. Air at the airport (you know where the station actually is at the airport?) is mostly moving a bit to quickly for that. Note the brooklyn windmill set world record for generation availability at over 90% – and shutdown were mostly for excessive wind not absence of it.
Chalk up another one who hasn’t a clue about Wellington climatology.
Never claimed I had a clue about Wellington climatology. Just asking politely 🙂
No worries then “other” Mike
Its also worth remembering (as scaddenp has refered to) that it is well known that temperatures decrease at a certain rate as altitude increases. AFAIK the comparison between the Airport temp and Kelburn is exactly what you would expect to see with the altitude difference between them. Which means the correction is supported by both the observed and theoretical values, so it sounds pretty reasonably to me.
What a shame Dr Augie Auer was so suddenly taken from us.
http://www.scoop.co.nz/stories/SC0704/S00001.htm
Call for NIWA to be disbanded
Sunday, 1 April 2007, 3:14 pm
The biggest shame is that he allowed himself to be associated with the disingenuous tripe that the CSC has produced concerning the NZ climate record.
On the ball, he was too.
One place to look for details about NZ station adjustments is here, if anyone has journal access. Quite a bit of detail about how it’s done.
[Fixed your link – stuck in spam queue. GR]
What a shame Dr Augie Auer was so suddenly taken from us.
Yep:
NIWA climate scientists have previously explained to members of the Coalition why such corrections must be made.
Auer could’ve done a really good job of forgetting what NIWA told the CSC ages ago, yes. Maybe even a better job.
Some observations on this absorbing issue from just another nonentity.
Discard all stations subject to UHI.
Select one remote and stable North Island station well away from UHI influence and same for one in South Island. Ignore all other stations thus avoiding the whole adjustment and data overload debacle.
Better still, ignore air temperature altogether (low thermal inertia). Use land-mass and ocean heat content instead (high thermal inertia, stable and only one temperature cycle annually of any significance).
This would restore credibility not just in New Zealand but in other countries that are embroiled in this issue.
Very pragamatic… indeed that is the implied goal of sites such as wuwt and ca – to discard all records with any shadow of doubt. The next step is to systematically go through and cast aspersions on each record so that it can be ‘cast out’. The eventual goal is to get to the point (already stated) of saying “we don’t know if temperature is rising or not – probably was hotter in the MWP anyway. So no problems mate, keep burning that carbon”.
So perhaps not that pragmatic a solution… The fact is that all the various types of temperature / climate records ARE being used as far as is practical (remembering that they were all collected for a variety of reasons so all suffer various “issues”). The evidence for AGW comes because each of those different ways of measuring temperature/climate comes up with a result – warming over the last century – that is consistent with the AGW hypothesis. There is no need to “restore credibility” – the credibility comes from the breadth of agreement between all the different ways of looking at long-term climate change, despite any “noise” in individual records.
Billy T. November 27, 2009 at 5:06 pm
There are two sets of graphs under discussion: NZ Average Temperature (NZAT) and Wellington Temperature (WT).
NZAT cobbles together data from seven selected sites to obtain the average so it follows that sites can be selected and deleted according to suitability. The usefulness of the average is as a general guide, but to ascribe accuracy is specious. Where is this average sited? Over the Cook Strait? Over the Southern Alps? Over Auckland City? The graph has been given credence by the argument over it, but exact science – I don’t think so, more like Accounting. Personally I am comfortable with adjustments when I know how and why they are applied and I am also at ease with the warming and cooling trends exhibited in the air over each site. Remember, NIWA can equally say:
“Cooling over Dunedin through the last century, is unequivocal”
Let’s think about the air “over” New Zealand. Because NZ is so small, the air-mass has gained heat from a source somewhere off-shore and is moving to a cold place somewhere else off-shore. So the air “over” NZ is air in transit – part of a chaotic system. The sites included in the average “over” NZ should be those that best typify temperature “over” the land-mass. As mentioned up-thread, WT is more an ocean site than a land site and so it is not typical no matter what the integrity of the data. WT is more relevant to the local phenomena of air being funneled between two land masses as alluded to up-thread.
Your scope of reference so far is limited to climate so perhaps a medical analogy is appropriate if the planet is indeed sick. Nurse 1 takes the patients temperature under the tongue (ocean surface), Nurse 2 measures under the armpit (land surface), Nurse 3 has the unpleasant task of taking core temperature (you know where). Your conclusions as to the patients health are based on Nurse 4 (Climatologist) taking air temperature “over” various parts of the patients anatomy and in case of WT with the air conditioning fan set on High.
You did somehow make a “warming over last century”, “AGW hypothesis” connection so I will assume it is based on the IPCC statement: “Greenhouse gas forcing has very likely caused most of the observed global warming over the last 50 yearsâ€. The IPCC are not 100% sure so I wonder what is your standpoint? I have gone in search of those who are sure in the IPCC review and have found that 62 scientists reviewed the relevant chapter but have been unable so far to identify those that actually endorsed the statement. Is there a link to those that did? It is certainly not the “2500 scientists” that we hear from time to time.
No, you can’t say Dunedin’s been cooling over the last 100 years, because it hasn’t. The station adjustments reduced the trend, but it still shows significant warming.
There’s a difference between being 100% sure that more CO2 will cause warming (that’s straightforward physics) to saying that “most” of the warming seen is due to CO2 – that’s because more things than CO2 affect the climate.
Gareth November 28, 2009 at 6:49 pm
CO2 is only one of the greenhouse gases, the others covered by NZ ETS are: methane (CH4), nitrous oxide (N2O), hydrofluorocarbons (HFCs), perfleurocarbons (PFCs) and sulphur hexaflouride (SF6) . IPCC lists a few extra so I’m not sure why you are commenting in terms of CO2.
IPCC: “Greenhouse gas forcing has very likely caused most of the observed global warming over the last 50 yearsâ€
Certainly agree that “more things than CO2 affect the climate”; the sun springs to mind, without that we would not be having this discussion.
I retract “and cooling” and “Remember, NIWA can equally say:
“Cooling over Dunedin through the last century, is unequivocal†in the first paragraph.
I read the NZ CSC press release (which to me was misleading at best but it did lead to better understanding of the methodology) and the negative adjustment at Dunedin stuck in my mind. That was remembered as negative slope in the comment – sincere apologies.
When one is dealing with propaganda (on both sides), the fact/fiction regulator gets a little tired.
Fascinating to see Ed Begley, Jr losing control over climategate – the “Game-Changer” in fight over global warming.
http://bighollywood.breitbart.com/bighollywood/2009/11/24/ed-begley-jr-loses-it-on-fox-news/#more-268302
Judging by the note at the bottom of this 2006 NIWA PR the C”S”C will have had the raw data for rather a while. In fact here’s them in 2007 welcoming the public release of data.
[try Scoop Search for more]
lol! Love your work Lyndon. You can satire with the truth.
As James Delingpole writes:
“AGW is about raising taxes; increasing state control; about a few canny hucksters who’ve leapt on the bandwagon fleecing us rotten with their taxpayer subsidised windfarms and their carbon-trading; about the sour, anti-capitalist impulses of sandal-wearing vegans and lapsed Communists who loathe the idea of freedom and a functioning market economy.”
And the bloogers at this sight still consider Sceptics to be freaks when the MSM (not in NZ) are waking up to the fact that sceptics, in the main, are normal human beings
Sally, why do you think that most of the western world has opted for a market-based solution to reducing CO2 (ETS) rather than a carbon tax system?
AGW aka climate change is about the science. The scientific advice for the last 20-odd years has been that in order to avoid ever-worsening climate change world’s economy has to be migrated to a non fossil fuel based energy source. Whether that is done by government direction or market forces has no bearing on the science – physics doesn’t care about politics.
The political response to that threat has actually been to try and avoid doing anything for as long as possible. Now the politicians are panicking and trying to push the costs of changing as far into the future as they think they can get away with.
Answer – Group-think and expediency (excuse-me Sally).
In case of NZ’s ETS has the rather odd stimuli of giving the largest polluters license to pollute.
You say: “The scientific advice for the last 20-odd years has been that in order to avoid ever-worsening climate change world’s economy has to be migrated to a non fossil fuel based energy source.”
Western Cap n Trade ignores a bunch of elephants in the room. Most notable is the worlds 100,000 strong shipping fleet. Story here: http://www.dailymail.co.uk/sciencetech/article-1229857/How-16-ships-create-pollution-cars-world.html
Also leaves out the Airline fleet. I realize that there is the odd nod in that direction but how will these sectors be “migrated to a non fossil fuel based energy source” and how long will it take?
Next elephant is this paradox: top of the list of polluters is non-western land of the rising coal-fired power station – China. To give them credit they are de-commissioning dirty stations but the roll-out of new stations one every 10 days or so marches on. Plans are for hundreds in addition for the hundreds already on-line. NZ by comparison has …umm… one! Of course there’s also the little matter of their major external coal suppliers, Vietnam and Australia.
I could go on but I fear being trampled.
The yawning gap between scary future scenario and solution is that NZ soccer-mum polluter somehow has to make up for mega non-ETS polluter. And this is assuming man is the culprit for GW. As the events of the last week have revealed, the science of that is anything but settled.
For real scary future scenarios I recommend Bible Eschatology. Hint: start with Seals, move on to Trumpets then Reverse Big-Bang at the end (reverse Big-Bang is the sudden release of all electro-chemical molecular bonds so that the whole caboodle falls apart – and you thought climate change was scary).
pragmatist: it sounds like on the substantive issues – the need for major reductions in CO2 – that we are in agreement. In fact, I am not saying anywhere that the ETS is the best solution. Sally was making some nonsensical argument that AGW is all about raising taxes and imposing state control. The whole point of a cap and trade system is that it an attempt to let the market decide where the required CO2 reductions can be best made.
As you say, NZ’s scheme is perverse in that it does not include a cap – indeed, the more industry emits (providing they’re better than “average”) the more credits they get. That is nothing to do with the scientists.
Indeed, all the ‘elephants’ you highlight are faults of the political system and its inability to work out an adequate solution for a problem with long-term effects. Politicians (and humans in general) are good at dealing with crises and finding responses to “solve” them, but demonstrably bad at dealing with issues whose worst effects won’t happen for years in the future. Just look at the financial crisis, anti-terrorism before and after 2001, America before/after Pearl harbor, NZ superannuation, … the list goes on. If a difficult issue can be pushed into the future or fudged with some half-baked solution that imposes no immediate pain, then that’s what generally happens.
I don’t think there are any easy answers especially with regard to the international relations side of this – if it is going to “work”, every country has to do its bit (China included), or the whole attempt is going to disintegrate – either into disarray or into conflict.
Climate change deniers are modern-day King Canutes, commanding the seas not to rise and the ice not to melt!
Personally, I put my faith in the young, as they have the most to lose – it’s time they got angry at the theft of their future by we oldies clinging to the baubles of our profligate lifestyles.
My children (11 and 15 years) will see NZ transformed within their lifetimes, but in which direction?
Rob Taylor November 27, 2009 at 6:34 pm
I don’t think you will find many climate change deniers but you will find a great many people that question the notion that man is the prime cause of the present observable change of state and of those a great number will happily concede that man has some influence but to what degree? And which man is the culprit? NZ man? Early Industrial man? Industrial Juggernaut China man? It might be time for some perspective in the emissions scheme of things. See here: http://en.wikipedia.org/wiki/List_of_countries_by_carbon_dioxide_emissions
Lets not delude ourselves that there is anything altruistic about NZ’s ETS – that is about selling our products into Europe.
Interesting that there is an assemblage of King Canutes at CHOGM currently debating ways to command “the seas not to rise” and the “ice not to melt”.
To which sea level rise are you alluding to? measurable MSL or the ENSO and Storm Surge effects that are so often sensationalized on the telly? This NZ paper: ” Sea-level change and storm surges in the context of climate change” is available here:
http://www.ipenz.org.nz/ipenz/publications/transactions/Transactions2000/General/1bell.pdf
In it, Bell, Goring and de Lange compare global sea level ( rising at a rate of +1.8 mm yr with a range of uncertainty of 1–2.5 mm yr) to NZ experience (“almost static trend in MSL at Auckland and Moturiki over the last 25 years (1973–98), as a result of the unusually persistent ENSO behaviour, completely masks the ongoing global rise in sea level. The next few
years should see another climate regime shift to another
“cool†phase (17), which would cause regional sea levels
to rise more rapidly, similar to the 1950s. This confounding
behaviour of interdecadal variability in sea level and
its complex link with ENSO effects (including sea-surface
temperature) highlights the problem in attempting to
isolate any rise in sea level, due to climate change, over
even medium-term periods of 20–30 years. It also clearly
demonstrates the need to better understand very low frequency
variability in sea levels around New Zealand, and
their response to climatic variability, in order to place regional
sea-level trends into a global context.”). I would be interested to know your views re sea level rise at Derby WA (max tide 11.8m), Bay of Fundy, Nova Scotia (max tide 15m) and Mediterranean (max tide 2-3 cm).
In view of the number of glaciated valleys in Fiordland NZ sans ice, do you think that the ice melt and sea level rise is A. man-made or B. some other cause. If your answer is B. would you care to elaborate? Could it be that the present ice melt is due to, as Bell, Goring and de Lange put it “With respect to the past century, the 10–25 cm rise in global mean sea level has been due largely to a concurrent increase in global temperature since the end of the Little Ice Age, forced mainly by changes in solar input and a small warming effect due to ozone depletion in the stratosphere (6). The possible climate-related factors contributing to this rise include thermal expansion of the ocean and melting of glaciers, small ice caps and to a lesser extent,
the large Greenland and Antarctic ice sheets (2). By
thickening the Earth’s atmosphere and trapping heat at
the surface, “greenhouse†gases have helped melt large
tracts of ice caps and alpine glaciers, especially in the
Himalayan Mountains where glaciers are retreating by 30
m per year (19). Changes in surface water and groundwater
storage may also have affected sea level, e.g. reduction in
wetlands and groundwater extraction.”
Footnote to November 29, 2009 at 10:45 am
The IPCC soo7 report re Himalayan glacial melt and Pearce F. (ref 19) has since been disputed by this report by senior glaciologist Vijay Kumar Raina: “Himalayan Glaciers: A State-of-Art Review of Glacial Studies, Glacial Retreat and Climate Change”
Story here: http://www.dawn.com/wps/wcm/connect/dawn-content-library/dawn/news/sci-tech/16-the-glacier-controversy-hs-09
Pragmatist, I note that the IPCC chairman Rajendra Pachauri has dismissed the report you quote above as “schoolboy science”.
I expect that he knows somewhat more about the state of Indian glaciers than either you or I…
http://www.waterconserve.org/shared/reader/welcome.aspx?linkid=141991
Not necessarily.
Here’s his profile: http://en.wikipedia.org/wiki/Rajendra_K._Pachauri
He is an Economist and Mechanical/Electrical Engineer who began his career with the Diesel Locomotive Works in Varanasi. No Cimatology or Glaciology specialization but has earned a living from fossil fuel burning monsters .
Incidentally, top of the list of the “2500 scientists” and IPCC ar4 Authors is one Lenny BERNSTEIN Bernstein & Associates, L.L.C. USA, …..a Lawyer.
Our train driver!!!!!!!!!!!!
This thread is the worst debate I have seen on this site.
73 comments and I still don’t know what to think about this article.
– I can see that the Wellington record was adjusted for genuine reasons, and not as part of a conspiracy as implied by NZCSC.
– However there are problems with the crude way in which it was done
– But the biggest questions, why were the others done? were they all as close to reality as possible?, has still not been answered
The comments have just degenerated into name calling BS
You could try thinking for yourself… 😉
Good.
Why? Theory suggests an offset of 0.8ºC. Site calibration reveals an offset of the same. Robust, I would have thought.
You asked about Hokitika. I gave you the answer. The same sort of thing is true for all the other sites. Over 150 years, you will not find any single station where they haven’t even changed the thermometer, for example.
Many of the station adjustments have been published, but back in the days of paper and filing cabinets. Just digging out the references takes time.
But the crucial point — which those professing uncertainty want to ignore – is that this sort of stuff is routine. That you’ve never come across it before, or don’t understand it, doesn’t mean that other people don’t. To think otherwise is to impose a tyranny of ignorance.
Gareth,
So you are suggesting I should just accept that the adjustments were done right and not want to transparent a transparent explanation for the adjustment?
On points 1 and 3.
1)73 comments ant the discussion has gone nowhere
3) fair but crude way it was done. There is no better adjustment possible, but it is impossible to no if the adjustment is accurate.
On 3: check out fragment’s link at #65 above. There are lots of ways to do it to improve the end result, including using a “basket” of local stations. Of course, “perfect” knowledge is not possible, but useful data is.
On 1: When did you ever expect anything sensible in a long thread when people like Wrathall turn up and do their best to derail the discussion? Especially when the usual suspects are frothing at the mouth and claiming scandals and cover-ups.
Re “transparent explanations”. The request is, prima facie, reasonable, but the delivery of the answer is not. Consider this case. I suffer from Menieres Disease. I see a specialist. He provides me with the best of his knowledge (which is extensive on the subject) and treatment (which for Menieres is limited). I also Google stuff. This means that I have some knowledge when I go to see him, but it does not provide me with the context – the deep knowledge of the literature, of the others working in the field, of the latest treatment ideas. I’m sure that if I asked him for the references on sodium pathways in cellular membranes he’d let me have them, but really, I don’t need to go there. So, yes, I take his word for it.
In the case of the NZ temp series, people like Jim Salinger have spent their entire working lives doing this stuff. They have international reputations and awards. So, yes, when it gets down to the nitty gritty, I bow to superior knowledge.
Not least because I think Jim would be a piss-poor conspirator. Far too keen to talk… 😉
When I used to travel on the train with Jim to and from the Hutt Valley in the late 1970’s and early 80’s he had his own meterological station at home and used to write up regularly in the local paper a very informative weather report! They were enjoyable train trips – the discussions were wide and varied.
How many meters in altitude did the Wellington stn gain, and what are the precise records of the other stations? Are they available on the web?
And for that matter the Hokitika stn? How far inland? With what sort of ountryside between it and the ocean as the prevailing winds go?
Gareth, before you dig yourself in any deeper, you ought to read this http://wattsupwiththat.com/2009/11/27/more-on-the-niwa-new-zealand-data-adjustment-story/
They’re the ones doing the digging. If they think Wishart has more credibility than David Wratt, Jim Salinger and NIWA, then that says a great deal more about them than it does about the Wellington record.
tdperk, in 1928 the measurement site was moved from Thorndon (3 metres above sea level) to Kelburn (125 m above sea level). The Kelburn site is on average 0.8°C cooler than Thorndon, because of the extra height above sea level. !!
tdperk – its stated in the article! How can you not read it, and yes, in Treadgold’s original article it tells you where to go to get all the climate data. Station location is stated to – just consult a map to place it.
R2D2 – yes, of course I would accept that the experts have adjusted the climate stations when change occur according to best possible practice. Why would I not. Methods come under scrutiny usually when there is a discrepancy between two lines of evidence. The “scrutiny” is about wishful thinking over reality. The temperature record is in accord with world surface record, with satellite record and with long term phenomenological data (eg glaciers). If it wasnt, then would be looking for explanation.
You can see what is going to happen now – Hokitika gets examined. Okay, then what about x then, and on it goes. Get a 100 FOI requests and you get meltdowns like Jones’ rant… a whole long time-wasting process for the sake of people who arent going to accept the outcome anyway – but whose purpose is to raise doubt in the mind of public.
Unless Wratt is lying (which I strongly doubt), Treadgold had been told by NIWA the reasons for the corrections but persisted with this anyway without any hint of such knowledge. What do you make of that?
This whole thing shows why it is better to use constant proxy when studying climate change in a historical context than temperature records that are disjointed over time.
That is why the IPCC and others should use proxies rather than ‘reconstructions’. This study’s (below) proxy data shows nothing extraordinary, but then the author splices a temperature reconstruction on the end, does ‘Mike’s nature trick’ of removing the last 20 years of proxy data to ‘hide the decline’, or the divergence between the proxy and the temperature reconstruction that we now know is there thanks to leaked emails, and then claims extraordinary warming.
Jones & Mann:
http://www.meteo.psu.edu/~mann/shared/articles/mannjones03.pdf
Only the last 20 years of temperature data show dramatic warming. Was the proxy wrong or the temperature data wrong? What justification did the authors have to trust the temperature data over the proxy data? Did they just like the results better?
This study does the same:
http://coast.gkss.de/staff/storch/pdf/moberg.nature.0502.pdf
The proxy data is significantly colder than 1000AD temperatures and only the instrumental data is warmer.
I guess it’s a well accepted peer reviewed method…
This study shows proxies for many locations. In most of them most of the modern warming happens between 1850 and 1930, with only modest warming occurring post 1930. Why do temperature records not show this?
http://www.geos.ed.ac.uk/people/homes/rgroves/wilsonpub4.pdf
This whole thing shows why it is better to use constant proxy when studying climate change in a historical context than temperature records that are disjointed over time.
Actually no, this whole thing shows that deniers such as the CSC and yourself will do anything to try and cast doubt on the scientific studies of historical climate. The explanations by NIWA and others of what has been done to create a consistent temperature record show that it is a complex process that must be done carefully and consistently. The CSC attack fails because it presents a caricature of the reconstruction process – one that they clearly knew was false. Your attack fails because you simply imply “I can’t be bothered checking every calculation in the reconstruction so let’s throw out the whole dataset”. What is ironic is that you’d prefer a proxy reconstruction that relies on far greater indirect attribution of temperature effects (but is “acceptable” to you because it seems to confirm your preconceived ideas about what “should” have happened.
Right…. so answer on the difference between the proxies and the instrumental record, no answer on the email admission, and no answer to the pure proxies showing earlier warming, just an attack at me for ever raising doubt. Nice one.
“Actually no, this whole thing shows that deniers such as the CSC and yourself will do anything to try and cast doubt on the scientific studies of historical climate” How dare us?? To think we can ask questions???
There is a clear difference between asking honest questions and the vexatious questioning of the sort the CSC, yourself, and other deniers are currently engaged in.
The fact is, the original questions about the Wellington data were clearly answered as being entirely justifiable corrections (indeed, CSC evidently knew this all along). You then questioned Hokitika and when this was pointed out to again be due to station repositioning you retreat to implying doubt on all stations by saying let’s not use any “disjointed” temperature records. You will never stop because you’re not interested in the answers, you’re only interested in casting aspersions on the veracity of the science and the scientists who painstakingly pieced together the temperature records.
R2D2 – you can only get to the bottom of this by actually understanding how a proxy record is constructed which is a lot of reading for you for even one proxy type. The possible errors introduced when homogenizing an instrument record in way NIWA work pale into insignificance compared to problems with proxies, even ice core oxygen isotope. Furthermore taking the temperature of the earth is a complicated process even with the instrument record which manages a much better spatial distribution than any proxy record.
I also think that you are assigning far too great a weight to the importance of the millennial record (or earlier). These are extremely important for seeing whether the temperatures go up and down with respect to forcing but it matters not a damn whether the weather at some distant point was warmer than today – what matters is why – which forcing are causing the change.
All the other points you are trying to raise have been done to death elsewhere. Gavin Schmidt at RealClimate has been patiently answering those question – but have you bothered to read them? The answers from the horse’s mouth as it were. Wont read anything on RC because Mann has made occasional posts there? That would seem a little petty. Try having a read of Gavin’s response to raving and tell me what you think of the man.
The CSC types have been repeatedly told by NIWA how the adjustments were done. It’s just part of the continuing strategy, similar to that used by tobacco companies. They have my undying contempt.
The hot air being vented around this site with comments, e.g. “They’re the ones doing the digging,” is LOL. Unfortunately the corrupt ETS scam forced on Kiwis by immoral politicians and their so called expert advisers is no laughing matter.
Rodney Hide is the most sensible of all with his open letter to Nick Smith.
Well said, Billy T.
As has been shown by Gareth and others, NZC”S”C are running a propaganda campaign rather than an honest enquiry.
I expect that, one day, their fossil fuel puppeteers will forced to reveal their correspondence and pay huge damages, as with their predecessors in the tobacco industry.
Meanwhile, millions will suffer and die, particularly in the undeveloped world – but let’s not worry about them, its their fault for having too many babies, right?
“Meanwhile, millions will suffer and die, particularly in the undeveloped world –”
That is the type of statement that damages any credibility there may be.
I think you should all take heed of what MacDoctor.co.nz has state.
“The MacDoctor would like to point out that he has absolutely no vested interest in proving Global Warming true, or untrue. He just thinks it is unbelievably stupid to damage the New Zealand economy in the middle of a recession for absolutely no environmental gain of any significance. “
So what is the difference in terms of ‘alarmism’ between saying “millions will suffer and die” and “it is unbelievably stupid to damage the New Zealand economy in the middle of a recession for absolutely no environmental gain of any significance”?
Both statements can be supported by ecologic or economic arguments based on the respective models for how climate change/ETS is going to impact on the environment or the economy. Others may equally argue that the deductions are misguided, based on political beliefs, or some kind of ‘scare mongering’.
Myself, I have more ‘faith’ in the scientific results than in the economic modelling.
Jim is confusing scepticism about the need for economic action with scepticism about the scientific evidence. The evidence is what the evidence is, and it hasn’t changed one iota because of thefts from CRU or Treadgold’s inane exercise with NIWA data. Accept the evidence and argue about what we do. That’s the productive discussion, not this barrage of nonsense designed to derail any action at all.
Sally: “What a shame Dr Augie Auer was so suddenly taken from us.â€
Augie Auer was “suddenly taken� By whom, and do the CRU emails throw any light on this mystery? Perhaps someone should Investigate.
For the scientifically challenged, such as me, the climate issue ultimately comes down to credibility. Some time ago, I watched a television debate between two Wellington climate scientists and a sceptical scientist from an inland New Zealand city.
The Wellington pair were supported by a young lady from Greenpeace, while the scientist from the inland New Zealand city was teamed, oddly enough, with a middle-aged radio man with a foreign accent.
Being a complete novice in climate matters, I was obliged to select a non-scientific criterion by which to judge the participants’ credibility. My choice: the “beard indexâ€. On this measure the warmers were the clear winners.
The Wellington scientists sported facial hair that was measured, precise and trustworthy, consistent with their arguments and evidence. Sadly, the scientist from the inland New Zealand city displayed a growth whose “fungus footprint†could only be described as undisciplined and irresponsible to the point of recklessness, much like his claims.
On the lay side, the young lady from Greenpeace, while scoring zero on the beard index, was bright and personable. In contrast, the radio man was curmudgeonly, truculent and aggressive. And yes, beardless.
That said, I note with some concern that the director of CRU, and the man in charge of some vital climate data, is totally clean-shaven. Can this be a good look for the credibility of the scientific enterprise?
Comment of the day!
Interesting debate.
Regarding the tone of the post: I’m not sure why you hover between saying the NZCSC are ignorant or liars, when you clearly think they are lying. It doesn’t make you sound any more rational to hedge your bets.
On the other hand, I get the impression you have no problem believing the best of any of the scientists or opinions that suit your preference. Not all skeptics are scum, and I’m disappointed the debate often forces people to appear to take sides. I don’t think it helps.
Personally, I’m not sure why rising trends in climate from 1910 *prove* man-made global warming as opposed to, say a longer term planetary trend.
There are other trends we can look at in our recent history – big improvements in technology and science that continue to give us hope we can minimise our impact on the environment regardless of what the ultimate cause of warming is. I wonder if we will continue to be distracted by just how much tax we need to pay to avert the crisis rather than just getting on with things.
I thought I was quite clear: but if it helps, in this instance they are both demonstrating ignorance, as their “analysis” clearly shows, and liars, because they assert corrections were not needed when they knew they were, and had done for at least three years.
I gave my reasons for trusting expert advice (of all sorts) in an earlier comment. The scientists in this field can only be considered untrustworthy if you believe there’s some sort of global conspiracy to create a problem where none exists.
Climate trends in NZ prove nothing about global changes. But the global data is, as the IPCC says, unequivocal. It doesn’t depend on any one temperature series, or paleoclimate reconstruction, or retreating glaciers, or stratospheric cooling. It’s all those things (and more) together — the balance of evidence — that’s so persuasive.
Try this analogy: at the end of my road there’s a T junction and a signpost. Turn left, and I get to Waipara, right and I’ll end up in Amberley. I am confident that the signs are giving me good information about direction. There are numbers on the sign that tell me how far away each place is, but I’m less sure about them. Amberley is apparently 10km from the sign. Is this true? I won’t really know until I get there and check the odometer. Our understanding of climate is pretty much equivalent to my feelings about the signpost. We know the direction of the signpost is right (balance of evidence), but we can’t be sure about the distance (partly because forecasting is difficult, especially about the future, and partly because we have a lot of stuff to study).
Or: look at one of those big 32-sheet posters stuck up by the road or on a building. From a couple of hundred metres the picture’s very clear, but when you stand only a metre away, everything looks fuzzy and made of big dots.
Anway: enough analogies. Averting the crisis is only partly to do with paying taxes. Climate change is not purely an economic problem, because survival never is.
“Warming” is about trends in temperature data. Attribution of warming is about physics pure and simple. No, not all skeptics are scum, many so called skeptics are simply ignorant. And all too many are willfully ignorant. An actual skeptic is skeptical about all evidence – most scientists. Denialists are only skeptical about evidence for AGW and believe without question any rubbish that supports a skepticism. So far I have been happy to engage with R2D2 because R2D2 obviously is prepared to look at the other side at least on occasions. The anti AGW canon is either “we arent warming; or we are warming but is not caused by us; we are warming but its good for us” . A skeptic that you can discuss something with is in one camp or other. Sure sign of denialist is someone who manages to hold to ALL of the options. This isnt skepticism – this is “I’ll believe any fairy story so long as its consistent with me not doing anything”. That is frankly contemptible and not worth engaging with.
Part of our denial problem is that NZ is insulated from the immediate effects of climate change by the thermal inertia of the surrounding ocean, thus we don’t, at this stage, feel we have that much to gain by giving up our profligate first-world lifestyles.
The view from the third world, however, is much grimmer:
“Global warming causes 300,000 deaths a year, says Kofi Annan thinktank. Climate change is greatest humanitarian challenge facing the world as heatwaves, floods and forest fires become more severe.
Climate change is already responsible for 300,000 deaths a year and is affecting 300m people, according to the first comprehensive study of the human impact of global warming.
It projects that increasingly severe heatwaves, floods, storms and forest fires will be responsible for as many as 500,000 deaths a year by 2030, making it the greatest humanitarian challenge the world faces.”
http://www.guardian.co.uk/environment/2009/may/29/1
To Scaddenp (#46): No, the 1988 predictions were for NZ in the MFE publication I cite. Check my link in #44.
Clearly, we should have seen exponentially rising temperatures since then. We have not.
So, Steve, are you going to defend Treadgold’s crass incompetence? Do you think the NZ CSC’s smear tactics are to be encouraged? Or are even you embarrassed by their piss-poor attempt at propaganda?
The importance of the Thorndon data transformation is that the amount of movement of that data has a significant (and disproportionate) impact on trend analysis. Unfortunately, there is only weak justification for the size of the data shift ( i.e. Thorndon is at the same height above sea-level as the airport) – yet the result of that shift has a significant impact on the resulting trend.
With hundreds of these kinds of small assumptions world-wide, and often with verification via simplistic predetermined bias (the earth is warming) – the resultant trends displayed in the global temperature summary graphs simply reflect the underlying bias of the graph’s creators.
This kind of measurement bias is often evident in many pseudo-sciences and the way bias influences the measurements is often hard to detect and harder to eradicate.
Rubbish!…have you even read the post? Go back and re-read it! I suppose “simplistic pre-determined bias” is what is wasting and shortening the Tasman Glacier,eh?
You might also notice that data from the Thorndon site doesn’t even cover twenty years,so it’s of no interest for its trend, and barely of any interest for its mean, except that it tells you something about a sea-level site in Wellington that is corroborated by the airport data less than 10 kilometres away! The data from Thorndon could be discarded otherwise.
As well, rather than adjust Thorndon/Airport down to fit Kelburn’s higher altitude, one could just as well adjust Kelburn up to fit Thorndon/Airport’s lower altitude: the trend over the century is the same, and that trend exists and is significant.
There is a lot of published science on site analysis,and the reasons for and methods of adjustment. The process of making adjustments was/is not taken lightly, has been a matter of global expert consultation, and it has not been a secret; it was simply of no interest outside the profession until neurotics started looking for messengers to shoot because they’re scared that there may be a cost to shitting in the global nest.
I have read the post – I suggest you do so with an analytic attitude – you will see the invalid assumption about the Thorndon temperatures.
You claim the Thorndon temperatures are of no interest, then why on earth did they shift them downwards and include them in the trend analysis ? The reason is clear – it’s to support the bias that is becoming more and more evident in the faulty measument techniques.
Your claim that the Thorndon and Airport site temperatures are the same because they are 10kms away doesn’t wash, as the 2 sites are very different. Thorndon is dominated by the Tinakori Hill and the airport has no similarly placed hill, and is relatively flat. The wind and shade profiles of both sites are significantly different. The airport is exposed to relatively open seas to the south with harbour seas to the north. Thorndon is enclosed in the harbour.
With such extreme geographical differences, you cannot assume that both sites have similar temperatures – you have to establish a reasonable baseline with overlapped measurements. Without that reasonable measurement, you must discard the data for the purposes of trend analysis.
If temperature measurements and processes are so easy to obtain, why has it been so hard to get them ? Scientists don’t normally throw away the only copies of source data on which their theories rest – this is total anathema to a real science. The casualness of the discarding of the only source data by the CRU and others is disconcerting evidence of a pseudo scientific attitude.
Cadae – in creating a merged Wellington record you either have to adjust the Kelburn record up, or you adjust BOTH the airport and Thorndon record down. A merged record that makes no adjustment for altitude would make no sense at all. Its not ideal that that there is no overlap between Thorndon and Kelburn but that is life. The default position is treat Thorndon the same as airport since at same altitude. Given the difference between Kelburn and airport, the closeness of the adjusted record would suggest the error would be small but the BEST way to deal with this is weight data Thorndon worse in constructing the trend line. Note also, that including Thorndon in the merged record REDUCES the warming compared to using just airport and Kelburn.
Your comments on CRU are continuing to repeat uninformed slander. CRU did not destroy the only source data – they are not the custodians of it – the individual NWS are and they still retain it. I am not in the habit of retaining once-through raw data after processing for which I am not the custodian and for which I can ready obtain it again should I want it.
The problem is that it is the temperature trends that are the current focus of attention. Any data shift has a direct impact on the trend – the shift becomes the trend! Thus it has to be rigorously justified. Without that justification, you end up simply measuring your own relatively weakly-justified bias.
“The default position is treat Thorndon the same as airport since at same altitude.” This is an invalid assumption – from a temperature perspective, they are very different sites. A simple geographic observation will demonstrate what I’m suggesting – I can testify to this as I have lived in Thorndon and then Kelburn for many years and have been to the airport on many occassions. The shade of Tinakori hill dominates Thorndon for much of the year – the Airport is not similarly affected. The always-dominant Wellington winds are very different at both sites. The sea has a much greater impact at the airport than in Thorndon.
I agree with your comment that ” .. the BEST way to deal with this is weight data Thorndon worse in constructing the trend line. “. That is indeed what NIWA should have done – but did they ?
Re CRU being custodians of the data…
CRU are the custodians of Data Set that they used. They collated and created that data set on which their hypothesis is founded. No one else had it – individual NWS organisations may well have parts of the data set, but no one else had the complete data set – it is a creation of the CRU. They picked and chose the sets of raw data and created a unique raw data set.
Without that original data set they have no evidence for their claims except their own (now suspect) word for it.
Is there no end to the supply of you idiots? Next thing you’ll be telling me there is no evidence of a rise from “stable” sites (plenty of them, including Kelburn itself) from the 1930s. You clearly don’t know anything at all about NZ’s climatology.
Resorting to an ad-hominem attack demonstrates a lack of sound argument and an anti-scientific attitude.
…yet you are the person who dismisses NIWA’s work as ‘pseudo-scientific’,and whose ‘analytic attitude’ failed to understand that the raw data used by UEA CRU still resides with its sources. You also like to pass off your own hyperbole-‘extreme geographical differences’-as a reasonable view. Great work.
You need to understand the concept of an “ad-hominem” -it’s where an apponent attacks the person rather than the person’s ideas. Thus attacking NIWA itself as “pseudo scientific” would constitute an ad-hominem argument, but criticizing an explicit instance of their work as pseudo-scientific is not an ad-hominem.
“Extreme geographical differences” is a fair assesment of the differences between the sites. You couldn’t get any 2 sites in Wellington near sea level with as many differences as those 2. As such their differences can be characterised as extreme.
Anecdotally speaking, of course.
As AGW deniers have neither facts nor theory to bolster the conclusions their ideological fanaticism and industry funding requires them to draw, they have nothing to fall back on but to try to create confusion amongst the general public.
Doubt is their sole product, which explains their time-wasting “angels dancing on the heads of pins” comments in this thread.
Get a life, guys! Go hug your children and tell them you care about their future…
Have addressed your assertion up-thread 10:45 am comment 84
scaddenp, comment 102:
Agree that proxies are difficult to calculate. You make a good point.
In terms of the importance I place on temperature records:
It is not just me who does this. There is an entire chapter in every IPCC working group 1 report on paleo-climate. It also has chapters on recent climate and extensive coverage in the summary reports.
I think it is important to ask the question, how does today’s warming compare to historical warming?
For a number of reasons:
If large climate variations have happened before, are they dangerous? When we say “pre-industrial” what do we mean? How will feedbacks act? Are there negative feedbacks? Do models accurately account for other forcing? (after all are these not calculated using the temperature histories?)
The public and scientific community place weight in claims such as,
“While warmth early in the millennium approaches mean 20th cen-
tury levels, the late 20th century still appears anomalous: the 1990s are likely the warmest decade, and 1998 the warmest year, in at least a millennium.” (MBH, 99)
We now know that the proxy data used for this was available until the present, but it was not used post 1960 because it did not agree with the instrumental record. The author knew this at the time of publishing. This has been used extensively in IPCC AR3, and a little in AR4 (but in a different format).
Can this conclusion be reached when it is known that the proxy disagrees with the instrumental record?
Lets look at three scenarios. The instrumental record and the proxy do not give the same information for temperature history, so:
Either the instrumental record is wrong,
The proxy record is wrong,
Or both are wrong.
Both can not be right.
So how can this conclusion be reached? Only by comparing a proxy record with an instrumental record, with the knowledge that one must be wrong! This conclusion is therefore false.
The explanation has been given to me in the past this is caused by tree records not responding correctly to extremely high temperatures. Ie growth increases with moderate warming, but decreases with extreme warming.
The response I give to this is: how can we know that ‘extreme’ warming did not happen in the past by only looking at a tree ring proxy? How can we be sure we are not reading past warming as past cooling?
So yes I see your point that proxies are complicated and not always correct themselves. However without a historical record instrumental records are meaningless, because there is no yardstick to compare the warming to. And with a historical record, instrumental records are meaningless because we are comparing apples with oranges (ie we do not know how the instrumental record would have recorded past climate change). Therefore we should compare proxy history with proxy present – even if proxies have faults of their own! Better to use a range of proxies and look for alignment, as we can assume that different proxies will fail under different circumstances. And different proxies have different advantages and faults, for example tree rings do have the advantage of showing high resolution (year to year) data.
This study (below) has done that (use multiple sources), however sadly they have removed the last 40 years of the proxy data and used instrumental data to show today as the warmest period in the last 1000 years (or have they just placed the temperature record over the proxy? hard to see). Even so they conclude the high latitude NH medieval temperatures we were warmer than modern temperatures until the 1990’s. And find a larger ‘little ice age’ than MBH99.
http://coast.gkss.de/staff/storch/pdf/moberg.nature.0502.pdf
I missed this when you posted it R2D2.
“Either the instrumental record is wrong,
The proxy record is wrong,
Or both are wrong.”
Basically by definition, the proxy record is wrong. All proxy reconstruction at some stage end up with a calibration to instrument record. I agree that past temperature is important but because it constrains models. You need to see that past temperatures have moved in response to past estimates of forcing within the limits of error. However, estimates of past forcings are uncertain as are the proxy temperature records. This limits what you can infer and you have to live with that.
(its incredibly exact compared to issue of modelling temperatures in a sedimentary basin which I do but its still worth doing because of the constraints it produces).
So far, you only seemed to talking about the Yamal tree ring problem with the well documented divergence problem. If this was the sole basis of past temperature reconstructions, we could be worried but this is not the case despite what CA tries to say. You pointed to one other (Moberg 2005). You will see this on Fig 6.10b (with 11 other published multiproxy reconstructions) in Ch6 IPCC AR4 WG1, and it is discussed on page 471 and 473-474. I believe the conclusions in that Chapter to be robust.
So-called “Pragmatist”, if Rajendra Pachauri’s scientific credentials aren’t good enough for you (although they were for the Nobel Committee), let me quote from the man Pachauri replaced as chair of the IPCC after the Bush administration forced him out:
“Climate change sceptics and lobbyists put world at risk, says top adviser
• Chance to limit warming squandered, says scientist
• World needs to prepare to cope with at least 3-4C rise
Climate change sceptics and fossil fuel companies that have lobbied against action on greenhouse gas emissions have squandered the world’s chance to avoid dangerous global warming, a key adviser to the government has said.
Professor Bob Watson, chief scientist at the Department for Environment and Rural Affairs, said a decade of inaction on climate change meant it was now virtually impossible to limit global temperature rise to 2C. He said the delay meant the world would now do well to stabilise warming between 3C and 4C.
In an interview with the Guardian, Watson said: “Those that have opposed a deal on climate, which would include elements of the fossil fuel industry, have clearly made making a 2C target much, much harder, if not impossible. They’ve clearly put the world at risk of far more adverse effects of climate change.”
The decision of former US president George W Bush to walk away from the Kyoto protocol, the existing global treaty on carbon emissions, sent a message to other countries not to act, he said. “The last decade was a lost opportunity. Elements within the fossil fuel industry clearly had major implications for the Bush administration.”
http://www.guardian.co.uk/environment/2009/nov/22/climate-change-emissions-scientist-watson
One can but hope that, one day, the primary climate change denial conspirators will occupy cells at the Hague, awaiting trial for crimes against humanity.
Are you sure the Nobel Committee is the bastion of non-partisan objectivity that you suppose it to be?
Refer up-thread November 29, 2009 at 3:47 pm comment 82 where I have NOT denied that some major actions need to be taken to mitigate man’s contribution to the current warming.
I also point out that the actions being taken are not only miss-directed and ineffectual but that they also let the worlds major emitters off the hook.
As for a bit of jail time, I hope to be assigned the cell next to Galileo.
Pragmatist, I agree current commitments are derisory, but once we have a globally binding agreement, it can be tightened, as happened with CFCs. What other way might you suggest?
Unfortunately, the wasted last decade means that we have little time left to avoid wrenching changes, which is why the denial PR campaign funded by the fossil fuel industry courts disaster for us all.
The people behind the disinformation campaign are like those princes of the Church who refused to look through Galileo’s telescope, lest their worldview be threatened and, with it, their power and privilege.
“The actual hacked climate model source code explained by a software developer:
http://www.youtube.com/watch?v=sYxk7pnmMFw
http://www.youtube.com/watch?v=Gp4sMasX-_8
Roger: It’s not “climate model source code”. You clearly have no idea what’s going on.
” ” These things have a meaning. Do you know what it is?
The .76 adjustment claimed is correct for a gain of about 125m. Was the original 3m height location also on top of the roof of an occupied structure and next to HVAC units? If not, how is this corrected for?
Is there any defensible reproducibility to any such correction.
Do the other sites have similar problems?
When the unadjusted data be made publicly available, along with the adjustments a gloss which explains them and any discontinuities in the data?
Uh oh, not another UHI crock acolyte.
Was the original 3m height location also on top of the roof of an occupied structure and next to HVAC units?
I’ve seen that post on WUWT, complete with a photo where they reckon the weather station is. Thing is, the station has been unmoved since the 1920’s – and the building that they have photographed is much newer than that – no later than 60’s or 70’s. Looks like they say a zephyrmeter or something that looked like it, and then jumped to conclusions. I’ll see if I can take a picture of where the weather station really is this week.
As mentioned before, UHI really doesn’t apply in Wellington. It’s far too windy…
Another sign of incompetence or worse. The picture shows the NIWA building, whilst the actual weather station in question is in the botanical gardens in Kelburn. It’s inside an enclosure on a patch of lawn.
http://maps.google.co.nz/?ie=UTF8&ll=-41.284406,174.768007&spn=0.000706,0.001063&t=h&z=20
But now that I think of it, I might have seem Jim Salinger with a portable heat gun up there a few times.
Frank
Yikes, I shouldn’t post BC (before coffee).
“Is there any defensible reproducibility to any such correction?
Do the other sites have similar problems?
When will the unadjusted data be made publicly available, and along with the adjustments a gloss which explains them and any discontinuities in the data?”
And there is now quite a precedent to that being the correct response to such a controversy:
http://pajamasmedia.com/blog/the-latest-on-climategate-university-will-release-cru-data/
Of course it would be good if someone not on the “hockey team” proctored the release of data, preferably a panel of statisticians, and the drives should have been seized and kept in forensically sterile conditions since–but you can’t have everything.
Has anyone placed an array of temperature sensors around HVAC units and also a control quite way from them so at make comparisons of such temperatures charaterisable?
Summer’s coming up tdperk (assuming you’re in NZ). Why don’t you do this yourself? It would be a great little “experiment” to publish in the climate measurement literature. And even better, you can show how the data SHOULD be treated. Looking forward to reading all about your efforts.
There is a great mass of literature around UHI in the science journals with all manner of experiments and methods to make corrections. If you think UHI is an issue, try calculating world temp with only rural stations. Surprize – no different. Why? because GISTEMP corrects urban stations for UHI effects.
Now some garbage from UHI obsessives. In case you didn’t know, the vast majority of stations in the NZ historical record are not even remotely urban – one doesn’t even need the town/city records to demonstrate warming.
Yes, I too would like to see some of the denier-ringleaders face legal sanction and public humiliation at some point in the future.
“Why? because GISTEMP corrects urban stations for UHI effects.”
How accurately? In whose estimation? Hansens?
tdperk – are you actually really seriously suspecting that GISTEMP etc are manipulated by climate conspirators and if you could just get your hands on the thermometer readings then GW would disappear? How come glaciers melt and satellite MSU readings show the same trend. Is Christie at UAH actually a sleeper double-agent in the global conspiracy?
To questions. The UHI corrections are subject of huge literature which obviously you have no interest in actually looking for. If the corrections are wrong, then why would you see the same trend by picking rural-only stations?
And you do know climate is a 30 year trend?
“the vast majority of stations in the NZ historical record are not even remotely urban – one doesn’t even need the town/city records to demonstrate warming.”
Does it show the warming continuing over the last ten years? Does it do so before or after adjustment?
“Yes, I too would like to see some of the denier-ringleaders face legal sanction and public humiliation at some point in the future.”
Please put all your best efforts into it.
Are being deliberately stupid, or is it congenital? It’s already been stated and restated that most records are for “stable” stations and have had no adjustments anyway – and the warming applies over a very long timespan.
10 years is too short a period in which one can draw climatological conclusions, and that has also been explained ad nauseam. It is a trivial matter to look at shortish timespans in the record and conclude that there was no warming during those periods – or even a little cooling.
Go away, learn some elementary statistics and in particular, learn something about NZ climatology. Otherwise, shut up and stop wasting other people’s time.
Does anyone know when the temperature adjustments were made? ie were the adjustments to previous raw historical data made about the time the stations were moved, or have the adjustments over the historical data been made more recently.
The raw data that you can download is unadjusted – you get the data by station. Otherwise C”S”C couldnt do their “analysis”. You would only make these adjustments to create a long merged record for the purpose of estimating long term temperature trends for a location. I would imagine this happens with respect to papers published on NZ temp trends.
As far as I know, the adjustments are worked out at the time the long term series for a station are being constructed – ie only once. In the case of many of these NZ stations, Jim Salinger did much of the work as part of his PhD thesis (and that was a while ago 😉 ).
When a station is moved you have two sets of data. There may (eg Kelburn/Airport) or may not (eg Thorndon/Kelburn) be an overlap period. What you download is raw, unadjusted data as far as I know. Certainly not this type of adjustment. Ie You cant download a “wellington” station. You can download 3 stations; Thorndon, Kelburn and Airport, each with their own time period.
Interesting article. There seems to be room for argument both for the adjustment of the Thorndon readings (same altitude->use same adjustment) and against (airport != Thorndon). Hence, best practice as a scientist would be to justify why such an adjustment was made, considering both arguments. One would also ensure that any trends or conclusions resulting such an adjustment were carefully balanced. One presumes this was done – does anyone have links to the published papers?
It also seems to me that this is something that within a couple of years could be verified one way or the other. Simply reconstruct the weather station at Thorndon and run it for a couple of years. Under the assumption (which one presumes has already been covered) that readings from this reconstructed weather station are comparable to the original, this would verify whether the adjustment is appropriate or not by giving a suitable overlap for comparison.
If data is sparse every good scientist:
1. Does the best one can with the data at hand, highlighting any and all potential biases.
2. Does the best one can to ensure that more data becomes available.
You cannot construct a merged record with stations at sealevel and one at
123m without doing the adjustment. The closeness of adjusted Kelburn to unadjusted airport would suggest no majors in combining the stations. Scientists always some imperfect data to none at all. While the idea is nice, its not worth doing. To the argument at hand, adding Thordon decreases the warming trend (provided you adjust Kelburn for altitude) so arguing that including it is fraud is going nowhere. Its effect on the overall trend for NZ temperatures is negligible.
I would really like to hear how C”S”C explains the ice/snow loss of past 32 year if temperatures are not rising. Photoshopping of photos perhaps?
http://www.youtube.com/watch?v=Cu_ok37HDuE
After watching this, the conversation ends. Nice try though.
You take a youtube video full of crap and half truths, and reckon that is the last word on the subject? That is your idea of an authoritive source of information? Ye gods. Try doing some fact checking – that whats scientists do.
“Britain’s University of East Anglia says the director of its prestigious
Climatic Research Unit is stepping down pending an investigation into
allegations that he overstated the case for man-made climate change.”
http://www.google.com/hostednews/ap/article/ALeqM5j_dt9Bjj5yVV7k1PAyDnVHKvKtgAD9CAM0VG0
….Only that’s not what the UEA ‘says’ in its media release. This is what they actually ‘says’:
“Professor Phil Jones has today announced that he will stand aside as Director of the Climatic Research Unit until the completion of an independent Review resulting from allegations following the hacking and publication of emails from the Unit.”
Journalists can get into trouble paraphrasing,can’t they?
In the spirit of even-handedness,Roger,will you step down-or stand aside-while your allegations against NIWA remain unsubstantiated?
Well then, isn’t it a shame that the melting cyrosphere hasn’t got the message yet that global warming is all a con…
Go on, Roger, do the world a favour and go argue some sense into the West Antartic Ice Sheet.
simplescience: “Simply reconstruct the weather station at Thorndon and run it for a couple of years.”
I doubt that you could. There was a lot of building there in the 1970s. But doubtless you could set up a station somewhere in Wellington that’s not too different. Like the airport?
So it’s been shown it’s not too different then? i.e. some measurements have been taken, or some arguments as to why they’re not different have been put forward? If so, why wasn’t this stated in the NIWA article? It seems like an obvious question to ask given that they state it was adjusted in the same way “for illustration purposes”, and then state that the adjusted curve may be used “to draw inferences about Wellington temperature change”.
In the blog post it suggests that the same altitude suffices. That may be indeed be enough (at least when coupled with the fact they’re 10km or so apart), but I haven’t seen any citations as to why that is so.
Sheesh – this is historical data – you do the best you can do. If kelburn and Airport are too different once height corrected, reasonable to expect
Thorndon and airport not too different. If you cant live with that then ignore Thorndon completely. You get a stronger warming trend.
Why altitude matters and distance doesnt? Well that is the nature of temperature distribution in the atmosphere. Dont consult a paper – consult a text book.
I fail to understand the obsession with this.
It is amazing that this pointless discussion about a very simple issue is still continuing. With or without pre-Kelburn records, Wellington has warmed – just like dozens of other NZ locations. About 3 years ago when the CSC brought these matters up in the times of the late Augie Auer, NIWA responded (and not for the first time, even back then). Result? – total silence from the CSC, who had nothing they could say in their defence, having been caught in a pack of lies. Now, it’s conveniently been re-litigated, with Copenhagen imminent. Simple filibustering by the flat-earth brigade. End of story!!!
Gareth, another exceptionally good post on your part.
Adiabatic lapse rates (i.e., temperatures change with increasing elevation) and urban heat island effects (i.e., temperatures change with land use change) are things that must be considered when weather stations are moved over time. This, of course, is true for measurements of any other variable in a complex ecological system. That is why scientists must strive to “adjust data”… to obtain a better model of what is really going on in the real world.
So congratulations for showing an example of how “manipulated data” is not only desirable, but required, in some cases. The Wellington example that you (and NIWA) presented was a nice and simple example. Thank you.
gareth, you mention the following in your article:
“…And it’s a lie because the NZ CSC has known for at least three years why adjustments have been made to certain stations. …â€
Can you please be specific and let us know what stations needed adjustments and what were the reasons.
Sal, if you want that info, you can do what Treadgold should have done: download all the station data, read through the metadata, dig up the relevant papers and reconstruct the data series. That’s what I would have to do in order to spoon feed you, and that wouldn’t help your education, would it?
Gareth,
Excuse me for assuming that you had already done the research. How foolish of me. So you are admitting you haven’t done the research yet you have the audacity to make this statement:
“…And it’s a lie because the NZ CSC has known for at least three years why adjustments have been made to certain stations. …â€
How can you make the above statement if you have not done what you suggested I do. And I’ll quote you
“…download all the station data, read through the metadata, dig up the relevant papers and reconstruct the data series. That’s what I would have to do in order…”
Am I being too subtle? Would you prefer I was more direct? Well, here it is:
You just made a claim in your article that is not substantiated by any research, any legwork on your part. You haven’t verified diddly squat.
Would you take it as an insult if I called you a parrot? i have stronger adjectives but I’ll remain polite.
As I never claimed to have done the basic research, only to have found that Treadgold et al had not bothered to do the basics, your faux outrage is illuminating. My research, in this case, was into what the NZ CSC knew, and when they knew it. It has been confirmed by NIWA’s latest release. Treadgold et al lie about data coverups.
You can call me what you like: it will say more about you than me.
So: are you defending Treadgold et al’s shonky analysis, and the use of that analysis to smear respected scientists? Are you as morally and ethically bankrupt as Treadgold and the NZ CSC?
Excuse me, sir.
For you to stick out your neck and make this statement
“…And it’s a lie because the NZ CSC has known for at least three years why adjustments have been made to certain stations. …â€
I would think you would have done a minimum amount of research to see that it was true. You obviously did not.
Funnily enough, Sal, I did. I don’t rush into print without checking the facts, and in this case my sources confirmed that the NZ CSC had known all the salient information three years ago. This information is confirmed in NIWA’s release yesterday, covered here. The fact that Treadgold et al were stupid enough to link disparate station records without adjustments was obvious at first reading. To then go and smear Salinger and others makes Treadgold and the NZ CSC membership — and I repeat — morally and ethically bankrupt.
Sal, have you actually looked at the data yourself? For that matter do you have any idea how many weather stations there are (or have been at one time or another) in NZ? Or looked at any of the publications from NIWA where they explain the correction procedure? Sheesh.
And are you actually interested in this information that you so casually request Gareth to provide?
Billy T,
Gareth made an assertion in his article. An assertion that he indirectly admitted is based on no research on his part. He doesn’t know what stations’ data has been changed or for what reasons. He simply repeated what he was told. Doesn’t know if those stations are the same ones in the NZ CSC report or if they’re completely different ones. He simply stated:
“…And it’s a lie because the NZ CSC has known for at least three years why adjustments have been made to certain stations. …â€
That is vague, sloppy and misleading. And I am being very polite.
Sal, I think you are being a little disingenuous here – that statement is a fair reflection of the comment that Gareth was making about the CSC – it is quite obviously true that they knew that their assertions in their report were false. Gareth pointed that out, dug down into the Wellington graph that the CSC presented as their “smoking gun” and showed where and how their graph was false. There was no reason to go on and document all the other weather stations for the purpose of writing this article. Anyone who is interested can follow the links back to NIWA and find out.
You however, feel the need to repeatedly ask Gareth to provide you with detailed information that you could simply get yourself by looking on the NIWA website. Why? Because you want to learn? No, evidently because you want to have the opportunity to come back at him and call him names.
As for An assertion that he indirectly admitted is based on no research on his part. did you actually read what he said? Or is that weasley little word indirectly supposed to get you off the hook for your slur?
Pathetic. And I am being very polite.
Oh so now you have the info. Okay. i ask you what stations changed their original data set and for what reasons.
Sal, perhaps you need a link – the relevant publications that detail the adjustments required to produce a consistent long-term temperature record are listed on that page together with a ‘layman’s’ explanation of why they were done.
So NZ is warming up. (and down for the last 10 years) So what. I personally would love to see Wellington 5 deg warmer:)
Considering that we all live on a relatively unstable thin crust, covering a core of molten lava, with continuous Earthquakes and volcanos belching gas. Together with the high sunspot and solar flare activity through the 1990’s. Aren’t we all being a little arrogant thinking that mankind is affecting our climate? Let alone being able to control it.
I tend to remember from some history lessons many years ago that there was a time when Greenland had a mild climate, and the Northwest passage was open year round.
Is it coincidence that our records start from the end of the ‘Little Ice Age’ (1500 – 1800) You would have to hope that we have warmed since then.
It is quite humourous seeing the indignant outrage from both camps. Both believing they are right, and unwilling to see the others point of view.
After having spent some time in the Kelburn area as a child, and again recently, I am quite surprised that it is not affected by the heat from the growing city which surrounds it. Sure the wind can blow, but only some of the time. Still I guess the data would be adjusted for those days.
I may be only an old fool, but I thank you for giving me something to chuckle about.
Kiwivet:
I may be only an old fool
Never a truer word was spoken in jest.
Nope. That’s what the evidence shows. You might want to check it out some time…
Rudeness is the weak man’s imitation of strength. -Eric Hoffer, philosopher and author (1902-1983)
In fairness to Billy, I should point out that the sorts of points you make (misconceptions about solar flares, Greenland, NW Passage etc) get dealt with regularly here. Sometimes patience can wear thin — and you must admit you did set yourself up for the “old fool” comment… 😉
Why not just accept that the thugs and data fiddlers of CRU and elsewhere have seriously prejudiced your proposition. Heaping abuse on those you call ‘deniers’ and ‘liars’ helps your case not one bit. You claimed to have the high moral ground. If you ever had it you have lost it now. Wratt, Salinger and the rest here are now suspect because of their association with Jones, ‘Piltdown’ Mann, Briffa etc.
It is not as though any of you have any real and relevant science behind you. If any of you had you would have put it up for consideration.
Latest news about Climategate:
[No free ads for the propagandist in chief, thanks. GR]
Afraid of debate?
I think the notion that human activity is responsible for the “observe”–read created–climate warming is a myth; that what warming has occurred is all but entirely natural in origin, and that the “signal” of human originated CO2 driven “warming” is one which cannot be isolated from the noise or natural causes. The Medieval warm period happened, and it was largely global in scope. A period of swiftly increasing temperatures was seen in the recent past, in the 30’s, and no “theory” of CO2 driven warming the CRU and like witch doctors have produced accounts for that or for the fact the warmest years of the last century were in the 30’s, not the 90’s.
No theory of AGW accounts for the satellites which largely agree with the non-urban well sited stations, none of which show warming where the AGW say it should be happening. It can’t be seen because it isn’t happening, the AGWers are self deluded at best and liars at worst.
As for Wratt, the best explanation for a person’s work agreeing with known frauds is that their work is similarly fraudulent, and again self-deception at best.
What you claim is obvious is not, you need to show your work.
http://scienceandpublicpolicy.org/images/stories/papers/originals/Monckton-Caught%20Green-Handed%20Climategate%20Scandal.pdf
Careful, you will be banned!
You are logically inconsistent first you say current warming is happening but is natural, then you say it isn’t.
Make up your mind.
The satellites show warming.
Non-urban weather stations show warming.
You are either self deluded or a liar which is it?
Methinks the deniers are now attempting to distract attention from the walloping Gareth et. al. have been giving them over the bogus claims from NZC”S”C…
Spotting the forest from the trees.
So Roger (and other misinformed).
1. Is sealevel rising? (sealevel.colorado.edu for a hint). Or do you somehow
believe that this is manipulated by conspiracy theorists too?
If sea level is rising, then where is the water coming from?
Convention answer – thermal expansion and loss of ice from ice sheets and glaciers. Ok, some people dont accept that oceans are warming. That means even more ice loss to make up the mass balance.
Now if we arent warming then why are they melting?
Your completely ill-informed comments about CRU are irrelevent to this. Irrelevent to MSU measurements (unless you think Christy and Spencer are warmist moles), and irrelevent to GISTEMP.
We are warming – the long term indicators like ice level and sealevel are unequivacal.
Is it due to CO2?
Well lets see a published theory that is physically reasonable which explain:
– a warming troposphere and cooling stratosphere (when corrected for O3 loss)
– milder winters and higher minimum night time temperatures
– amplified warming of arctic with respect to tropics and static Antarctic
And tdperk you are making assertions about 30s warming, MWP etc that are patently and demonstrably false. Try checking the science instead of misinformation sites. Your aspersion on Wratt cross the boundary into libel as it is also demostrated that NIWA’s work is not fraud.
So Roger are you actually interested in truth or are you mostly interested in spreading misinformaiton and creating doubt to prevent some kind of mitigation measure?
Sea level is rising very slowly as it has done for decades. It is due in part to thermal expansion and in part, a smaller part, to melting land based ice. In may parts of the world glacial rebound, in both directions, and tectonism are of greater amplitude that eustatic sea level change. All are masked by atmospheric pressure changes which will change the local sea level 10 mm per millibar of pressure change. Routinely atmospheric pressure swings between 970 and 1030 millibars. That is quite a lot of local sea level change due to atmospheric pressure alone. Then there is the effect of wind.
The Argos buoys show that the oceanic temperature is far more variable than previously thought. That suggests that there is considerable heating effect from ocean bottom sources, presumeably the mid oceanic ridges.
Are you continuing to deny mediaeval warming in the face of historical evidence?
Roger – first I dont claim that you accused Wratt of fraud. tdperk appear to.
Your comments on sealevel change are laughable. The longer term millenial rate of sealevel rise is 0.2. The change to 1.7m and then to over 3 is certainly a concern. Global sealevel rise measurement has nothing to do with local atmospheric pressure changes – they are noise in the system. The science of sealevel measure is well explained on that site. It would appear your post is nothing more than and attempt to create some reassuring doubt in mind of readers. However I am relieved to hear you accept both thermal expansion (ie the oceans are warming) and ice melt (also temperatures rising. Thermal expansion implies NET temperature increase as I am sure you know whatever the internal variability. Again, the idea of “considerable” heating from below is laughable. Right. Temperature on what percentage of ocean are hot? Thermal flux from bottom is measured in milliwatts over a square kilometer area. Thermal flux from about is measured in watts. Do really expect us to believe that you dont know this?
Sure parts of Europe were warm in mediavel time. Was the world warm then? no. Not here. Not in antartica etc. Again no shortage of science papers on this, only a shortage of denialists reading them.
Unfortunately I am off internet for some days. Look forward to continued debate later.
I did not accuse Wratt of fraud.
Roger, Gareth is away for a few days and has asked me to keep an eye on the comments. I suggest you rein in. I’ve snipped some of this. Bryan
Kivivet, your comments about Kelburn are wrong and inane. Go and learn some Meteorology 101. As for tdperk and Dewhurst and your lies and smears – you have my utter contempt.
What better commendation than your contempt!
I like this quote from a newspaper:
27. “The Earth is 4.5 billion years old and we only have good data for 50/100 yearsâ€. Actually, I would argue that we don’t even have GOOD data for that long, but that’s an argument for another day, and, let’s face it, this is dragging on a bit. I’m sure there are multitudes of arguments for the TREMENDOUS accuracy of the width and diameters of tree rings, the analysis of carbon in fossilized sediment, the reading of ancient tea leaves, and whatever other measures are used to “prove†AGW. The fact is, the accuracy of SOME of your data doesn’t matter if you’re on record for making up other data, excluding data you don’t agree with, and doing statistical and computer model manipulation to get the answers you started out wanting.
You can find it here:
http://www.dailyexpress.co.uk/posts/view/143573
Dear Roger Astroturf,
To argue convincingly against AGW you must not only produce an alternative theory to explain the observed warming, but also one that counteracts the GHG energy absorption that quantum physics requires.
As far as I know, no one has even begun such a project.
Q: Do you accept quantum physics and, if not, how do you believe you are reading this?
Magic, perhaps?
As far as I know, no one has even begun such a project.
But then you know nothing as might be expected in the case of a retired teacher of English in some secondary school.
Roger, I think you may be confusing Rob with me, the know-nothing retired teacher of English. It gives you a chance to resort to the silly personal abuse which is marking your comments at present, but one thing a retired teacher does know is when behaviour is unacceptable. If you insist on continuing with abusive remarks I will exclude you from the discussion.
Possibly!
Roger, you are truly an Inhofe (an empty-headed denier who can’t even fact-check his abusive comments).
“If you insist on continuing with abusive remarks I will exclude you from the discussion.”
To be fair are you thinking of excluding yourself?
For those who missed it: an entertaining look at the membership and beliefs of that weird and wacky Stone Age family, the NZ Climate “Science” Coalition!
http://www.critic.co.nz/about/features/53
Gentlemen, you do yourself a dis-service by abusing and ridiculing everyone with an alternative view point.
Open your eyes, and allow yourself to at least consider an opposing point of view. You may find that the end of the world isn’t as close as you think 😉
This is not about points of view, it is about Science. Facts. Observations. Hypotheses/formulae/models which make useful, testable predictions which are then validated against the real world. You may find most of the counter-arguments you have put forth would be quite well covered in a climate change history book.
Samv, finally a voice of sanity amongst the madness.
As I have mentioned previously, I have no real issue with increasing and decreasing temperature trends. It has been happening for millenia, and will no doubt continue to happen.
I do have issue with people and organisations not being honest and telling the whole story. Treadgold included.
Why do the IPCC not mention Water Vapour as an important GHG.
Why is there such a reluctance amongst some in the scientific community to release raw data and the modelling protocols. What is there to hide?
Does anyone still stand by Al Gore and his ‘Hockey stick’ model, that so succesfully scared people and sold his movie.
It seems that both parties are only too willing to present only the facts that fit their case.
Science will win in the end.
Waiting to be flamed again
“Waiting to be flamed again”
Well you’re sort of asking for it when you repeat the same old memes that have been bandied around and discussed countless times.
“Why do the IPCC not mention Water Vapour as an important GHG.”
They do. They also explain what the difference between CO2 and H2O is. Please read the IPPC report.
“What is there to hide?”
Nothing.
http://www.realclimate.org/index.php/data-sources/
But the discussion is complicated in the details. Often they cannot simply make data public because of legal constraints.
“Al Gore and his ‘Hockey stick’ model”
It’s not his “model”. There is plenty of independent research that show the Hockey Stick behaviour. Again, read the IPCC report.
Really. If you are serious about learning and making up ypur own mind, go and read it.
Frank
Also relevant: Peter Sinclair on Water Vapour
kiwivet, why not try reading some of that history book – a couple of essays will do your understanding a world of good.
On Water Vapour: Tyndall discovered the role of water vapour as a greenhouse gas, in 1859 – 150 years ago! To suggest that the IPCC doesn’t cover them is an argument completely ignoring this history. And it isn’t even true let’s excerpt the Third Annual Report Section entitled “Atmospheric Chemistry and Greenhouse Gases”: Introduction;
You are right that trends have gone up and down in the past. However, through scientific investigation we have quantified them – whether it’s the forcing orbital fluctuations triggering ice ages confirmed through the geological record, or the altering of albedo by volcanic eruptions. We know a great deal about what caused these past events.
The hockey stick is not a single report – and Al Gore certainly did not come up with it – it tends to show up in any rigorous temperature reconstruction showing an appropriate time period. Some more information here.
The whole reason for the consensus, is that all of the facts have been reconciled, avenues explored – and it makes sense. Are you sure that: 1 the contrary viewpoints are actually based on “facts” not opinions, and that 2 there isn’t an explanation for the fact in the standard model. Science often ends up with counter-intuitive results. Why does a warm bucket of water freeze faster than a cold bucket? Might seem counter-intuitive, but there is an explanation that does not challenge the standard model of temperature and energy.
Scientology not science! And fiddling the data. And suppressing papers to journals etc etc. You have a very odd idea of what science is.
kiwivet
We and all intelligent, honest sceptical [as opposed to skeptics / pseudo-sceptics] people do not consider lying and distorting what others have said to be acceptable. Honest people are entitled to alternative views, but evidence is evidence while rhetoric and lies are not evidence. No amount of rhetoric or lies will convince me that gravity, or evolution or AGW don’t exist.
You would be well advised to read your own words and then eat your hat.
Kiwivet, if you and your ilk are unable rationally explain, defend and justify your “alternative point of view”, then it is worthless, mere hearsay and ideological bullshit.
As all deniers’ arguments seem to melt away under scrutiny, but are then endlessly recycled in new fora, is it any wonder that many, including myself, see you as mere propagandists who seek only to sow confusion?
Real science is an adversarial process, not unlike a court of law that seeks to uncover truths about the Universe. Treadgold’s incompetent analysis is a classic of denialist pseudoscience and reduces NZC”S”C to a laughing stock.
“Gentlemen, you do yourself a dis-service by abusing and ridiculing everyone with an alternative view point.
Open your eyes, and allow yourself to at least consider an opposing point of view. You may find that the end of the world isn’t as close as you think ;-)”
The sad fact is KV that we HAVE considered the opposing view and it is found to be wanting scientifically both theoretically and experientially. The Earth is warming – no doubt about it!
The end of the world may be closer than YOU think KV.
Go and read some literature on just what the effects of increasing temperature will be! You say earlier that you wouldn’t mind seeing it 5 degrees warmer in Wellington. Most of Wellington would be inundated with such a rise!
The climate warms and cools naturally. It always has. It warmed after the Little Ice Age. If it had not the people who are fussed over carbon dioxide would be clamouring to put more of it in the atmosphere. I am not persuaded that carbon dioxide is a cause of climate warming. I am more inclined to accept the proposition that climatic warming results in an increase of atmospheric carbon dioxide. Just think of the amount of carbon dioxide that enabled the growth of the carboniferous forests and the amount of carbon fixed in the chalk of southern England and north west Europe. Atmospheric carbon dioxide levels are now low enough to limit the growth of many plants. I might be open to persuasion that the climate is, in general, warming slightly but I am more inclined to think that the shortage of sun spots points to a coming cooling trend. Even in historical times we have experienced climates warmer than the present and those times were far from catastrophic. Of course some of the interglacials were warm enough to support a tropical fauna in Britain. For these reasons I am not persuadable that future warming, if it happens, will be a disaster. Rather the reverse, we will be better off with a warmer climate. Our fear should be of the next ice age and where the populations of the temperate north will go when the ice sheets creep south.
Why do you think anyone in interested in your complete nonsense and unreferenced assertions?
You’d prefer to believe in sunspots, even though there is no correlation between them and temperatures, or between them and a missing climate forcing, and no mechanism for their action has been demonstrated?
The cycle of Ice Ages is well understood … and at the rate we’re going, the forcing from the COâ‚‚ Greenhouse effect will outweigh that from the Milankovich orbital variations. The next ice age could simply not come – in these reflective million-year timescales you bandy about, you’ll realise that ice age glaciation is a relatively recent thing.
Have you not heard of the Dalton and Maunder minima?
If you have not I suppose you do not know what they correlate with.
You know what Roger, I know what you’re talking about, and I know why it’s bunk.
(replying to an edited-out retort about “childish drivel”) Anyway, me childish? You’re the one who can’t control their Gratuitous Exclamation Marks:
A pity you are unable to distinguish between data and fiddled data. When you learn to be a bit more selective and not accept as gospel what is merely propaganda you might have something useful to say.
From the Telegraph. Just a reminders of what your (fallen) idols have been about:
“Already one respected US climate scientist, Dr Eduardo Zorita, has called for Dr Mann and Dr Jones to be barred from any further participation in the IPCC. Even our own George Monbiot, horrified at finding how he has been betrayed by the supposed experts he has been revering and citing for so long, has called for Dr Jones to step down as head of the CRU. ”
http://www.telegraph.co.uk/comment/columnists/christopherbooker/6679082/Climate-change-this-is-the-worst-scientific-scandal-of-our-generation.html
Changing the topic again, because you know that the data does not support your case.
You might think I can’t distinguish between fiddled and non-fiddled. Fine. At least I can cite it; all you do is rant and wave your hands.
Tell that to the the IPCC…
(figure 2.5)
http://rivernet.ncsu.edu/courselocker/PaleoClimate/Radiative%20Forcing%20Chapter2.pdf
Look at the scale. The irradiance varies between 1367 and 1368 W/m². As it notes in the text immediately below, “area and albedo effects” make the solar forcing 0.175 the irradiance, so this is something like a 0.175W/m² forcing, max. Significant, but not enough of a rise to explain the modern temperature trend.
For comparison, GHG forcing is estimated at 2.43W/m² ± 10%
What a complete load of twaddle. Go and look at NOAA or NASA or the Royal Society for some information instead of Youtube.
An interesting viewpoint. I had not thought of this one!
You can link to it if you wish, but not reproduce it in full. Bryan
There is no link available. It was an email sent to me. Why deprive your readers of a little entertainment?
This is not a denialist website. You are welcome to comment on what is under discussion, but not to introduce swathes of material of that nature. Gareth has generously given you a place of your own where you can do that. I’ve deleted it again. If you try to replace it I will restrict you to your den. Bryan
Prof Mann has thrown Prof Jones under the bus..
(gratuitous insulting terms snipped – Bryan)
http://tinyurl.com/yg6za63
Meanwhile Al Gore has canceled his Copenhagen lecture. 3000 people who have paid up to $1209 to shake his hand and/or listen to the lecture will presumably be reimbursed.
Note this is a translation.
http://www.berlingske.dk/klima/al-gore-aflyser-foredrag-under-cop15
JC
Perhaps you could try being a bit more even handed in dealing with gratuitous insults.
Roger, you regurgitate the same old recycled denialist memes over and over again.
Do you ever think for yourself, or even read replies to your own posts?
Anyone interested can find Roger’s myths debunked here:
http://www.skepticalscience.com/
Debunked by idiots!!!!!!!!!!!!!!!!!!!
No, Roger, debunked by real scientists carrying out actual observations with real instruments and then publishing papers in genuine peer-reviewed journals.
The absence of any of these on the denialist side is blindingly obvious.
Hey, my keyboard repeat works too…
You are a fool!!!!!!!!!!!!!!!!!!!!!!!!!!!!!!!!!!!!!!!!!!!!!!!!!
Roger, your exchanges are both intemperate and lacking in content. I am exhausted by having to monitor them. For the remainder of my period of duty you can only comment from your den site. You can complain at your treatment to Gareth when he returns, but I’ve had enough.
Bryan
http://tinyurl.com/yg6za63
Roger is confined to his assigned place for the rest of my period of duty as comments monitor.
These sceptics are all class, aren’t they?
“Attempts have been made to break into the offices of one of Canada’s leading climate scientists, it was revealed yesterday. The victim was Andrew Weaver, a University of Victoria scientist and a key contributor to the work of the Inter-governmental Panel on Climate Change (IPCC). In one incident, an old computer was stolen and papers were disturbed.” (From today’s Guardian).
In a similar vein, physicist Robert Park comments in his “What’s New” posting today:
“When the ClimateGate story broke I immediately began digging through piles of paper on my desk to find my copy of “Doubt Is Their Product: How Industry’s Assault on Science Threatens Your Health,” a 2008 book by David Michaels, an epidemiologist at the George Washington University School of Public Health.
When scientific evidence of a threat to public health becomes overwhelming, government intervention can still be delayed for
years by simply manufacturing uncertainty.
That’s where of the global warming debate is right now. The fossil fuel industry is doing a job on us.”
That’s where of the global warming debate is right now. The fossil fuel industry is doing a job on us.â€
Rubbish. The oil companies are rubbing their hands with glee at your antics and making money from the subsidies on wind power and the like.
Lest I be misunderstood, let me quote a little more from Bob Park on “Climategate”:
“There were a few embarrassing comments about global warming
deniers in a mountain of e-mails. I would hate to see some of my private e-mails on the web.
The suffix was added to invite comparisons to the infamous break-in at the Watergate Hotel by Nixon’s goons, but in this story the unnamed burglars are treated as heroes. No one wrote even a line about what was probably the only criminal offense in this sordid affair: hacking into private files.
All that’s left is to figure out who paid for the break-in. That book has already been written.”
http://bobpark.physics.umd.edu/bob.html
Err…is this all about this site:
http://wattsupwiththat.com/2009/12/06/how-not-to-measure-temperature-part-92-surrounded-by-science/#more-13789
in which case – the site move probably did put the site closer to an asphalt car park and various parked cars – so it most likely wasn’t colder after the move even though it was higher. Comments?
Was just sent this, which appeared as a comment at RealClimate (where Hokitika also got a mention). Seems someone had the time to bother looking it up. Go Phil Felton.
——————————————————————————-
Phil. Felton says:
15 December 2009 at 11:11 AM
It took me less than 5 mins to find out that at Hokitika South the ’screen’ was changed in 1912 accompanied by a significant drop in measured temperature, in 1943 the screen was found to be in bad repair and ‘the instruments’ moved to a new site (Hokitika Southside), in 1963 the station was closed down and future measurements were made at the new station at Hokitika Aeroport. Plenty of reasons for adjustments there!
[Response (from Gavin Schmidt) : Plus, I looked at the GISTEMP data…. and there is no adjustment down because the changes are not in the GHCN homogeneity adjustments. They are in the NIWA adjustments though. So whether they are or are not justified, this issue has bog all to do with GISTEMP. If anything, it means that GISTEMP is underplaying warming in that region. – gavin]
“Did you miss it? The big lie? There are no reasons for any large corrections. That’s it, there. And it’s a lie because the NZ CSC has known for at least three years why adjustments have been made to certain stations.”
Wishart and the NZCSC are claiming that NIWA do not have records of the adjustments (see link below). So who is lying? Do you have egg on your face again Gareth for trusting what your buds at Niwa told you or are Wishart and NZCSC mistaken?
http://briefingroom.typepad.com/the_briefing_room/2010/02/breaking-news-niwa-reveals-nz-original-climate-data-missing.html#comments
If NIWA hasn’t kept “worksheets” from the 1970s & 80s (before NIWA existed in its current form), are we surprised? Not much shock horror there.
NIWA is going to to post all temp data and adjustments soon. No doubt Treadgold and his pals will find something to complain about, and continue their revolting and ignorant smear campaign.
Yes, I understand there have been changes at virtually all New Zealand temp stations. This may include the 11 which didn’t need adjustments to show warming?
So what makes you sure that NIWA’s 1990 adjustments to the 1943 raw data at Hokitika were objective and accurate – or even had the right sign?
“So what makes you sure that NIWA’s 1990 adjustments to the 1943 raw data at Hokitika were objective and accurate – or even had the right sign?”
You have the raw data, the papers on methodology. You do it. Question, in light of all the indexes indicating warming, why are you so sure NIWA is not to be trusted?
Okay. You don’t know. Nor does anybody else.
Australis, IMHO you are wasting your time grasping at meaningless straws. If you want to worry about something, make it something real – like this:
http://www.sciencedaily.com/releases/2010/02/100209191445.htm
“Temps before the mid-20s were recorded at Thorndon, near sea level, but then the recording station moved to Kelburn at 125 m above sea level. It’s pretty basic meteorology that temperatures fall as you move above sea level”
Yes, but only if all other things are kept equal. In fact it is likely slightly warmer in Kelburn than down near the waterfront if only because the met station there is on a lovely sunny north facing slope with prevailing wind speeds moderated somewhat by surrounding trees,
In Thorndon you have wind driven sea spray evaporating and lowering temperatures still further, and the sun setting behind the hill far earlier each day, meaning less heat can be absorbed & re radiated by the surroundings. If anything temperatures in Kelburn should have been adjusted DOWNWARDS not upwards.
You have no idea of what you’re talking about. It is a simply documented fact that Kelburn is considerably cooler than sea-level or near-sea level station locations in Wellington, by an amount consistent with standard theory. Kelburn does not enjoy some enhancement of its temperatures atypical of its altitude. Incidentally, Kelburn means are 0.8C below those at the airport.
I could alert one or two of the scientists who were involved in this work of your wildly inaccurate speculations, but I don’t think they would consider it worth their time and trouble to respond – understandably so.
I have live in both locations
Before I say too much more, where is your evidence?
I would have to wonder just how you would justify any assertion that all things being equal loss of sunlight significantly earlier in the day could magically leave average temperatures unchanged compared with unshaded locations.
Anywhere else in the world micro climactic influences have a very significant impact compared with the affect from only125m difference in altitude – exactly the reason that data from sampling station contexts than have changed over time is questioned – by both sides in the debate.
By what mechanism are Kelburn and Thorndon rendered immune from micro climatic changes and differences?
I’m not going to waste my time and reinvent wheels by doing your research for you. If you want to waste some time, contact Dr A B Mullan at NIWA. Don’t be surprised if you get short shrift. If you seriously think your investigations will validate the tripe peddled by Treadgold and his acolytes, you’ll be disappointed at the outcome.
I do not want you to do “my research” for me – there is no need as it is not my case to prove. I am not the one making or defending scientific claims.
I simply noticed what seems a flaw in the case as presented in the article. Your reaction to this so far seems to consist mostly of hostile appeals to authority, which sheds little explanatory light on the subject.
A quick review of the the wiki article on micro climate describes for example temperature variations in San Francisco of as much as 5 degrees – between city blocks!
At best, in ideal conditions an increase in altitude of 125 meters might be expected to increase temperatures by a bit less than a degree – assuming otherwise *identical* micro climates – which is clearly not the case if you know Wellington at all. The noise generated by micro climatic influences in other words could easily be larger than the signal. – any attempt to justify substitution of one monitoring station for a proxy must overcome this objection. So far it appears you have not done so.
I’lll give you a slight start on your odyssey – not that you deserve it. Read the subsection on Wellington (and the other places while you’re at it, if you want to learn something). If you fancy yourself as sufficiently expert to dispute the conclusions, you’d better take your chances with the person I mentioned.
http://www.niwa.co.nz/our-science/climate/news/all/nz-temp-record/seven-station-series-temperature-data
I would like to read the subsection on Wellington, but the links to the PDF documents describing NIWA methodology don’t work for me – I just get a perpetual “contacting…” message.
With my interest now piqued anyway, some Google searching put me on to this Richard Treadgold chap (I had never heard of him before) – so it seems at least I am not the only one to notice the issue of micro climate.
But again, neither he or I need to be sufficiently “expert” to successfully dispute an expert NIWA conclusion –
NIWA may well be right, but if the case presented cannot be articulated sufficiently convincingly to an intelligent layperson (which I fancy that I am), then either the case is indeed flawed, or needs to reformulated if convincing the public is of interest.
You make a good point in the last paragraph. So many academic types may be able to communicate with each other but communicating with the public is another matter.
AP, regarding your final paragraph. Logically speaking there is a third possibility: your intellectual capabilities may be more fancy than fact. It can happen to the best of us. That is why it is essential to base decision-making on peer-reviewed research published in the highest-quality international scientific journals. Nature and Science are good places to start.
AP, I am not sure what your problem is with actually reading the paper published by NIWA??
http://www.niwa.co.nz/__data/assets/pdf_file/0007/108889/Wellington_CompositeTemperatureSeries_13Dec2010_FINAL.pdf
It seems you suggest that the observed and carefully correlated values between the two stations as represented in the NIWA report are somehow false?
The actual observed data as you can clearly see yourself suggest that the temperature adjustment is fully justified and documented and is the best effort that can be done with scientific means.
Your suggestions however are totally baseless. Where are your data? How can you honestly think that a subjective feeling about the climate at these places has any ability to contribute to this discussion at or beyond the capabilities of taking the actual data and looking at these?
In the end, and this is for you and for anybody who tries so desperately find a hole in the AGW science if you do not like the old data before Kelburn, well erase them from the discussion for goodness sake and look just at the development of temperatures since Kelburn.
Incidentally, it would not surprise me at all if the airport was warmer than Kelburn – there is even less shade between the sun and that huge expanse of heat absorbing tarmac – on top of influence of higher air pressure.
Altitude is only ONE factor influencing temperature, – others include differences in wind patterns, differences in albedo, differences in hours of sunlight, differences in thermal response of materials, differences in moisture and evaporation etc. Differences resulting from change in height of 500-1000 meters for sure might stand out from the noise, but 125?… nope. Not unless all other conditions were somehow near identical
What is the difference between Thorndon and the airport?
Do you know what a Stevenson screen is, ArchPrime? Funnily enough, you are not the first person to think that local effects of shade, wind, precipitation etc might have an effect on weather readings. The Stevenson screen was designed in the 19th century to avoid the effects you are talking about. Modern automatic stations also provide the same protection against immediate elements, so the temperature readings from these stations can be directly compared, and will show differences due to lapse rate.
As to the Wellington stations, each station move is documented here. The overlap between Thorndon and Kelburn did show a difference that was close to that predicted by the lapse rate, but the length of the overlap was too short to be reliable, which is why comparisons to other stations were used to determine the actual offset to use.
Amusingly, this guy’s description of the Thorndon environment shows that he has no idea where the station was. Another Johnny-come-lately who thinks he can upstage expertise. I wonder if this is a sign that Fools’Gold is about to revitalise his lawsuit intentions?
Probably you can add the colour of the concrete to that!
A Stevenson screen is a double louvered wooden box that allows air flow but prevents the sun shinning directly on the thermometer. The box must be 1.2 to 2 metres above the ground on an area of grass at least 16 square metres, and not overshadowed by trees or buildings. So bollocks to your hypothesis about the concrete.
AP: http://en.wikipedia.org/wiki/Lapse_rate
Keyword: Adiabatic labs rate.
At Wellington some middle between the DALR and MALR would apply, the -0.8 or so figure being already suggest by theory alone.
This started in November 2009. Scraping the bottom of the barrel a wee bit are we not?
I agree, Roger. You sceptics really are scraping the bottom of the barrel.
I presume all those less-than-civil replies since my comment were directed at me?
If so, how disappointing.
I spot what seemed a flaw in an article, and I am instantly part of some skeptical conspiracy to “upstage expertise”?
I am well aware of the Thorndon environment, having lived there.
I understand the thermometer was roughly where the rail yards are now.
If anybody here purports to claim, with a straight face that Stevenson screens eliminate all micro climatic influences, how else would you explain differences in readings taken at the same altitude within any region?
My point was valid – to justify a proxy that is not close by, you need to demonstrate no micro climactic differences. A thermometer in an environment receiving more sunshine hours will measure temperature of air that has passed by and thus thermally interacted with warmer surroundings. Just as air that is slower moving can spend more time in either colder or warmer surroundings before reaching the thermometer.
I don’t claim to know the extent of this affect in this case in relation to other affects but I do know micro climate can indeed be significant. I very much doubt even your vaunted experts would support your denial of this.
That said, thanks to the now working links to NIWA PDF documents describing methodology posted above, I was able to follow up on the methodology used by NIWA in the Thorndon case, and I actually don’t think (as an intelligent lay person) that it was that unreasonable – because there does seem to enough consistency with other stations that would justify the offset used.
The small difference between this offset and the theoretical difference that would be explained by altitude alone might thus represent the impact of microclimate between these locations.
There is a world of difference between being persuaded by evidence presented by experts, and just believing because the experts said it was so. To take sides or argue solely on the basis that somebody else has peer reviewed papers published is by definition a logical fallacy – an appeal to authority
Further, while peer review is a valuable process and is good at filtering out deviations from accepted wisdom, it is not so quick at filtering out fallacies in the consensus view.
If I wanted to question the existence of God for example, the self described “experts” in the field are theologians and the clergy – so by all means I would listen to their evidence and arguments, but at the end of the day, if the issue was important enough I would be remiss if failed to set aside the “authority” of the experts and to use my own critical faculties to assess the information presented
If you are talking about my post above, that was directed at Dewhurst’s puerile interjection, not you.
In your original post, you mentioned some weather effects that most certainly are mitigated by weather instruments (e.g. direct sunlight in Kelburn, wind-blown sea spray in Thorndon). If you believe that there are other micro-climatic influences that the instruments are not capable of avoiding, please do present some evidence – and not just “I’ve lived in Thorndon”. Instrumental evidence is much more reliable than personal anecdote.
Just to add some more background – Salinger established a network of stations around Wellington city and environs in the 1980s, at a variety of altitudes and exposures. The results were consistent with lapse rates, and Kelburn’s numbers (predictably) looked sensible against the other range of values.
AP sounds just like a “concern troll” whose aim has been to dig over ground that has already been exhaustively tilled, in order to waste everyone’s time – with an idiotic hypothesis about the relative warmth of Thorndon and Kelburn to savour. Perhaps he is another stalking-horse for Treadgold – or another sock puppet.
As for Dewhurst – senility is clearly irreversible in his case.
“or another sock puppet”
But which one?. Kinda sounds like the guy who was on a donkey in Guatemala and had problems accessing the internet.
Ah, yes, ‘James’ – who arrived with a posse, one of whom apparently could not distinguish (based on his remarkable performance here) between the function of the speedometer and odometer is a car! And who was then taken hostage by bandits in Burkina Faso, was what I heard, but you may well be right! Leastways they cruelly deprived him of internet access at a crucial time, the fiends!..
What was truly funny, IIRC, was that he was heralded by what I can only assume was a ‘herald’ concern troll, who popped up talking about how it was one thing to demolish most average contrarian arguments, but then there are the serious ‘skeptic’ debaters who one really had to watch out for; namely the said ‘James’. He may well have duffed us up a treat, apparently.
His performance upon his subsequent arrival, however, turned out to be the very essence of Bathos, culminating in his tragic kidnapping. The whole risible episode would merit a Psych PhD thesis or a call-out box in the DSM V!
Is it just me, or has the temperate stations siting thing been done to death already? Whatever did happen to the surfacestations project? Didn’t the preliminary results actually start resembling that now-devil-incarnate Muller’s BEST project – i.e. wow! the actual scientists were right after all; who’d’a’thunkit? – so Watts and co. have had to resort to losing their homework for a couple of years?
And I believe we may have gone over the ‘argument from authority’ thing a couple of times, too 😉 …
RW – I have joined this conversation for the very first time with my first post. No topic been “exhausted” from my perspective, and if it has been for you, you are welcome to refrain from replying to me. If your responses, poor in content but rich in derision and personal attack as they are were representative . it would be too easy to dismiss your views as those of a disaffected crank. Luckily, there are those who are convinced by the case for AGW who are also competent at engaging in rational discussion. I will thus try not to be swayed from acknowledging good arguments submitted your peers, despite the shrill and unpleasant stereotype you seem determined to live up to.
…because that would be an argumentum ad hominem by association, another one of them Logical Fallacies, don’tcha know? 😉
And to call myself out; ‘temperate stations’; good grief! No doubt set up by the Salvos…
However, this is rather an old debate, and can be examined at beginner, intermediate or advanced level (using the same markers as identify MTB trails!) here at Skeptical Science. Complete with links to separate discussions of urban heat islands and microsite influences.
CTG, thank you for your more measured response!
I am certain that temperature fluctuations caused by direct sunlight & shading, precipitation etc falling on thermometers themselves are indeed mitigated by their enclosures. But the moving volume of air that the thermometer is measuring is not so shielded before it reaches the enclosure. As far as I know, there is little serious debate on this, and this is exactly the reason that temperature stations are sited wherever possible well above the ground and in contexts where there are not local variations introduced by concentrations of dark coloured thermal mass (heat island affect), locally slowed or accelerated wind flows, episodes of uncharacteristic high or low humidity, shading of large areas etc. that are unrepresentative of the region as a whole.
Quite correct, measurement trumps anecdotal evidence – which is why I was happy to acknowledge that the NIWA methodology made sense to me, at least once the PDFs describing it became available (presume server maintenance was under way previously)
I mention that I know Thorndon, because I also know from my time there that the sun rises late and sets early in Thorndon, cooling a large area over which air can thermally interact.before reaching any thermometer – meaning the temperature cycles throughout each day would be more abrupt than for the same thermometer set on completely open topography If the prevailing wind blows from the sea rather than the land, this affect would obviously be reduced,
OMG! No site is perfect, each site is a SAMPLE. It would be impossible to do a census of temperature for Wellington.
Over time it gives an indication of the surrounding conditions. Furthermore and most importantly from the climate scientists point of view is the trend of the recorded data. In this case the trend is a statistically significant increase in temperatures recorded.
Yes, you are quite right ArchPrime, it is those broader scale differences that need to be taken into consideration when combining the records of two different locations to make a composite series. If there is a long period of overlap (one year or more), then the two series themselves can be used for the comparison. It needs to be a fairly long period to average out the micro-climate effects you have talked about – if you just used a few days of comparison, then you might get a false picture because of particular conditions that prevailed on those days.
In the case of Kelburn and Thorndon, there is only one month of overlap (Dec 1927), during which Thorndon average 1°C warmer than Kelburn, a little more than might be expected from adiabatic lapse rate. So the two series were compared against other sites around NZ which have a long period of overlap with both. In these comparisons, Thorndon comes out consistently warmer than Kelburn, with a range of 0.73 to 1.16°C. The average is 0.89°C, with agrees well with the ALR estimate. This all gives a pretty strong indication that the dominant difference between Kelburn and Thorndon is indeed the ALR effect due to the altitude difference, rather than any other micro-climatic influence.
All this goes to show that Treadgold’s approach of simply stitching the two series together – and in particular, calculating the Thorndon anomalies using the Kelburn climatology – is completely invalid.
“ArchPrime” is kind enough to provide a link to his website, which has contact details (including phone number) prominently displayed.
It seems a little off-colour to refer to him as a “sock-puppet”, regardless of whether you agree with his technical analysis.
ArchPrime – thanks for the compliments. Time you declared yourself – here are some choices for you:
(1) We’re cooling, or not warming
(2) We’re warming, but human activity has little or nothing to do with it
(3) AGW is a reality.
What do you think of Watts, Monckton, Carter, Plimer, Wishart, Ring (!)?
If you can’t make any choices or voice an opinion on these, I suggest you go away and do a lot of reading and research.
Some of us have busy enough lives as it is, without endlessly re-litigating old issues. Bill has put it perfectly.
My understanding is that ArchPrime is arguing about ONE weather station.
What have his opinions of Monckton, Ken Ring, Plimer etc got to do with anything? Oh, is he “tone-trolling” to sneak in some Big-Oil funded trolls through the back door?
Why don’t you ask him his views on ID/Creationism, anti-smoking legislation, moon-landing hoaxes, 9/11 truth movement, whether Osama bin Laden is actually dead or died 8 years ago, Diana’s death, etc etc.
Honestly, any deviation from the “narrative” immediately pigeonholes someone as a nutter or conspiracy theorist.
“My understanding is that ArchPrime is arguing about ONE weather station.”
Exactly and showing a simplistic understanding of the process to boot! An understanding not dissimilar, one might add, to that adopted by previous “concern trolls”. Hence the challenge to come clean. Why should he be so concerned about the statistical results, if it was not to challenge the observed trend? Sure reliability of data is a foundation of science research. But we have been over all this innumerable times and the simple fact remains that what is recorded is that which is recorded. The record speaks for itself. It is consistent with results recorded elsewhere. There really is no debate. To endlessly nit pick and pine for “more “reliable” data such as he seems to desire is fruitless and nonsense.Hence the understandable inference of “concern troll”.
“Some of us have busy enough lives as it is, without endlessly re-litigating old issues.”
Ok, then, why are you even on this blog? the very debate on AGW is a very old issue, with individuals on both sides convinced the arguments of the other are long since debunked. That sort of hardened conviction seems to accompany the intolerance I have witnessed here from some quarters (and on “denier” blogs too), and is unlikely (on either side) to be altered by new or better evidence or argument I suspect.
Convictions on either side too often cease to be about science (though remain dressed in the language of science), and instead become almost a matter of aggressively defending one’s tribal identity against all comers
If my thoughts are so tiresome and distract you from more productive activity, ask yourself why are you responding to me at all?
I repeat, no topic been “exhausted” from my perspective, and if it has been for you, you are very welcome to refrain from replying.
If you want me to pin my colours to the mast:
Firstly I think the science is far from settled, in this and many other fields (if it was settled, scientists would have very little left to do)
Secondly I think on balance it is quite reasonable to assume humans ARE having an affect on climate – affecting both heating and cooling, precipitation patterns, wind flows and ocean currents – to some extent
Thirdly I think on balance that the effort to model our climate is worthwhile and needs to be pursued vigorously, and there are genuine reasons for alarm if the “tipping point/runaway feedback” paradigm bears out, but that the uncertainty in both methodology and assumptions underpinning the models and their forward projections to date leave significantly greater uncertainty in any conclusions than applies to direct measurement of the data they are based on – which on balance does confirm that the earth is warming.
In other words, just because the earth is probably warming doesn’t in any way confirm it is warming via the mechanisms the climate models assume are responsible.. One or two flawed assumptions or oversimplifications amongst the huge array of starting assumptions about either the temperature record, or the feedback mechanisms driving climate is enough to seriously undermine the value of a model – a “consensus” of models that have been tweaked until they fit historic data curves do not equate to genuinely reliable predictive tools.
If climate really is the hugely unstable system it is characterised to be – teetering on a knife edge, with the slight changes humans make (a mere doubling of the trace gas C02 etc) being enough to tip it into dangerous runaway greenhouse feedback amplification, then how has the climate remained as stable as it has over the last many millions of years?
I suspect based on this that the models so far just don’t allow for dampening feedback mechanisms as well as they address positive feedback mechanisms
Even if the warming we have experienced over the last century is all man made, and the balance of models to date predict catastrophe, this in itself is not a reason to panic, or even take unduly expensive precautions.
Development and deployment of alternative energy sources, better resource use efficiencies etc are worth pursuing anyway – and basing this on politicised AGW panic, (on balance of what I have seen to date) may well ultimately discredit the environmental movement, and any efforts to wean ourselves from fossil fuels
AP, thanks for coming clean. No need to go further here. Improved understanding of climate science can be obtained easily enough at http://www.skepticalscience.com. Start with the button, “Newcomers, start here”. If you read with the intent of learning, you will soon see that most of your concerns are ill-informed.
You try to give the impression that you are exploring the subject of AGW, no topic been “exhausted” from my perspective
And then go on to repeat denier talking points.
Take Mike’s advice, go and do some reading.
I come to this forum to read new things – Gareth and friends do an admirable job of tracking interesting news. I don’t come here to read endless rewordings of discredited notions. The least you can do is what Mike Palin has just suggested – learn something first. It would be a bad look if some total newcomer could wander into this thread and perhaps infer from your musings that the basis of Treadgold’s claims about the temperature record might have some soundness – thus the tedious necessity of a number of people replying to your unfounded initial claim.
RW You come to read new things, yet here you find yourself spending much time on an old thread, defending that which is sufficiently self evident that it needs no defence,but nevertheless ensuring you have the last word – on the off chance that amongst the huge amount of noise emitted across the spectrum on this topic, my tiresome musings might corrupt some innocent mind?
Wow.
And yes I have read a fair bit from skepticalscience.com – and others. Hence my repetition of “denier” talking points.
Then it would seem that you need to read more of it, instead of trying to ensure that you get the last word on this point.
;D
AP, SkepticalScience is simply a portal and having “read a fair bit” is not the same as reading with the intent to learn. When you read with the intent to learn, you follow the many links provided there to the primary peer-reviewed scientific literature dealing with anthropogenic climate change and build your understanding from that research base. The fact that you repeat the ill-informed points that you do indicates that you either: 1) have not invested the time and effort to read with the intent to learn, 2) are not intellectually capable of learning, or 3) deny what you could otherwise have learned.
By the way, scientists do not argue from authority, they argue from evidence. In the case of climate science, the evidence comes from many fields and in many forms including multiple overlapping records of ancient climate, physical models of global climate, observed changes in sea level and water composition, and, yes, point source records of modern climate. The mainstream view of the anthropogenic influence on climate is built on this overwhelmingly consistent evidence. To ignore this is – well, I’m sorry to say – stupid.
Sorry Mike, I am obviously not being clear.
I think, based on my reading to date that AGW is likely happening.
Is this the bit that demonstrates my laziness, lack of learning or lack of comprehension?
Or is it the bit where I think that the science is probably not settled – i.e at a point where everything is fully understood, there is no longer anything to learn, no surprises are likely
Even narrowing it down to one of those two options for me would help
AP, I’ll accept your apology for being unclear, whether intentional or otherwise. But I wonder, if you accept the mainstream scientific view of anthropogenic climate change, then why repeat all the misinformation? Where do you want this to go? No matter how far climate science advances, there can never be absolute certainty. In other words, when in an out-of-control vehicle, when do you apply the brake and take evasive action? Is the likelihood of a crash enough or do you wait for the experience?
ArchPrime, you say:
That’s an odd way to characterise the climate system, and not one that I have seen in any actual science. The climate system is usually described as complex rather than unstable. Also, the use of the term “positive feedback” in climate system is often confused by some people. It is likely that the net impact of all the feedback processes (e.g. water vapour, clouds, oceanic release of CO₂/CH₄ etc) is positive, i.e. it will increase warming. However, this does not imply that the climate system will always end up in a runaway feedback process. What happens is that for each successive amount of warming, the additional warming from feedback gets progressively smaller, so you end up at a new equilibrium state (assuming that whatever forcing that was changing stops changing). There is a good description of this process here.
The key to ending up in a new equilibrium state is that the forcing has to stop. For example, at the end of an ice age due to Milankovich cycles, there is a change in solar forcing due to the change in the earth’s orbit. This prompts a feedback loop as CO₂ gets released from the oceans, but the feedback loop dies out, and a new equilibrium takes over.
At the moment, we are applying a forcing by adding more CO₂ to the atmosphere, which in turn will cause feedback loops to add more warming. If we continue to add more and more CO₂, we will keep pushing that feedback loop. Some scientists think that it may be possible to push the feedback loop so far that it doesn’t die out, and then you would see a runaway warming. However, that is very much a minority view, and the consensus view is that a runaway warming is very unlikely even on the worst projected emissions path.
Thanks CTG – that was a well articulated reply, and the equilibrium state change hypothesis does make a great deal more sense to me than the “tipping point=runaway” scenario used by some to justify all sorts of things.
Where I sit is that the sheer complexity of the climate , and the acknowledged “unknown unknowns” do not at all detract from the paradigm, but do suggest that the factors driving equilibrium state changes in each direction , or the points at which they kick in, are far from settled,
I accept that what we currently assume and know and guess points at temperature rises, and that human activity probably does contribute a net forcing (amongst all the other vast natural forcings) , and will continue to do do until the activity ceases.
This however is where I depart company from those who scream for forced constriction of human activity.
.
Outed as a quasi-libertarian of the Wrathall or “John D” kind. How original. Read this next:
http://hot-topic.co.nz/an-immediate-halt-to-co2-emissions-is-an-absolute-necessity/
You’re not serious! Take out ‘Ice Age’ – it’s got cartoon animals!
‘Now really, officer, a mere doubling of the trace amount of alcohol in my blood stream from .04 to .08 – surely that’s no cause for all this fuss?’
Um, eh? That’s quite the non sequitur. What you are apparently saying is ‘I’ve read all the detailed refutations of these points patiently and methodically spelled out over there so you’ve just popped in here to bring them all up again’! Why? How much of a ‘fair bit’ – whatever this vaguest of quantities might be – have you actually read? You’re not perhaps confusing the blog’s name with its orientation, are you?
I suggest you take it all up with them. Or, better yet, actually read all those detailed refutations of the very arguments you’re repeating!
Or try your luck over at RealClimate.
But be warned. These are highly-trained and qualified people who really have heard it all before, and who don’t suffer fools gladly. Others may not necessarily share the level of esteem you apparently reserve for yourself!
Careful, the veneer may be slipping!
Now, this has to be dissembling! That’s logically absurd!
And bringing up ‘expensive’ in this context is a classic example of the world-view of those who know the cost of everything and the value of nothing!
I could go on. If you’re really so much smarter than the actual scientists that frequent the sites we’ve directed you to I suggest you dash over there and prove them wrong! A Nobel prize and the gratitude of millions awaits…
Because, while you may style yourself as a sage above the rash enthusiasms and to-ings and fro-ings of the hoi-polloi it’s just possible that you’re really merely another uninformed blowhard…
Yep – he’s an uninformed blowhard like the rest of the crowd who try to shout down the science – and they all have a highly exaggerated evaluation of their own importance and intellectual capabilities. Best career move for all of them – go into politics.
Bill, it appears from your tone that even the possibility of dissent upsets you,
Sorry about that.
And while in this case I have carefully NOT proposed that I know more about climate than climate scientists, or even anyone here, you appear to need to pigeon hole me as someone who does.
I certainly have no respect for arguments from authority – but that doesn’t discredit climate scientists – it simply discredits those who chose to debate using the fact that one group of climate scientists have more peer agreement than another, rather than describing what makes one side correct.
I have even less respect for those who use personal attack as a debating strategy or who dismiss those they attack as making tired and unoriginal points – rather than offering any original insight themselves.
I must bow to your superior level of aggression, if not your erudite rebuttal.
Exactly what you are rebutting or feel the need to defend I am not certain (presumably not the science anyway), but I hope you feel better now.
“how has the climate remained as stable as it has over the last many millions of years?
No doubt it will surprise you that the Earth has fluctuated from glacial (ice ages) to interglacials over the last few million years. I’d hardly describe that as stable. And that from only small changes in the earth’s orbit around the sun.
Instead of trying to pitch yourself as some kind of modern-day Galileo, how about you actually start reading some actual climate science literature, as others have suggested?.
Indeed it fluctuates to both warmer and colder extrema – and you will note that it keeps on springing back again – i.e. is NOT “runaway” despite a history of much more significant and sustained pushes received than we are giving it.
The Galileo crack is hardly original either – though in answer to yourself & RW, neither Galileo or “originality” are very relevant benchmarks here. – and again, it is precisely BECAUSE I have read a range of climate science literature that I have moved away from the AGW party line.
Or are you suggesting that those who have strayed just need to keep on reading approved literature until they agree again?
Indeed it fluctuates to both warmer and colder extrema – and you will note that it keeps on springing back again – i.e. is NOT “runaway” despite a history of much more significant and sustained pushes received than we are giving it.
As CTG has pointed out, runaway positive feedback is not a likely scenario. You are arguing a strawman. The fact that the Earth changed dramatically during the Pleistocene due to a small change in radiative forcing (orbital variation) shows that the Earth is very sensitive to perturbation.
I have no idea where you get the notion that todays climate change is smaller than that of the Pleistocene cycles, because it can’t originate from the peer-review literature. Warming coming out of the last ice age (glacial maximum) was in the order of 1 °C per 1000 years. We are now warming at the rate of 16°C per 1000 years!.
And note why it (global temperature) keeps “springing back again”, not from mystical magic, but because of
Atmospheric CO2: Principal control knob governing Earth’s temperature – Lacis 2010
Dappled Water
You agree that runaway feedback is unlikely yet conclude I am arguing a straw man? It might help if you identified which bits exactly, of your preferred hypothesis, that you think I am I arguing against?
As to your next point, warming out of the last age averaging in the order of 1 °C per 1000 years in no way implies warming and cooling of 1 °C or more per 100, or even every 10 years did not occur during that period. I would be interested in any evidence in the geologic record that implies temperature change followed consistent and uniform trajectories prior to human direct measurement.
Good link at the end btw. C02 is one of the greenhouse gasses that resists precipitation as temperatures drop, so forms part of the “spring back” process – and I am glad it does. As temperatures rise however, the importance of increasing C02 concentrations falls, to be replaced by water vapour etc (as I understand it- but I am sure you will point out my error)
And then the resulting negative feedback processes like increased pant growth, possibly changes to stratospheric water vapour disposition and other atmospheric & oceanic feedback processes not yet known or understood, and/or the next round of orbital changes, volcanic activity, solar activity changes etc all “spring” things back the other way for a while…and so we bounce along.
I don’t for a second pretend to know more than climate scientists, or refute the processes that most state are in play, and careful reading of my posts to date will confirm this.
I simply think that , as with any other field, that the “truth” will evolve – general principles in play may endure, but the details probably won’t – and the devil is in the details with anything this complex.
Meanwhile humans will adapt to climate change, and will do so with less suffering if infrastructure and economies are strong rather than centrally managed and hobbled by bureaucrats and politicians exploiting AGW fear.
… And yes of course I have libertarian tendencies – no “outing” required ! People tend to (not always, but mostly) innovate, make better choices and manage better lives when personally accountable and allowed to decide more stuff for themselves
“The Galileo crack is hardly original either”
Now you understand how we feel, explaining the basics to someone who proclaims to be well read on the subject, but demonstrates otherwise with each additional post.
Or are you suggesting that those who have strayed just need to keep on reading approved literature until they agree again?
I don’t care how many times you need to read the peer-reviewed literature, but it sure would be dandy if you understood it.
So to understand is to agree?
I have read as more widely than some, but make no claim to mastery of the subject. I simply stumbled across an article, stared reading and was halted at what seemed a questionable assumption about the equivalence of a two ranges of temperature data in Wellington. I was pointed to NIWA methodology that justified that assumption (in my mind), and acknowledged this, while reiterating that micro climate can affect local temperatures (hardly controversial – pretty much true by definition I naively imagined)
Somehow this has invoked the wrath of those of superior intellect and mastery who (with some refreshing exceptions to be fair), demonstrate their mastery through derision and posting of links to other authoritative and cherished blogs where the modus operandi seems to consist mostly of the same sort of thing.
… which approach all by itself provokes me to reply, when I probably should not.
“It might help if you identified which bits exactly, of your preferred hypothesis, that you think I am I arguing against?”
Not my hypothesis, it’s the prevailing view of 97% of the actively publishing climate science community. No need to create a false narrative. Apart from James Hansen (under a scenario where all fossil fuels are burned) which climate scientists ascribe to a runaway positive feedback?. And in which peer-reviewed literature?.
“I would be interested in any evidence in the geologic record that implies temperature change followed consistent and uniform trajectories prior to human direct measurement.”
Another strawman. Have you actually read any of the studies referenced by the IPCC?. Sounds like you’re here to rebunk tired old memes, under the guise of a “freethinker”. We’ve seen it all before you know.
Here’s a simplified version for you:
Sks – The Big Picture
The extreme weather the world is experiencing is only going to get worse as the climate warms, that’s just down to physics. We know from examining the paleo record for instance, that monumental floods occurred in the continental US which dwarf those that have happened in recorded history. It gives some inkling of how bad things “could” become.
Tragic consequences are already set in motion, the mainstream media and people like yourself can continue to lie to yourselves and each other, but eventually even the masses are going to cotton on that the “skeptics” have lead them astray. Every year of delay in curbing carbon dioxide emissions, just means more freakish storms, heatwaves, droughts and floods.
“but make no claim to mastery of the subject”
Forget mastery, how about competence?.You are the one who has formed a view contrary to the overwhelming evidence.
“Somehow this has invoked the wrath of those of superior intellect”
Now, now Archie we’ve seen this ploy before. No need to play the “victim”. We’re just correcting all the misunderstandings you have regarding climate science.
This thread is getting a bit out of sequence (among other things) – I can’t even reply to your most recent post for some reason.
But ok, I will bite, yet again. You obviously do have my number.
I will try one more time: Can you please identify clearly for me specifically which bits of the irrefutable truth I am denying, and why I am wrong? This time without reference to my obvious inferiority of comprehension, my political errors, my devious sceptical motives, the superior authority of your sources, the boringness of repeating yourself to imbeciles who just refuse to see what is so obvious etc etc.
In other words, please don’t live up to the stereotype that prompted me to wonder about the consensus in the first place. (on the basis that anyone who can provoke that sort of vitriol just might be on to something), and please don’t assume I follow your denialist stereotype either
To recap: I have accepted correction as to a seeming issue with a Wellington temperature record, pointing out that microclimate can affect temperature readings, I have acknowledged the AGW hypothesis as likely, based on what we currently understand, and have identified that in general, scientific understanding evolves, and that an unavoidable weakness with modelling extremely complex systems when not all details or principles or properties involved are completely known or understood, is that a single incorrect detail can invalidate the model as a predictive tool, no matter how well they are fitted to past data.
I am aware of no other mathematical model of such complexity that that achieved reliability sufficient to forecast centuries into the future, and fail to see why this should be any different.
So the extent and repercussions of the human input into climate change remain potentially more serious, and potentially less serious than other imperatives – like so much else in life.
Arch “I am aware of no other mathematical model of such complexity that …”
There’s one problem right there. Climate models are physical, not mathematical/statistical.
See “What is the difference between a physics-based model and a statistical model?” on this page, http://www.realclimate.org/index.php/archives/2008/11/faq-on-climate-models/ for more details.
Damn! – I keep being timed out while attempting to correct my comments. Another Warmist plot no doubt
It’s clear that as the AGW “dissenters” grow ever more desperate in the face of overwhelming evidence, they will inevitably resort to playing the “religious authority” card – characterising anyone who quotes anything from that body of evidence as a diehard adherent of a cult. Absolutely preposterous – but the naysayers have backed themselves into a corner, and anything else is preferable to the terrible admission that they’re WRONG. Uness this behaviour changes, history will write them off as having no more integrity than the liars and hucksters employed by the tobacco industry.
Hmm references to “denialist tactics” again…
OK, “another typical warmist tactic”, “as they grow ever more desperate” blah blah ..”now committed, can’t afford to acknowledge emperor not wearing any cothes” blah blah.”history will write them off “blah blah “environmental movement set back years as new data discredits AGW predictions” blah blah …
Have I covered them all yet? Let me know if I am missing anything else you would find convenient in your useful pigeon holing process..
It is sooo much easier and more satisfying to cast aspersions on the tactics, motives , lack of originality, lack of credibility etc of those who you think are wrong than to identify exactly what you disagree with and why
“…than to identify exactly what you disagree with and why”
Several others have already gone into considerable detail about that – can’t you read?
Mike Palin’s last post to you nails it. Go away and bore someone else.
Um, nope – (with a few partial exceptions) they actually haven’t. It would seem MY reading skill isn’t the cause of your problem after all.
You, Dappled Water & Bill in particular seem just determined to represent the screaming skull fraternity – substituting personal attack and derision for anything likely to persuade anybody of anything. demonstrating only arrogance but no no actual insight , comprehension or even opinion of your own about AGW – whether tired & debunked or otherwise. I am sure you must have such, but you are clearly much more stimulation by repeatedly exposing your opinion of me, and what you take to be my “ilk”
This sort of display goes some way to explaining why the valid arguments put forward on AGW are getting lost in the noise.
Hi Adelady. Thankfully, somebody with a point to make. and respectfully!
“Mathematical modelling” isn’t just statistical modelling – it is also physics modelling. In fact by definition, a mathematical model can be any system that is represented by numeric relationships – i.e maths. A climate model as you point out is based on physics – a complex series of mathematical relationships between a large range of physical and non physical parameters is defined, that in principle will describe behaviour resulting from the posited interaction. I agree with everyone here that there is a good level of consensus behind AGW as modelled at the current state of play.
Note to all: this has moved a million miles away from the original topic, and I would ask you to please take the conversation to an open thread — and given it’s been a month since the last: here’s a new one…
I really do wish that the terms sceptic (ever heard the expression “healthy scepticism”?) and crank wouldn’t be used interchangeably willy nilly! In fact, the term “crank” serves no constructive purpose! Even worse is to equate “sceptic” with “liar”. A respectable debate confines itself to the truth or falsity of claims, it does not label the claimants with loaded propaganda terms, or concern itself with their intentions. It just addresses the facts …