 n Ian Wishart’s lexicon, to “ping” someone seems to mean catching them out in a mistake or false claim. It’s a word he’s fond of using in his regular attacks on Hot Topic, most recently over my post on sea ice volume, and a comment thereunder by William “Stoat” Connolley. My post was “bad science” and I’m a “science illiterate” it seems. Unfortunately, all Ian does is demonstrate that his own science literacy is somewhat limited. His ping, like sonar, comes bouncing right back at him…
My post Feel floes (gone by 2016) was mainly concerned with looking at the issue of whether the Arctic sea ice was “recovering” from the record minimum of 2007. Wishart says it is “recovering strongly for the third year in a row”, but the volume data shows that to be nonsense. Wishart’s main bone of contention, however, seems to be about the impact of sea ice reduction on northern hemisphere climate. Here’s his first misdirection:
Gareth, incidentally, tries to argue in reply that volume is relevant because of the heat exchange to the atmosphere involved in re-freezing water.
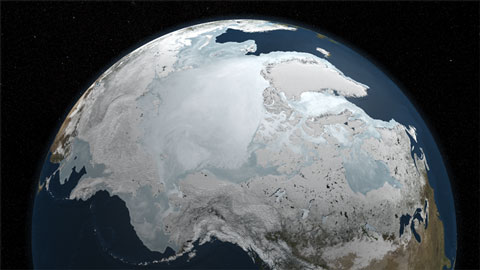
My reply made no mention of volume versus area — I was just pointing out that albedo effects (though important) are not the only climate impact to be expected from a reduction in sea ice. The last three years have averaged around 2 million square kilometres below the average minimum over 79-00. That huge area of ice has to refreeze in autumn, and in so doing releases heat to the atmosphere. It seems Ian doesn’t have the foggiest how much is involved.
But here’s some news that evidently they missed over at HT: when ice grows in volume, it’s because sea water is converting to solid ice, with the same heat exchange taking place in regards to the first six inches of ice, the next six inches of ice, and all the ice thereafter. And sea ice grows because it is freakishly cold, and what little heat is liberated in the process is not strong enough to compensate for the cold.
Read that last sentence again: “what little heat is liberated in the process is not strong enough to compensate for the cold.” Time for today’s lesson. The heat required to warm 1 kg of water by 1ºC is a little over 4,000 Joules. The heat required to melt 1kg of ice is 333,550 Joules (aka the enthalpy of fusion) — about 80 times as much. The same applies in reverse — that is, when 1 kg of water turns to ice, it releases 333 kilojoules of energy. Now consider how much extra heat (compared with the long term average) is being liberated by the formation of 2 million km2 of new ice, which over winter will become about 1.5 metres thick. It’s a very big number indeed — my back of the envelope calculation (corrections and precisions welcome — William?) suggests it’s of the order of 11.5 x 10¹¹ GJ (gigajoules). A big number. Let’s halve it, to allow for ice acting as an insulator. Still more than big enough to show up in the figures for Arctic climate. And it does.
Wishart dislikes Skeptical Science almost as much as Hot Topic (he describes John Cook as my alter ego, which is much more flattering to me than John). There’s a recent post there about a new paper describing the feedback loop between summer sea ice reductions and autumn and winter warming (also at Science News). But there’s an earlier paper to refer to, that I’ve written about before: The emergence of surface-based Arctic amplification by Serreze et al (The Cryosphere, 3, 11–19, 2009 – PDF) who examined Arctic climate data up to 2007 and found them to be “consistent with the emergence of surface-based Arctic amplification associated with declining sea ice extent”. There’s a good discussion of what this is and what it might mean for climate and weather in Mark Serreze’s chapter in last year’s WWF Arctic report, discussed at Hot Topic here. In any event, it’s not news. You might have expected someone as au fait with the literature as Wishart to have been keeping up. Or perhaps not…
Still, I did learn something interesting from his post. He’s finished his “Climategate” revision of Air Con, and apparently this “new edition also contains extensive new information on why ocean acidification is not being caused by CO2“. Oh really? That’ll be news to the oceanographers of the world. An excellent excuse for another look at his “work”, perhaps… ![]()
[The hospital sketch (bonus audio edit)]


