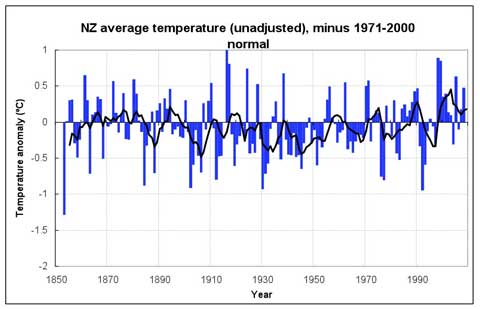
I don’t know whether to laugh or cry. 14 months on from the start of the Treadgold/Climate “Science” Coalition/ACT campaign to cast doubt on the long term New Zealand temperature record, after parliamentary questions, much mud slinging at Jim Salinger and NIWA, legal action, and the expensive and time-wasting reconstruction of a temperature series that’s pretty much identical to the original, diligent digging by Open Parachute/Sciblogs blogger Ken Perrott has revealed a stunning level of statistical incompetence in the “paper” that started it all. Written and published by Richard Treadgold of the Climate Conversation Group, that “paper” contained a graph purporting to show a long term NZ temperature series constructed without adjustments for station moves.

A day or two ago, Treadgold posted a link to the underlying data at his blog, and Perrott — who has been requesting this information for most of the last year — was quick to download it and take a peek “under the hood” of Treadgold’s graph. And what he found was truly remarkable. Treadgold makes no allowances for missing data, makes no attempt to create a valid composite series, simply averages the numbers and plots them on a graph. There are a lot of gaps in the data — especially in the early years — so the “NZ” temperature is in some years just Dunedin, or Dunedin plus Wellington, or Wellington plus Auckland, and so on. Treadgold’s incredible statistical naivete allows him to not just compare apples to oranges, but to feijoas and konini berries as well. The result, of course, is a dog’s breakfast. To make matters worse, he then computed a trend on the data, and announced:
Straight away you can see there’s no slope—either up or down. The temperatures are remarkably constant way back to the 1850s. Of course, the temperature still varies from year to year, but the trend stays level—statistically insignificant at 0.06°C per century since 1850.
A whole political campaign has been constructed on the back of this statistical idiocy. Variations of Treadgold’s claim have been used in questions in Parliament. Valuable scientists’ time and tax payer money has been wasted pursuing his folly. The Climate “Science” Coalition are still desperately trying to keep the issue alive, hoping that if they can create enough smoke everyone will assume there’s a fire somewhere. Unfortunately for Barry Brill and his colleagues, Treadgold’s statistical incompetence undercuts their whole campaign. Do they really think the NZ public and politicians will take the word of a bunch that sling mud and smear scientists, when they are incapable of doing their own simple sums?
Congratulations to Ken for unmasking this fraud. I eagerly await the fulsome apology Treadgold owes to Jim Salinger, NIWA and the public of New Zealand. Perhaps the NZ C”S”C might offer to repay some of the tax payer funds wasted on this affair. But I won’t be holding my breath…
Meanwhile, I think it’s worth repeating the conclusion to my first post on this affair:
None of these cranks should be accorded any respect in future. By their words shall we know them, and their words show them to be ignorant, bullying fools. De Freitas [science advisor to the CSC] should withdraw and apologise, or resign from his post at Auckland University, and if Treadgold, Dunleavy, McShane, Leyland,or any other member of the NZ CSC want to partake in public debate on the subject of climate science, they should expect derision to be heaped on them and their views.
[Update 10/2: Prompted by Manfred’s comment below, I checked back over the original 7SS data and Treadgold’s spreadsheet — as well as with one or two people who might be expected to know  — and it appears that taking a simple average of the annual anomalies in years where some stations reported no data was NIWA’s practise for the original 7 station series. It’s not ideal, particularly in the very early years when there are large gaps in the data, but it’s how it was done. Treadgold was therefore following established practise, in that one respect. I therefore apologise to Richard for echoing that specific allegation without first checking the data. However, this does not get him off the hook for the rest of his “analysis”, nor prompt me to change my overall conclusions. I accused him of “statistical idiocy” and that charge stands — not least because he derives his anomalies by taking unadjusted or raw station data and relating it to a 1971-2000 baseline derived from different stations at different locations using different measurement equipment, and then pretends that he’s made the warming disappear. Tell that to the glaciers…]
[Stone Roses]
Like this:
Like Loading...
 If you think it’s been a warm winter in New Zealand, you’re right. NZ is rapidly approaching the end of a record-breaking winter — the warmest for at least 150 years ((Reliable temperature records in NZ date back to the 1860s.)). Calculations by Auckland climate scientist Jim Salinger show that NZ’s average temperature for June/July/August is running at 9.5ºC, a remarkable 1.2 deg C above the 1971-2000 average, and comfortably ahead of 1998’s old record of 9.3ºC. Commenting on the numbers, Salinger notes the absence of cold snaps in recent months:
 Climate change is happening now and Australia is in the firing line says Jim Salinger in this guest post. This article first appeared in the
  James Hansen’s tour of New Zealand is off to a flying start, with an appearance on
