Dramatic Pictures of Petermann Glacier Ice Loss

Jason Box has provided startling photographs which document the ice area detachment, four times the size of Manhattan Island, that occurred on 4 August, 2010 from the Petermann glacier in northwest Greenland. Photos taken in 2009 are matched with photos of the same area taken on 24 July this year.  Here’s an aerial oblique front-on view taken by Jason Box Byrd Polar Research Center, Ohio State University on 5 August 2009:
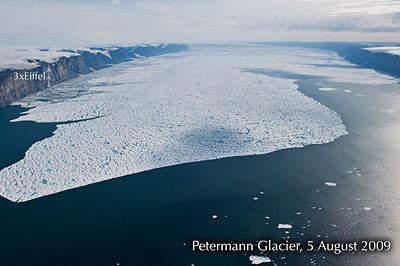
And here’s the ‘after photo’ to pair with it taken by Alun Hubbard of Aberystwyth University, Wales, on 24 July 2011: Continue reading “Dramatic Pictures of Petermann Glacier Ice Loss”

The Climate Show #17: the end of the peer show

Nano electric cars from India, 100 year old electric vehicles, the Petermann ice island floating down towards the Atlantic, heatwaves in the USA and snow in North Canterbury, and a bit of peerless chat about a larrikin Lord on his way to New Zealand. With added vegan cheese and the BFC (big fat cat). Yes Glenn and John Cook wax lyrical, while Gareth’s mind wanders off on his EU and US trip — The Climate Show is back with another rambling but perfectly essential distillation of climate and related news and commentary.

Watch The Climate Show on our Youtube channel, subscribe to the podcast via iTunes, listen to us via Stitcher on your smartphone or listen direct/download from the link below the fold…

Follow The Climate Show at The Climate Show web site, and on Facebook and Twitter.

Continue reading “The Climate Show #17: the end of the peer show”

On fire inside a snowball

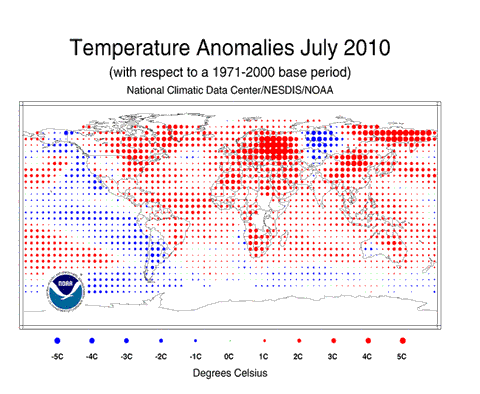
Fire: NOAA’s National Climate Data Centre has posted its report on global climate for July (press release). The combined global land and sea surface temperature of 16.5ºC was the second warmest in the NOAA record, 0.66°C above the average for the last 100 years of 15.8°C. The January to July period was the warmest in the record. The map below shows the anomalies for the month — spot the heatwave in Russia.

NOAA201007.gif

Meanwhile, NASA’s Goddard Institute for Space Studies (GISS) has posted its take on the the July numbers: What Global Warming Looks Like. Click on the thumbnail image at the top of the post to see their map of July temperatures. One striking point they comment on:

…the area warmer than climatology already (with global warming of 0.55°C relative to 1951-1980) is noticeably larger than the area cooler than climatology. Also the magnitude of warm anomalies now usually exceeds the magnitude of cool anomalies.

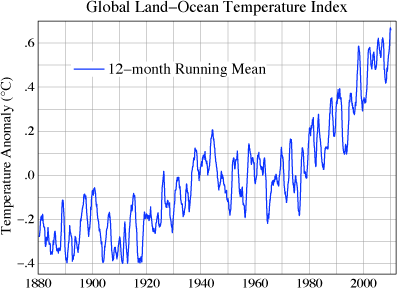
GISS also note that the 12-month running mean (below) of global temperature is well into record territory, and that it’s possible that calendar 2010 could also set a record.

GISSglobalrmJul2010.gif

Meanwhile, up North….

Continue reading “On fire inside a snowball”

It breaks

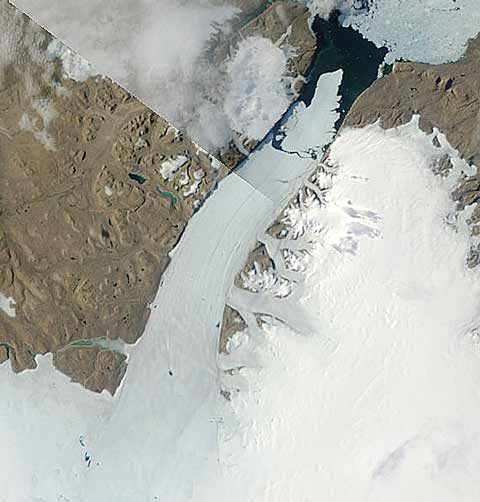
petermann2010breakweb.jpg

The Petermann Glacier in northwest Greenland has calved a massive “ice island” from its floating tongue (the largest in northern hemisphere), as the MODIS image above demonstrates. The island is approximately 260 square kilometers in area, making it equivalent to (arbitrary choice of geographical comparison appropriate to blog) eleven Rangitoto Islands (or four Manhattans, or about one eightieth of the area of Wales), and broke off at the end of last week. It contains enough fresh water (being nearly 200m thick) to keep the USA supplied with tap water for 120 days. NOAA’s National Ice Centre provides another view, with the ice island outlined in red:

Continue reading “It breaks”

Don’t watch that, watch this!

If you’ve got any interest at all in the state of the Arctic Sea Ice, resist the temptation to watch the World Cup, or the start of the All Black’s winter season, and take a look at David Barber’s talk at the International Polar Year’s Oslo Science Conference. Go to the “Web TV” page, then scroll through the videos on offer until you see Barber’s talk — On Thin Ice: The Arctic and Climate Change (or use the direct link). Barber’s a good lecturer — he gave yesterday’s (Friday) morning plenary talk at the conference — and he delivers a fascinating overview of his work on the Circumpolar Flaw Project, one of the biggest components of the 2007-8 IPY. Most interesting of all is his description of the state of the sea ice last autumn, as the icebreaker Amundsen went in search of multi-year ice in the Beaufort Sea. He gives a graphic description (involving pyjamas) of the ice breaker discovering that what the Canadian Ice Service maps were suggesting was thick multi-year ice was nothing of the sort — the Amundsen was making a comfortable 13 knots through it, not far short of its top speed of 13.7 knots. That section of his talk starts at about 20 minutes in (by the timer on the player), but it’s worth watching the whole thing. The press release for Barber’s talk is here.

Continue reading “Don’t watch that, watch this!”