I‘m going to be away from my desk for a few days this week, so here’s a few interesting things to read and reflect on. First up: Wellington’s hosting this year’s New Zealand Soil Carbon Conference at Te Papa from Wednesday to Friday. Keynote speakers are Tim Flannery and Christine Jones, and topics to be covered include:
- The science behind climate change and soil carbon
- The on-farm benefits of biological farming
- How research can support innovative farmers
- An overview of the new biological economy and market opportunities
- Practical tips to build soil carbon, humus and soil biology
- Future directions for NZ agriculture and extension services
Full programme here — Friday’s a field trip day. Sounds very worthwhile. If any HT readers are attending (or if the conference organisers are reading this), I’d be very happy to carry a report on events.
Adding to the long list of material debunking standard sceptic & crank claims about climate change, Deutsche Bank’s Climate Change Advisors (DBCCA) have produced a nicely referenced document (PDF), prepared for them by the Earth Centre at Columbia University. Here’s a sample from the executive summary:
Claim: Human society and natural systems have adapted to past climate change.
Response: Past climate changes have often been accompanied by migration, war, and disease. The growing human population will inevitably make environmental change more disruptive in the future, even in the face of increased technological prowess.
A couple of items from Nature News: in Collapse of the ice titans, NN interviews Richard Bates, recently returned from a summer sail along Greenland’s NW coast on the Gambo (more on that voyage at Jason Box’s Meltfactor.org blog) about the melt season at the Petermann and Humboldt glaciers. Ocean conveyor-belt model stirred up looks at a new paper in Nature Geoscience that finds greater than expected variability in the great ocean current network known as the Thermohaline Circulation (THC). Understanding the short term changes in THC flows will be important in attempts to model short term and regional climate change.
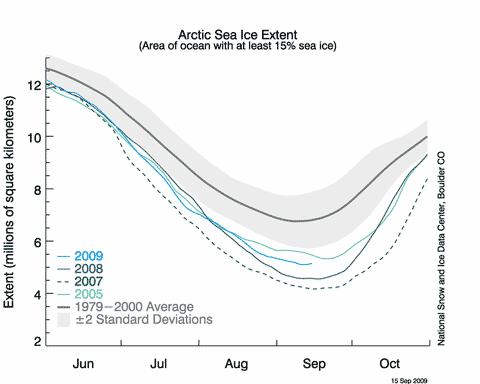
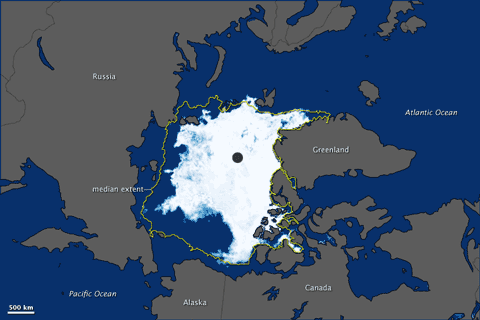
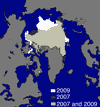
The Arctic sea ice looks to be fast approaching its summer minimum, heading for somewhere between 2008 and 2009 — making it the third lowest in the record. Best place to keep up with events is (as it has been all NH summer) Neven’s Arctic Sea Ice blog. The two boats (Northern Passage, Peter 1) attempting to circumnavigate the Arctic Ocean in a single season are both now heading for the southern route of the NW Passage. In the southern Beaufort Sea the Norwegian team are reporting high sea temperatures:
We are still surprised and worried about the high water temperature. At the moment we are registering around 7 to 8 degrees Celsius, which according to the experts is far higher than normal.
Also of interest for sea ice aficionados: a new paper in Quaternary Science Reviews looks at what we know of the history of Arctic sea ice. Coverage at Climate Central and Science Daily but here’s Climate Central talking to the NSIDC’s Mark Serreze:
“They’re telling us that there was maybe no ice during the Arctic summers 7,000 years ago, and also ice-free summers during the last interglacial 125,000 years ago.” Those were due to natural factors, most notably the changes in Earth’s orientation to the Sun that brought more sunlight to the Arctic in summer. This time, says the paper, there is no known natural explanation, and climate skeptics who claim the ice is rebounding after the 2007 low, he says, “are grasping at straws.”
And finally: the British government starts planning to adapt to inevitable warming (but offers no new money). Plus ça change…
Like this:
Like Loading...
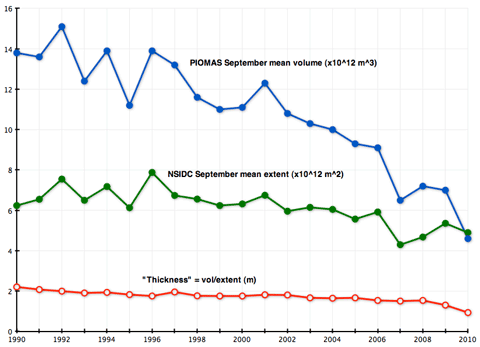
 A few days ago I used a combination of Arctic sea ice volume data from the University of Washington’s PIOMAS model and NSIDC sea ice extent numbers to project that the Arctic Ocean would be effectively ice-free in late summer within ten years. The key to that exercise was the rate at which the volume of sea ice has been declining — 350 km3 per year over the last 30 years for the full dataset, 410 km3 per year over the last 20, and 740 km3 over the last decade at summer minimum. The rate of volume decline has obviously been increasing. Using those numbers to project ice extent in the future is one thing, but they also tell us something interesting about the overall Arctic heat budget — and we can use that to make a rough guess about when the Arctic will become ice-free year round. The answer is surprising…
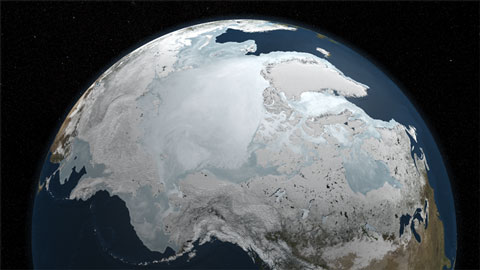
 The National Snow and Ice Data Centre