Canadian megafires send smoke round the globe

Quebecfires

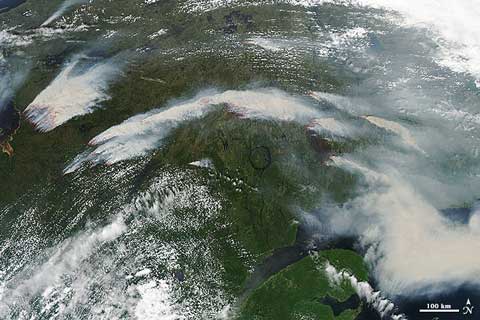
Massive forest fires are raging beyond control in Quebec, sending huge plumes of smoke to the east. The Eastmain fire — top left in this image from NASA’s Earth Observatory — is spreading towards the east coast of James Bay, the southernmost extension of Hudson Bay, and is currently estimated to cover an area of 656,000 hectares (1.6 million acres). Smoke from the huge fires has already caused smog problems in Montreal and Maine, and is heading round the globe. On July 8 NASA’s Terra satellite spotted a great swathe of Canadian smoke crossing Norway and Sweden, and heading across the Baltic towards Finland.

QsmokeoverNorway

The Eastmain fire is the largest wildfire in Canada since 1959, and is almost as big as all the wildfires that have burned in the US so far this year. Forecasts for the area show warm temperatures continuing for at least another 5 days, so the fire is likely to continue to spread.

Meanwhile, up on the Greenland ice sheet, Jason Box, Peter Sinclair and the Dark Snow team, who are investigating the effect of smoke particles deposited on the ice on melting, have successfully completed their first sampling mission. It’s well worth checking Sinclair’s blog for frequent updates — and lovely images — of the team’s progress.

[Update 14/7: Jeff Masters posts on the Canadian fires here, and a European team track the smoke in near real time.]

Ice bottom blues

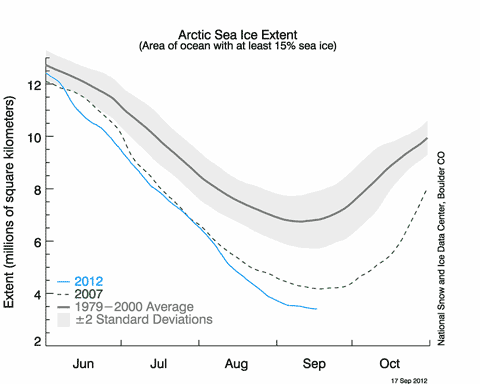
According to the latest bulletin from the National Snow and Ice Data Center in the US, Arctic sea ice is likely to be at or about its minimum extent for the summer (as of Sept 17th). The animation above shows how the ice melt proceeded through the summer (up to Sept 14th), and the graph below shows the extent as of Sept 17th — 3.41 million square kilometres (1.32 million square miles).

NSIDCseaice20120917

The NSIDC notes:

The current extent is 760,000 square kilometres (293,000 square miles) below the previous record minimum extent in the satellite record (4.17 million square kilometres or 1.61 million square miles) which occurred on September 18, 2007. This difference is larger than the size of the state of Texas. The ice extent currently tracks nearly 50% below the 1979 to 2000 average minimum extent.

For an insight into what the ice is really like, I recommend Julienne Stroeve’s blog of her trip on the Greenpeace vessel Arctic Sunrise. This is from her most recent entry (Sept 17th):

Continue reading “Ice bottom blues”

Polar projections

Arctic vir 2012147

This stunning view of the Arctic and the northern hemisphere was captured by the Suomi-NPP satellite a couple of weeks ago. You can clearly see where the Arctic sea ice is beginning to melt and break up (the bluish bits of offshore ice). More on the image at the Earth Observatory. Meanwhile, new research indicates that extreme Arctic warming and the break-up of the West Antarctic ice sheet may be closely linked, according to evidence from an amazing lakebed core from Russia’s Lake El’gygytgyn ((I’m glad The Climate Show is on sabbatical and I don’t have to attempt to pronounce that…)). From the Science Daily report:

Brigham-Grette, the lead U.S. scientist says, “What we see is astonishing. We had no idea that we’d find this. It’s astonishing to see so many intervals when the Arctic was really warm, enough so forests were growing where today we see tundra and permafrost. And the intensity of warming is completely unexpected. The other astounding thing is that we were able to determine that during many times when the West Antarctic ice sheet disappeared, we see a corresponding warm period following very quickly in the Arctic. Arctic warm periods cluster with periods when the Western Antarctic ice sheet is gone.”

Not good news.

High and dry

EOTasmanhigh

From NASA’s Earth Observatory: yesterday’s Image Of The Day (RSS feed) was this stunning picture of an intense high pressure system over the Great Australian Bight to the southwest of Tasmania, acquired by the MODIS sensor on the Aqua satellite on June 5th. In high pressure systems, dry descending air suppresses cloud formation, in this case punching an impressive “hole” through a layer of stratocumulus clouds. Central pressure at the time was 1040 hectoPascals. According to the NZ MetService 7 day forecast, over the next week the system will move east and set up camp to the southwest of the South Island.

Also from the Aqua satellite last week, a good picture of the midweek snowstorm that hit the South Island. Thursday morning chez nous was as pretty as several pictures.

Wet, wet, wet

ICESCAPEpondSample

Sunshine is pouring down on the Arctic, and the high summer melting season is well under way. This photograph from NASA’s Earth Observatory shows crew from the US Coast Guard cutter Healey collecting a supply drop canister from melt ponds on the surface of the ice in the Beaufort Sea during the current Icescape exercise. Which is a good looking way to introduce a rather serious graph…

Continue reading “Wet, wet, wet”