
 Don Easterbrook’s strange obsession with the Greenland temperature record and the GISP2 ice core data series continues. Despite his last effort having been shown to be completely clueless (though still good enough for Bob Carter and “potty peer” Chris Monckton to reference approvingly), he continues to (snow)plough a lonely furrow. This time it’s in a guest post at µWatts headlined (rather poorly) Easterbrook on the magnitude of Greenland GISP2 ice core data. It’s BIG data, obviously, for Don, but sadly he shows no signs of actually doing any proper research, or developing any real understanding of the issues he feels so free to write about.
So where are the errors this time?
- He continues to represent the temperature data from Cuffey & Clow/Alley 2000 as reaching up to the present day, when the most recent data point in the series is 1855. (He refers to the “top of the core” being 1987, which it may well be, but that’s not the most recent data point in the temperature series he’s using.)
- He continues to misspell Kurt Cuffey’s name.
- He continues to represent temperatures at the top of the Greenland ice sheet as a good proxy for global temperatures. They’re not. Greenland temperature changes are not synchronous with changes recorded in Antarctic cores, for example.
- He pretends that the magnitude of historical changes in temperature at the top of the Greenland ice sheet can be used as a comparison to current global changes — but because he relies on a series that ends in 1855 he effectively excludes all modern warming from his comparison chart (Fig 2). In any event, if he had done any reading on the subject, he would have encountered the phenomenon known as “polar amplification” which suggests that the Greenland paleo record should be scaled by a factor of around 0.5 in order to scale with global average temperatures. (Good discussion of the issue in Jim Hansen’s latest draft paper.)
- He includes a long and unoriginal survey of the history of Northern Hemisphere temperatures that appears to have been extensively cribbed from Denis Avery and Fred Singer’s magnum opus, Unstoppable Global Warming — Every 1,400 Years, because he repeats their silly little mistake about English vineyards during the Medieval Warm Period: “wine grapes were grown as far north as England where growing grapes is now not feasible”. Please tell that to the English winegrowers who are making excellent wine — include superb fizzies in the Champagne style, good enough to see off French competition in recent tastings. There’s been a commercial vineyard near York (‘oop North, for the uninitiated) since 2006, and its wine has begun to win awards.
Here’s Easterbrook’s conclusion:
Temperature changes recorded in the GISP2 ice core from the Greenland Ice Sheet show that the magnitude of global warming experienced during the past century is insignificant compared to the magnitude of the profound natural climate reversals over the past 25,000 years, which preceded any significant rise of atmospheric CO2. If so many much more intense periods of warming occurred naturally in the past without increase in CO2, why should the mere coincidence of a small period of low magnitude warming this century be blamed on CO2
If you exclude temperatures after 1855 from your consideration, you can’t say much about the last 150 years, however hard you may try. The real lesson from the Greenland temperature record is that if large changes in local climate can occur so quickly (over decades or less) without any extra forcing from greenhouse gases, then we should be greatly concerned. We’re giving the climate system a massive kick with our greenhouse gas emissions, and we should be very worried that, as Wally Broecker memorably put it, we’re prodding an angry beast with a sharp stick — the very opposite conclusion to the one Easterbrook draws. As Richard Alley put it in a post at Dot Earth last year: “using GISP2 data to argue against global warming is, well, stupid, or misguided, or misled, or something, but surely not scientifically sensible”.
Here’s today’s NASA Earth Observatory Image of the Day:
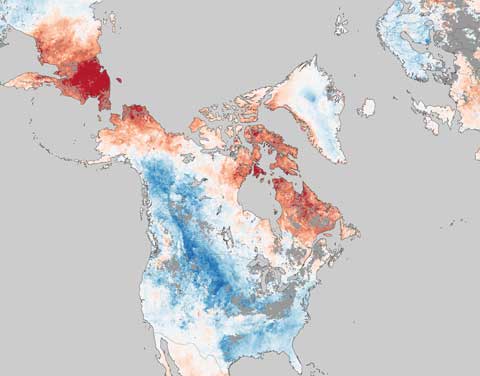
Perhaps the Kraken wakes.
I was particularly struck by the ‘the only modern warming which might possibly have been caused by CO2 (1978-1998)’ which comes in at number 17 in his ‘hit parade’.
Of course, we can’t see any of the 20th century warming on the accompanying graph, as it ends in 1855, and I have no idea why the special treatment is handed out to this particular 2 decade span.
(I’m also a little suspicious that the value given in the bar graph for this particular ‘magnitude’ is actually just the sum of warming over the 2 decades rather than the associated rate per century that the scale at left identifies [and why °F ?]).
Be that as it may, I’m not altogether sure I’m comforted by the knowledge that worse things happened in Greenland 11 000+ years ago!…
Look, seriously, the rate of warming per century exhibited between 1978 and 1998 – ‘the only modern warming which might possibly have been caused by CO2’ – was, what, half or one third of a degree F (less?), according to that bar chart? About a half or a third of the rate of 20th Century warming given?
Forget about vinyards in York, It’s the vinyards in Sweden I find interesting.
Wow, did Easterbrook not read any of the criticism of his earlier article, or is he just that dishonest and thinks he can get away with repeating untruths?
He must have studied Joseph Goebbels, the Nazi propaganda minister who coined these phrases:
“A lie repeated thousands of times becomes a truth”
and
“The worst enemy of any propaganda, it is intellectualism.”
and
“We striving not for truth, but effect”
I think Easterbrook operates in a sort of intellectual vacuum. He has his views, his (mistaken) interpretation of the data, and so much invested in them through his many articles that to admit any error now would be to undermine his whole position. Stubborn would be one way to describe it, but that’s probably being charitable…
But 1855 as “present”? I mean, it’s fine to be confused about what “present” means once, but he’s so clearly wrong, how can that not have penetrated somehow?
Looks like a clear case of confirmation bias.
More insights here: http://digitalcommons.law.yale.edu/cgi/viewcontent.cgi?article=1102&context=fss_papers
Epistemic climate sceptic closure.
Let’s think about this in the light of Delingpole’s claim that the ‘Peer Review process is ‘perhaps irrevocably’ corrupt, and his championing of ‘Peer to Peer Review’. That is, we ‘publish’ material on the web, democratically, away from the biased machinations of elites, and let everyone have a go! (One is almost tempted to say ‘let 100 flowers bloom!’)
In Dec 2010 Easterbrook ‘publishes’ this piece at WUWT, where he asks us to conclude, from looking at this graph ‘that virtually all of the past 10,000 years has been warmer than the present.’
Except if we read the actual scale on the bottom we can only actually see 95 years before ‘the present’; which he claims is 2000AD, hence 1905, but actually turns out to be 1855 – as, according to the provider of the original data, the present is a conventional date set at 1950!
So, the last 155 years – during which time the best estimate, as provided by Gareth, suggests a temperature rise of 1.44 C, making an absolute nonsense of the ‘virtually all years… have been warmer’ claim – is not examined!
If you follow the link, it’s instructive to check out just how few of the supposed ‘skeptics’ over at WUWT bother to read the graph closely enough – even taking it at face value and assuming a ‘present’ of 2000 AD – to say “hang on, that’s 1905, isn’t it? What happened since then? How does that relate to what you’re saying?” I counted (maybe) one in the first few dozen postings, then one indignant poster (suggesting WUWT’s ‘good name’ is being undermined) really lets rip before the actual substance begins to be dealt with.
Or, to be more accurate, not dealt with. Some name-calling, a bit of argy-bargy, interspersed with the predictable paranoiac nonsense, crankeries, and uncomprehending motherhood statements.
Throughout there’s a good deal of blarb about the EPA, the IPCC, and Obama, and (oh, the irony!) commentary on how the warmists will fiddle this one away, haven’t given the prof a decent break by excluding him from journals, etc. etc..
I think it’s fair to say that Easterbrook’s conclusion – 9100 years out of 10 500 were warmer than now – drawn from such initial data would not likely fare well in any peer-review process! One would certainly hope so…
Not to mention Easterbrook’s blithe, unsupported assumption that somehow this one series of data can represent the whole world! (We get a ‘one of the best ways to…’ and off we go!)
Now, Easterbrook credits himself at the bottom of the post as ‘Professor of Geology Western Washington University’. Probably thanks in no small part to the efforts of our host Gareth, WWU’s Geology Dept. put out a formal statement shortly afterwards, stating that they fully support the rigorous science of AGW. Additionally, ‘that all science must be subjected to rigorous peer review and publication before it becomes worthy of serious discussion. We do not support publication of non-peer-reviewed scientific results in the general media.’
(Note we haven’t even touched on Easterbrook’s previous history with these same issues.)
And yet despite all this, here, at the post we are currently discussing, is one variant on that same graph ending at 1855’s temperature (albeit shorn of the ‘present temperature’ label indicating that now-mysterious horizontal line, but with the series still terminating on that line at ‘0 thousand years before present’). And Greenland is the whole world, too!
The point is that the administrators at WUWT cannot possibly claim to be unaware of the devastating criticisms of this material. And yet they are content to simply re-package and re-‘publish’. The faithful at WUWT don’t scrutinize it carefully – or at all; have a look at the comments – and are, in the main, blissfully unaware of previous criticisms (even in those cases where they’ve been raised at WUWT itself!)
And the great circle of confirmation bias simply rolls on. As Doug Mackie has pointed out. And as, I’d suggest, Watts and co. know full-well it will…
Whatever else it may be this isn’t science! It isn’t even close. ‘Peer-to-Peer Review’ is a crock.
We train people for years in such complex matters for a reason. We have rigorous standards in science publishing for a reason. Historically we have deferred to those with the extensive training who have weathered the review process for a reason. Peer Review may not be perfect, but I’m afraid, as has been said of Democracy, it’s the worst system we have, apart from all the others…
Bill,
You might be interested to know that the UK government is launching a select committee investigation into the peer review process:
The Committee has today launched an inquiry into peer review. The committee invites evidence on the operation and effectiveness of the peer review process used to examine and validate scientific results and papers prior to publication.
The Committee welcomes submissions on all aspect of the process and among the issues it is likely to examine are the following:
1. the strengths and weaknesses of peer review as a quality control mechanism for scientists, publishers and the public;
2. measures to strengthen peer review;
3. the value and use of peer reviewed science on advancing and testing scientific knowledge;
4. the value and use of peer reviewed science in informing public debate;
5. the extent to which peer review varies between scientific disciplines and between countries across the world;
6. the processes by which reviewers with the requisite skills and knowledge are identified, in particular as the volume of multi-disciplinary research increases;
7. the impact of IT and greater use of online resources on the peer review process; and
8. possible alternatives to peer review.
http://www.parliament.uk/business/committees/committees-a-z/commons-select/science-and-technology-committee/news/110127-new-inquiry—peer-review/
Nothing wrong with reviewing things now and again, eh John? It doesn’t mean there is anything wrong.
Thanks for that link John. I’m not sure why the UK parliament thinks it needs to review peer review or what authority it imagines it has to make changes in the existing system. Reviews are done gratis as a professional courtesy to ones peers at the request of editors (well known and recognised scientists) of international scientific journals. I would hate to see any government interference.
“The faithful at WUWT don’t scrutinize it carefully – or at all; have a look at the comments”
Take a closer look at these two comments:-
http://wattsupwiththat.com/2011/01/24/easterbrook-on-the-magnitude-of-greenland-gisp2-ice-core-data/#comment-583909
http://wattsupwiththat.com/2011/01/24/easterbrook-on-the-magnitude-of-greenland-gisp2-ice-core-data/#comment-584028
Even NOAA Paleontology had an error in their metadata.
OK, great that you do your own digging — but I note with interest you don’t explicitly criticise DE, in fact you modify his claim by stating that there are 4,000 years warmer than now. I suggest you look at the blue crosses on my graph.
In any event, if you had dug a little deeper you would have found that the GISP2 temps are not meteorological temps — they’re calculated from oxygen isotope data which is itself subject to complex interpretation, the dating depends on snow accumulation modelling. The relationship between the core temps and actual temps is interesting, and an active area of research — but at the present any claims about current versus paleo temps beyond the obvious broad brush interpretation is not justified. (In fact DE is on better ground looking at the rapid changes seen in the record, but they tell a rather different story as I point out in my conclusion).
Actually, I confronted DE in an email exchange but he was intractable and I documented the exchange at CCG. Even though I generally subscribe to his future projections, I have always thought that his diagrams leave a lot to be desired,.his lack of knowledge of the British wine scene similarly. Kiwifruit are also being grown in Britain but whether either is a long-term proposition remains to be seen.
If you had followed the WUWT links you would see that the figure is in excess of 5790 years warmer than present using your GRIP benchmark (adding 1.44 to the 1855 value).
Exposure of the lax graphing is criticism enough in that instance because by the time I had figured it all out, the debate had finished and yes I did know that the GISP2 temperature reconstruction is not meteorological (the word “reconstruction” being self evident).
I note that there is a new post at WUWT “New paleo reconstruction shows warmer periods in Alaska over the past 3000 years” re the paper “Six millennia of summer temperature variation based on midge analysis of lake sediments from Alaska”, Clegg et al in a similar vein to the DE post.
Hear Hear – I also was struck by the complacency of the conclusions drawn from the ‘magnitude’ argument (and I’ve still got reservations regarding that bar chart, at least regarding the modern figures, as raised above.)
And, even without the actual versus isotope temps issue, what, half of these temps are above that +1.44C above 1855 line, are they? Hmmmm…
Again, even taking things at the same face value, it’s a tremendous comfort to know that the complex, interdependent, industrially agricultural civilization of billions covering the world in 30BC and before endured conditions that may have been warmer – after all, this is only bloody Greenland we’re looking at here – than now!
Wine was almost certainly made as far north as Lincoln (Lindum) in Roman Britain, but there is no sure evidence of vine plantings north of Middlesex.
OTOH, Pete Gottgens planted vines on the banks of Loch Tay in Scotland – 100 km’s north of Glasgow – in 2005 and harvested a Riesling vintage in 2009. I don’t know it if will ever be sold as wine though – his company folded, and I’m not sure what the future is.
Be that as it may, the crop was grown 400 kilometres north of Lincoln, and 600 kms north of any plantings certainly known from Roman times.
Just FWIW…
Yes, I found a reference to Gottgen’s Perthshire vineyard on the English Winegrowers site, but a quick Google established that he “left” the hotel recently (there are creditors anxious to catch up with him, apparently), and so will wait for that vineyard to prove itself… 😉
Here’s another interesting discussion in the light of Delingpole’s ‘peer to peer review’ over at skeptical science.
Richard C – we can only assume these are your own posts you are linking to? I really find it hard to credit, given the amount of flack the Dec 2010 ‘paper’ generated, that either Easterbrook or any of the administrators at WUWT can have been unaware of the 1855 date issue, not least because of some misunderstanding arising from the NOAA database. This rather verges on the ‘convenient’. In fact, the recent ‘paper’ drops the claim – but keeps that bloody graph ending at ‘0 thousand years before present’! And whether 1855 or 1905; there’s no excuse for passing off either date as ‘current temperature’. It’s not like there hasn’t been previous debate about these points, either…
Plus Greenland is not the world, as has also been pointed out repeatedly.
I also find it hard to credit that – despite any rather belated alarms as to the state of the Emperor’s attire – 90% of the readership at WUWT have not taken home the message that the nice prof has proved that it was warmer almost always than it is now, there is no current abrupt current climate change (and anyway things were worse 11 000+ years ago, and mass industrial civilization survived that, right?) and that the warmists will continue to unfairly exclude all this from public purview.
Carol, I think even simple responses like yours will boost its ego. There will be no fun if they don’t get any acknowledgement other than red buttons.
I feel his Greenland argument looks a bit flawed, and gets nobody anywhere anyway. Past changes of whatever magnitude dont disprove agw. There have likely been occasional rapid rates of warming in the very distant past regionally, eg coming out of the younger dryas period.
The recent warming appears rather significant and fast over the period of the last few thousand years, and that the MWP appears rather weak. going back furthur its less certain but still appears to be rather rapid.
AGW is highly consistent with a very large range of varied atmospheric and climatic observations. Nothing else even comes close.
Interesting that your commenters hide a press release from the UK Commons.
I have been looking at the grace data on changes to greenlands ice mass on scepticalscience.com, and there does seem to be a consistent accelerating decline. It appears to be a small proportion of total mass at this stage, but if this is the pattern from just 0.7 degrees of warming it is a bit ominous, or have I missed something?
Nice Climate Crock on the global ice-core record + great Kirk Douglas moment – and Ernest Borgnine!