
 Over the holiday period I’ve had a number of people point me at the latest “essay” by Don “Cooling-gate” Easterbrook — it was featured in full at µWatts, translated into German and Dutch, and made headline material for Morano: Geologist: 9,099 Of Last 10,500 Years Warmer Than 2010. I was a little surprised. I thought that recent temperatures were the warmest for at least hundreds, and probably thousands of years. But this is Easterbrook, and he’s up to his old tricks. He’s “hiding the incline” in temperatures by mangling the data from Greenland ice cores. Has he learned nothing since I last looked at his “work”? Apparently not.
Easterbrook’s argument is so flimsy and his presentation of data so dodgy that even the normally uncritical crowd at µWatts voiced grave doubts about his analysis. But there were a number of loose ends left over from my last look at Greenland ice core data, and so I took the opportunity to do a little more research. Playing fast and loose with the facts, and making schoolboy errors in the process, is not a good look for a professor emeritus. But that’s what Easterbrook’s been doing…
Easterbrook’s basic argument relies on using temperatures at the top of the Greenland ice sheet as a proxy for global temperatures. That’s a fatal flaw, before we even begin to examine his use of the ice core data. A single regional record cannot stand in for the global record — local variability will be higher than the global, plus we have evidence that Antarctic temperatures swing in the opposite direction to Arctic changes. Richard Alley discussed that in some detail at Dot Earth last year, and it’s well worth reading his comments. Easterbrook, however, is content to ignore someone who has worked in this field, and relies entirely on Greenland data to make his case.
Most of the past 10,000 [years] have been warmer than the present. Figure 4 shows temperatures from the GISP2 Greenland ice core. With the exception of a brief warm period about 8,200 years ago, the entire period from 1,500 to 10,500 years ago was significantly warmer than present.
This is Easterbrook’s Fig 4:
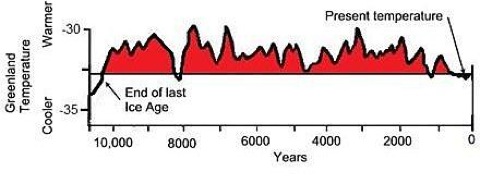
It’s a graph he’s used before, in various forms, almost certainly copied and altered from the original (click image below to see source: the NOAA web page for Richard Alley’s 2000 paper The Younger Dryas cold interval as viewed from central Greenland, though DE credits it as “Modified from Cuffy and Clow, 1997”, misspelling Kurt Cuffey’s name in the process (shades of Monckton’s Curry!)):

Easterbrook continues:
Another graph of temperatures from the Greenland ice core for the past 10,000 years is shown in Figure 5. It shows essentially the same temperatures as Cuffy and Clow (1997) but with somewhat greater detail. What both of these temperature curves show is that virtually all of the past 10,000 years has been warmer than the present.
This is his Fig 5:
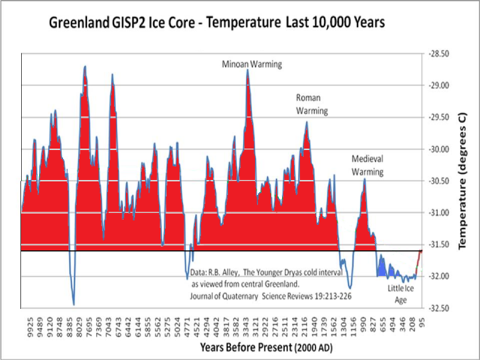
Easterbrook plots the temperature data from the GISP2 core, as archived here. When I last wrote about this subject, I assumed that “present” was defined as 2000, the date of Alley’s paper on the Younger Dryas, which is given as the primary reference at the head of the data file. Easterbrook makes the same assumption explicit in his chart, defining “present” as 2000. The first data point in the file is at 95 years BP, and shown in his graph. In other words, Don presents 1905 as equivalent to the present — a point I emphasised the last time he used this data. However, we were both wrong.
One of the last comments to my “100 years of warming” post suggested that the GISP2 “present” followed a common paleoclimate convention and was actually 1950. This would make 95 years BP 1855 — a full 155 years ago, long before any other global temperature record shows any modern warming. In order to make absolutely sure of my dates, I emailed Richard Alley, and he confirmed that the GISP2 “present” is 1950, and that the most recent temperature in the GISP2 series is therefore 1855.
This is Easterbrook’s main sleight of hand. He wants to present a regional proxy for temperature from 155 years ago as somehow indicative of present global temperatures. The depths of his misunderstanding are made clear in a response he gave to a request from the German EIKE forum to clarify why he was representing 1905 (wrongly, in two senses) as the present. Here’s what he had to say:
The contention that the ice core only reaches 1905 is a complete lie (not unusual for AGW people). The top of the core is accurately dated by annual dust layers at 1987. There has been no significant warming from 1987 to the present, so the top of the core is representative of the present day climate in Greenland.
Unfortunately for Don, the first data point in the temperature series he’s relying on is not from the “top of the core”, it’s from layers dated to 1855. The reason is straightforward enough — it takes decades for snow to consolidate into ice.
And so to an interesting question. What has happened to temperatures at the top of Greenland ice sheet since 1855? When I wrote about this last year, I relied on a Mark 1 eyeball estimate based on the GISS record for Angmagssalik, but I can now do better. Jason Box is one of the most prominent scientists working on Greenland (I’ve covered his work a fair bit over the years) and he has a recent paper reconstructing Greenland temperatures for the period 1840-2007 (Box, Jason E., Lei Yang, David H. Bromwich, Le-Sheng Bai, 2009: Greenland Ice Sheet Surface Air Temperature Variability: 1840-2007. J. Climate, 22, 4029–4049. doi: 10.1175/2009JCLI2816.1). He was kind enough to supply me with a temperature reconstruction for the GRIP drilling site — 28 km from GISP2. This is what the annual average temperature record looks like (click for bigger version):

I’ve added lines showing the average temperatures for the 1850s (blue) and the last 10 years (red), and the difference between those is a warming of 1.44ºC. I’ve also added the two most recent GISP2 temperature data points (for 1847 and 1855, red crosses). It’s obvious that the GRIP site is warmer than GISP2 (at Summit Camp). The difference is estimated to be 0.9ºC on the annual average (Box, pers comm).
Let’s have ago at reconstructing Easterbrook’s Fig 5, covering the last 10,000 years of GISP2 data. It looks like this (click for bigger version):
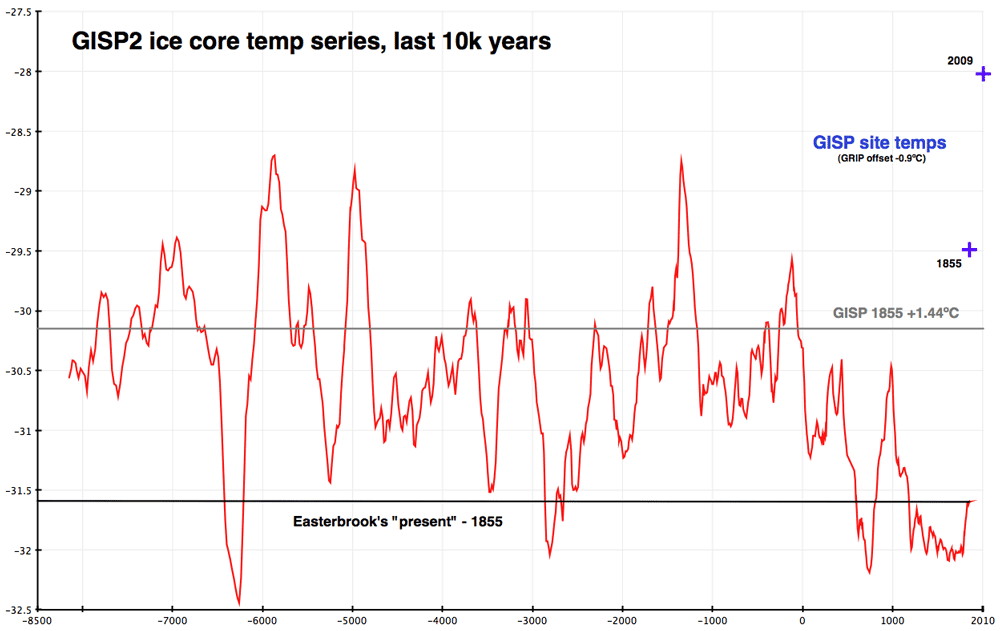
The GISP2 series — the red line — appears to be identical to Easterbrook’s version, proving that he can at least download a file and plot it in Excel. The bottom black line shows his 1855 “present”, and it intersects the red line in the same places as his chart. I’ve added a grey line based on the +1.44ºC quantum calculated from the GRIP temperature data, and two blue crosses, which show the GISP2 site temperatures inferred from adjusted GRIP data for 1855 and 2009.
Two things are immediately apparent. If we make allowance for local warming over the last 155 years, Easterbrook’s claim that “most of the past 10,000 [years] have been warmer than the present” is not true for central Greenland, let alone the global record. It’s also clear that there is a mismatch between the temperature reconstructions and the ice core record. The two blue crosses on the chart show the GISP site temperatures (adjusted from GRIP data) for 1855 and 2009. It’s clear there is a calibration issue between the long term proxy (based on ∂18O measurement) and recent direct measurement of temperatures on the Greenland ice sheet. How that might be resolved is an interesting question, but not directly relevant to the point at issue — which is what Don Easterbrook is trying to show. Here’s his conclusion:
So where do the 1934/1998/2010 warm years rank in the long-term list of warm years? Of the past 10,500 years, 9,100 were warmer than 1934/1998/2010. Thus, regardless of which year ( 1934, 1998, or 2010) turns out to be the warmest of the past century, that year will rank number 9,099 in the long-term list. The climate has been warming slowly since the Little Ice Age (Fig. 5), but it has quite a ways to go yet before reaching the temperature levels that persisted for nearly all of the past 10,500 years. It’s really much to do about nothing.
1855 — Easterbrook’s “present” — was not warmer than 1934, 1998 or 2010 in Greenland, let alone around the world. His claim that 9,100 out of the last 10,500 years were warmer than recent peak years is — to put it bluntly — pure bullshit, based on a misunderstanding or misrepresentation of data. He should withdraw his article, and apologise to those he has mislead. I’m confident, however, that Easterbrook will instead whinge about being attacked — which brings to mind the late, great Kenneth Williams.
The last word goes to Richard Alley, who points out that however interesting the study of past climate may be, it doesn’t help us where we’re heading:
Whether temperatures have been warmer or colder in the past is largely irrelevant to the impacts of the ongoing warming. If you don’t care about humans and the other species here, global warming may not be all that important; nature has caused warmer and colder times in the past, and life survived. But, those warmer and colder times did not come when there were almost seven billion people living as we do. The best science says that if our warming becomes large, its influences on us will be primarily negative, and the temperature of the Holocene or the Cretaceous has no bearing on that. Furthermore, the existence of warmer and colder times in the past does not remove our fingerprints from the current warming, any more than the existence of natural fires would remove an arsonist’s fingerprints from a can of flammable liquid. If anything, nature has been pushing to cool the climate over the last few decades, but warming has occurred.
[See also: MT at Only In It For The Gold. My thanks to Richard Alley and Jason Box for their rapid response to my questions.]
Tiny question/correction: Isn’t this particular delta-18-O record for the oxygen in the H2O *ice* (which gives us a regional temperature proxy). As opposed to the oxygen in O2 gas in bubbles (which would give us a proxy for something else, I forget, maybe total global ice sheet volume)? You imply that it’s the gas bubbles.
Not sure. I’ll check in the morning.
[And when I get up, I find Bob Grumbine has supplied an excellent answer (see below). I’ve removed the bubble reference.]
May also be worth mentioning that insolation at GISP’s latitude has been steadily declining for the last 10K years, by a total of around 50 W/m^2.
Is that right Nick?. I thought the highpoint (insolation) was reached about 6000 years ago, and has been declining ever since.
There’s an insolation chart here: http://www.gisp2.sr.unh.edu/DATA/alley1.html
Don’t like the units much (cal cm-2 day-1): apply a factor of 0.5ish to get W m-2.
Thanks Nick.
In Easterbrook’s article he notes that “1999 to 2010 global cooling. No global warming has occurred above the 1998 level and temperatures have declined slightly.” However, on his glacier fluctuations research web page he notes instead “For example, the present warm period (1977–2007) is slightly
warmer than the 1920–1950 warm period, and the 1947–1977 cool cycle” Try to fit those two statements. That material from others is not accurately represented or credited is apparent at this same research website. His figure 14C and 15C are pictures I took. The terminus lines are ones I denoted on the images. The dates for the lines are not correct- for 15Cm it is 1985, see Boulder Glacieror discussed here Blog post on Boulder Glacier
For 14C the date stamp from my picture is still evident and the date is 1985 as well.Easton Glacier. You could say he did not know whence they came, but then he did request using them in an email in 2007,
Mauri,
If May is a bad time for you, one option might be for me to finish the abstract on Mt. Baker glaciers by adding material from your website to the data I already have, make you a co-author, and present the paper myself. I can finish updating my Mt. Baker database using the photos that I currently have, but from the looks of your website, you’ve already done what I would be doing (and I have no desire to ‘reinvent the wheel’).
Don
I’ll take the chance to recommend Richard Alley’s book The Two Mile Time Machine. He discusses there, for general audiences, how ice cores are used to reconstruct climate.
The delta 18O computed is the ice’s 18O, not the air bubbles. It has to be that way because the atmosphere’s 18O signature is unaffected by temperature. Since it’s the snow/ice signal that is observed, it could be computed up to the latest snowfall. But the 18O, in practice, is observed from the ice cores — one of the many measurements made on the ice core. Many of those measurements can only be made on the ice. In that sense, the 18O is a tag-along measurement.
18O as observed in the Greenland ice cap is affected by many things:
* Global ice mass (more ice = more 18O in the ocean that supplies water to the ice cap)
* Temperature of evaporating water (warmer source waters = more 18O in the vapor)
* How many condensation cycles there are before the vapor reaches Greenland (each condensation reduces the 18O of the vapor remaining)
* How many evaporation cycles there are (freshly evaporated water has more 18O than residual after condensation)
* The temperature of the cloud the snow precipitates from (cold clouds favor relatively more — relative to what’s in the cloud — 18O in the snow).
These are all different magnitudes, with the main one being the cloud temperature. But to extract the climate signal, you need to pay some attention to all as the climate signal isn’t terribly large. In talking about evaporation/condensation cycles, this translates to storm tracks. If the tracks shift (yet another sort of climate change) then you see a change in the 18O in Greenland, even if the air temperature is unchanged. The cloud temperature effect is strong enough that you can tell the difference between summer and winter snows by their isotopic signatures — at least for the most recent snow/ice. But that, then, means that you also get a shift in isotopic signature in the core if the change is one of having relatively more snow in the summer than winter, or vice versa. Again, not something recording surface air temperature.
None of what I say here is new to the ice core people, specifically not to Alley. I know that because I
arguedvigorously discussed these and related points with Richard eons ago. One of the purposes of making those many measurements on the same ice is exactly so as to disentangle how much of what is seen in one of the tracers, 18O in this case, due to one cause versus another.Thanks Bob. Nice exposition.
Thanks for this, Gareth. Good work.
So, what does this graph tell us?
That CO2 and global temperature are correlated?. That it’s a lot drier and dustier during glacial maximums?. Could you be a bit more specific?
Yes CO2 and global temperature are correlated – I know that, I’m fully paid up AGWer, have been for *several decades* – 2-4C man through and through..
But, that graph is for Vostok, just like the GISP/Easterbrook graph is for Greenland. I just think any sceptic with their head even partly screwed on (humm) might notice that and say ‘So, Vostok says little about Global temperature either?’.
I asked a question of MT as well. And, yes, I think the answer is Vostok is part of a set of data that paints a consitent global picture. GSIP is part of that – right? So, while Easterbrook’s basic argument wrongly relies on using temperatures at the top of the Greenland ice sheet as a proxy for global temperatures it’s not the case GISP isn’t part of the global picture (same with Vostok). I just think if people point out that GISP is not at all representative of the globe they should do that with Vostok. And that leave us saying the correlation of CO2/temp there is a correlation of CO2/local temp part of a set of data that paint a global picture?
Having drawn much the same conclusions as DW I’d also assumed this was some kind of ‘gotcha!’ If so you’ll need to come in with the sting at some point…
“This graph” shows the ‘current level of CO2 as about 280ish.
I think “this graph” shows that the beginning point is the standard 1950 starting point.
“This graph” has no information relevant to the last 60 years if I’m right.
Well according to the reference – “Higher dust levels are believed to be caused by cold, dry periods.”
Among other things, it tells us that we are making a CO2 excursion far outside anything seen for the last half-million years.
Yeah, but look on the bright side – less dust!
That CO2 levels lag temperature by about 800 years, so screwing the scam that CO2 drives temperature?
JamesDavidGraham, would you care to explain the circumstances of your first point, how that proves your second point, and just what is driving temperature? Feel free to use real, verifiable facts.CO2 levels lag temperature by about 800 years. That is not in dispute.
http://joannenova.com.au/2010/08/ice-core-evidence-no-endorsement-of-carbons-major-effect/
Temperature controls CO2 levels. dT/dCO2 is positive. That is not in dispute either.
CO2 levels have no effect on temperature trends. dCO2/ddT = 0.
That’s bad news indeed for alarmists.
“and just what is driving temperature?”
Orbital changes, apparently. It’s academic, anyway. Historical evidence needs no explanation before it is accepted.
Did you really just do that? The difference in temperature divided by the difference in CO2 is non zero, but the difference in CO2 divided by the difference in temperature is zero? Where did you study maths?
Not in dispute, why not? Show causation!
Do you stand by the blog you linked to? It’s not a primary source, but what the hell, for the sake of argument let’s accept it this time. How does an 800 year time lag prove that CO2 is not a greenhouse gas?
Orbital changes? Can’t say I’ve noticed a lot of those in the last 50 years. Care to show me the proof that says Earth’s orbit has radically shifted recently?
Ouch. Thanks. Ratios inverted in error.
For the dependent variable, CO2, dCO2/dT is positive. Because CO2 lags T by about 800 years (fact), T is the cause and CO2 is the effect. Of course there is a greenhouse component. Obviously it is overwhelmed by other factors.
Indeed, for the dependent variable, dT (not T), ddT/dCO2 = 0. So CO2 has no effect on T trends.
“Show causation!” Why? Evidence needs no explanation to be accepted.
“Do you stand by the blog you linked to?” Absolutely. I’ve had it up to here with pal-reviewed pap.
Remaining questions answered above.
Nice chat, Richard C1!
“For the dependent variable, CO2, dCO2/dT is positive.” Really?? Why? Because you say so?
“Because CO2 lags T by about 800 years (fact), T is the cause and CO2 is the effect.”
Really?? Why? Because you say so?
“Of course there is a greenhouse component.”
Good to know there is a greenhouse component – we can agree on one thing at least.
“Obviously it is overwhelmed by other factors.”
Obviously!! I wonder what those might be?
Can’t be bothered with the rest. Frankly I have never read such rubbish in all my days. Quasi mathematical mumbo jumbo with no meaning, proving nothing but the fact that the writer has no conception of what he thinks he might be talking about.
I thought this would have been subjected to the ol’ cloaking device by now. Sigh……another mole to hammer.
Because CO2 lags T by about 800 years
Fail!. In the past CO2 lagged behind global temperature because the change was caused by either variations in Earth’s orbit (eccentricity), or tilt (obliquity) and wobbles (precession) in its rotation, which meant the planet warmed because it was receiving slightly more energy from the sun. CO2 outgassed primarily from the oceans as they warmed and therefore acted as a feedback to further enhance warming.
Today a whole bunch CO2 is coming dead plant matter (fossil fuels – coal, oil, gas) which has been safely locked underground for hundreds of millions of years, until humans dug it up and burnt it. All this extra CO2 released by humans activities is accumulating in the oceans and air – warming and acidifying the oceans and warming the atmosphere.
CO2 doesn’t care whether it is a feedback (as in the past) or a forcing (as in today) it warms the planet regardless.
Your silly assertion is like saying arson is impossible because forest fires start from natural causes.
Thoroughly and succinctly whacked, nicely done Dappledwater!
Graham, there’s this thing – maybe you’ve heard of it – called the greenhouse effect. There’s this other related factor you may have heard of called “radiative forcing”.
To claim CO2 levels have no effect on temperature trends illustrates a gross ignorance of basic physics.
Please see answer to Richard C1. Thanks.
I rather wish I hadn’t. As the Aussies might say, that was a load of rubbish/bollocks.
‘bollocks’ is rather more the old country – though we used to have a lot of bullocks in this one, hence good old-fashioned ‘bullshit’ is the most frequently-used term, but ‘crap’ will do in mildly polite company, and ‘rubbish’ will serve around the maiden aunt
i always rather like the irish ‘shower of shite’ myself…
Richard, we all know what will happen here. At the moment it may be pretending to do like the equations like a real brainy science guy ‘n’ that, ‘cos it’s got like a degree’n’shit from the university of cut’n’paste, but before long we’ll be back to the post-lobectomy Rodney Dangerfield routines.
Then the meat-and-sock-puppet alumni arrive, for ‘Graham’ is but an acolyte, the prelude to the main event. Yes, the very doyen of grand claims and bathetic responses may yet grace us with his presence; but perhaps the kingly ‘James’ is still in grand procession in remotest Patagonia with his family – because he has a life, and apparently this is what living people do – and since the global intertubes can only delivered there by trained canary in the hours the goshawks are not at their most active we may be forced to forgo the pleasure.
Responding ‘feedback and forcing’ or ‘and chickens do not lay eggs because they have been observed to hatch from them’ (h/t Deltoid) won’t help. This isn’t about facts or issues, because that puts our friends at a considerable disadvantage…
Bill, what can I say? Conventionally you don’t feed the troll. And yes, he is definitely a troll; subspecies Seagull. But I confess, I was curious to discover whether or not he could think for himself. Initial impressions are that he is not capable of independent thought, overall it does not look hopeful!
Nice analysis. Coincidentally, Easterbrook made it into my recent Skeptical Science post on scientists predicting global cooling. He’s one of the few foolish enough to make such a prediction, and his prediction of global cooling of 2 to 5°F (1.1 to 2.8°C) from 2000 to 2030 is not looking good, to put it lightly.
Wow, you guys are going to look real silly if cooling occurs. I think I’m pretty safe saying that amplification is NOT occurring. (prove me wrong and show me links to observational evidence of the promised hot spots)
Check out the Herald now printing De Freitas opinions.
Public opinion changed in 2010. The world has woken up to this farce. A farce all based on a Scenario modelling a hypothesis, not actual evidence.
But you fools can keep believing.
Its amusing to watch.
http://www.nzherald.co.nz/opinion/news/article.cfm?c_id=466&objectid=10697845
So David, I guess that means you’ll agree that Easterbrook is “going to look real silly” when the planet continues warming?
It would be a lot easier to show the “amplification” and “hot spots” you’re talking about if you explained what you mean by those terms. The only “hot spot” I’m aware of is the tropical troposphere ‘hot spot’, which is a signature of any global warming and has nothing to do with anthropogenic warming or greenhouse gases.
As for de Freitas, notice that he’s not foolish enough to predict global cooling. He merely claims global warming won’t be dangerous because he doesn’t understand that a high climate sensitivity doesn’t necessarily lead to runaway global warming. Or at least he knows that his NZ Herald audience won’t understand this concept.
The Herald has a habit of running denialist claptrap during the summer silly season. De Freitas makes a number of statements that are just plain wrong, and deserves to be called on them… perhaps later 😉
TRANSLATION: ‘I think it’s a pretty safe bet I have no idea what I’m referring to here but I saw this on WUWT and thought I’d try it out here.’
Public opinion does not operate physics, David.
This is a question which interested Richard Alley too, to the point that he published a paper on it. In it, he provides a reconstruction of temperatures at the GISP2 site from 1500 to 1989. Given those results, I’d estimate the temperature change from 1855 to 1989 at a little over 2K, which would put 1989 temperatures higher than about 95% of all years in the past 10,500.
Of course, the obvious caveats apply; in particular, this is a proxy reconstruction, and it approximates the temperature of surface ice, rather than surface air. Still, it’s a useful sanity check, using data from the GISP2 location itself. It’s pretty clear that 1855 was substantially colder than today, however you look at it.
I can add that the discrepancy also fascinates Jason Box, who has a paper in the works that touches on the issue…
Speaking of predictions.
How did these ones work out for you-ha ha
[snipped: No long cut’n’pastes. Your own words, or a link to the original will suffice. GR]
James? Is that you back again?
no, it can’t be. James is in guatemala with no internet at the moment
Or his trusty calculator!…
“plus we have evidence that Antarctic temperatures swing in the opposite direction to Arctic changes”
Yes, I have noticed that in June-August the Antarctic reaches a temperature minimum while at the same time the Arctic reaches a temperature maximum. In December to February this pattern is reversed.
(sorry bad joke – must be on holiday still!)
In his eighth paragraph, De Freitas says:
“A doubling of carbon dioxide, by itself, adds only about one degree Celsius to greenhouse warming”;
which puts him absolutely out on a limb.
Jule Charney’s original estimate of ‘fast-feedback’ climate sensitivity from 1979 was between 1.5 and 4.5 degrees Celsius (see p 44 of ‘Storms of my Grandchildren’).
I’d love to see some peer reviewed published paper to back up De Freitas’ outlier estimate.
“A doubling of carbon dioxide, by itself, adds only about one degree Celsius to greenhouse warmingâ€;
Well we have already had that “about one degree C” rise.
Yes, we have had a (0.7C?) rise since 1850. But this does not mean that all (0.7C) can be automatically attributed to carbon dioxide.
I use brackets because I am typing from memory. Apologies if the number is incorrect, my point remains regardless.
We are referring to the basic black body effect of CO2, are we not?, i.e the theoretical warming in the absence of feedbacks from water vapour, albedo etc.
Is this figure really in much dispute?
In fact, Macro, you yourself quote a figure of 1.2 deg C here
http://hot-topic.co.nz/back-in-judys-jungle/#comment-19599
Your quite right! 1.2 degrees C would be the forcing for doubling of CO2 alone – without taking into account any other positive feedbacks. (see Dana below as well.)
I was IMPLYING above that it was rather flippant and disingenuous for de Freitas’ to suggest that the warming would only be in the order of 1 degree, (no he didn’t say that explicitly but the phrasing implied that), (and by that – infer that there had been none until now); when firstly, we have had almost 1 degree warming since the 1850’s; and secondly, clearly there is more to come.
The fact that we have almost 1 degree already would seem to suggest (to a RATIONAL person) that even though we do not have (as yet) a doubling of CO2 – there might well be other positive feedbacks going on, and to dismiss them as lightly as de Freitas does in the Herald, suggests that he is not really being “straight-up” with the facts of the matter.
de Freitas says:
The degree of warming directly caused by the extra carbon dioxide is, by itself, relatively small.
and then
Debate focuses on climate feedbacks that may or may not suppress, perpetuate or amplify an initial change caused by increasing concentrations of greenhouse gases. A doubling of carbon dioxide, by itself, adds only about one degree Celsius to greenhouse warming.
To me, this is clear and unambiguous.
I don’t see any attempt to be deceptive or to confuse people at all.
The misdirection is in trying to present there being a focus of debate on this issue. As Dana says, the science community has a pretty clear idea of what’s going on — the only people tyring to “debate” this are Roy Spencer and Richard Lindzen, and they are getting no traction because their arguments are not persuasive to their peers.
I particularly enjoy de Freitas’ “Computer climate models project more warming because the modellers build in feedbacks from water vapour…†because this flatly contradicts the chair of the NZCâ€Sâ€C, Barry Brill, who says:
“Water vapour, which constitutes over 90% of all greenhouse gases is ignored because it has a short life in the atmosphere – perhaps only a week.†(Brills submission to the ETS Select Committee Feb 2009.
I assume, as an ex-MP, Brill knows it is considered naughty to mislead a Select Committee. So how has this flat out contradiction arisen? Is de Freitas, the science advisor to NZCâ€Sâ€C, wrong or is the chair of NZCâ€Sâ€C wrong?
de Freitas used lots of Barnum statements and tried hard to avoid making any concrete claims but still managed to contradict the Chair for whom he advises. Watch this space for the lowdown on what’s going on.
Are you able to fix up that hyperlink in your post, Doug?
crap, files in a different place.
http://www.parliament.nz/en-NZ/PB/SC/Documents/Evidence/b/7/b/49SCETSSCevidenceETSR_277-Barry-E-Brill.htm
http://www.parliament.nz/en-NZ/PB/SC/Documents/Evidence/8/5/9/49SCFE_EVI_00DBHOH_BILL9597_1_A14298-Barry-E-Brill.htm
Doug, thanks for the links.
I think you’ll find that the quote from Brill was in the context of the Kyoto protocol
(page 7 of first pdf link)
However, the statement from page 5 of the pdf (first link) is consistent with the de Freitas statement
Changing Science – The 2007 Science Report of the IPCC was but a shadow of the aggressive 2001 Report.
But it still totally reliant upon the belief that initial CO2 radiative effects are vastly amplified by water vapour/cloud (positive feedback) to block infrared energy. Other scientists have published studies since 2007 contending that clouds provide negative feedback. Neither position is yet proven, but if the latter proves correct then the crisis is over.
I am not going to argue the pros and cons of any position on feedbacks, but I am just pointing out these statements for clarity.
Brill is talking about methane under Kyoto.
Kyoto was based on 1995 IPCC SAR.
The models used in all AR include water vapour.
de Freitas is correct that a doubling of CO2 alone will cause about 1°C (actually more like 1.2°C, if you want to be picky) of warming. This is not a climate sensitivity value, which includes feedbacks – it’s just from CO2 alone ignoring all feedbacks.
de Freitas is also correct that climate models have a positive feedback from water vapor. He’s not correct that it’s “built in”, but rather it’s a result of their physical simulations of the global climate as the planet warms. And indeed several recent studies have confirmed that water vapor is a positive feedback through empirical observations. That issue is really quite well settled at this point, and it’s probably one I’ll be doing another Skeptical Science post on in the near future.
Barry Brill is entirely wrong in Doug Mackie’s quote, and de Freitas is also in error. It’s impressive that they could both be wrong while contradicting each other.
And indeed several recent studies have confirmed that water vapor is a positive feedback through empirical observations.
There may be feedbacks that are positive, but it is the overall sign of the feedback that is at issue.As far as I know, this is certainly not settled science.
At least you acknowledge that de Freitas is correct in some of his statements.
I can’t comment on Barry Brill’s quote since this may have been taken out of context and the original source is not there.
Dana,
A CO2-only climate sensitivity of 1.2 degrees Celsius (for a doubling of pre-industrial CO2 concentrations) still seems a bit low to me.
E.G. Gavin Schmidt says that based on Annan and Hargreaves the most likely value is about 2.9ºC with a 95% probability that the value is less than 4.5ºC
BTW, are you the same Dana who wrote A detailed look at climate sensitivity? It starts with the 1.2 degrees C sensitivity in the second paragraph.
Yep that’s me. The terminology is a bit confusing because people don’t usually talk about the warming from a doubling of CO2 alone. But 1.2°C is the correct value. In the link you provide, Schmidt says
“the range of climate sensitivity to a doubling of CO2”
He’s not referring to the warming in response to CO2 alone. He’s referring to the climate sensitivity – the net warming we see (including feedbacks) when CO2 doubles. CO2 will cause 1.2°C, and then feedbacks will add a net ~2°C on top of that, so the total is around 3°C. When ‘skeptics’ are arguing about climate sensitivity, they like to point out that CO2 alone is 1.2°C, and the other 2°C is from feedbacks, because they dispute that the feedbacks are so large (even though there is a very large body of evidence that they are, as I showed in the detailed look at climate sensitivity you linked to).
John D – no the total sensitivity is not “settled science”. However, the evidence is very strong that the water vapor feedback is positive, and the evidence is also very strong that overall climate sensitivity to 2xCO2 is in the range of 2 to 4.5°C, which means that there’s also strong evidence that the net feedback is positive.
Dana, thanks for clarifying that.
Glad to help!
Here are some more papers on Greenland temperatures:
http://agwobserver.wordpress.com/2010/10/29/papers-on-greenland-temperatures/
Better might have been: Has he learned anything since I last looked at his “work� Apparently not.
You guys sure love patting yourselves on the back. No wonder you believe all this hooey blaming lovely carbon dioxide for natural climate change. There’s more scientific method in the hypothesis of fairies at the bottom of the garden.
Oh dear, the Pathetic Posse is back! We all know what to sad little men, don’t we boys and girls?
G’day, bill! Calm down, boy. You’re overheating. An inelegant excess of CO2 snorting comes next. See how it works?
From Marco:
The way I like to think about this is that a half-doubling, i.e. multiplying by the square root of 2, will bring the CO2 level to 1.414*280 = 396 ppm which will happen around 2013. (Won’t that be a great milestone.) It’s pretty hard to get 0.8K of warming from half a doubling without feedback, especially with decreasing insolation at Greenland’s latititude.
Indeed.
I happen to have illustrated the point in http://hot-topic.co.nz/easterbrooks-wrong-again/comment-page-1/#comment-22733 — at my post http://moregrumbinescience.blogspot.com/2010/01/co2-and-temperature-for-800000-years.html
It’s quite striking, both visually and mathematically, how absurd it is to think the current CO2 levels have anything to do with the relationships between temperature and CO2 that prevailed prior to the last 1000 years.
“The best science says that if our warming becomes large, its influences on us will be primarily negative…” Baseless nonsense; ‘best science’ my a@@ comrade. With increased warming, tropical regions will tend to increase in area. Where is there a greater diversity of species? In the tropics or in Antarctica?
You forgot about desertification there, Mike. It won’t be a total “tropical paradise”.
He forgot about sea level rise, and collapse of glaciers as well (amongst other things). He also completely overlooks the loss of habitat, but don’t let these facts get in the way of of an idiotic argument.
Exactly right, Carol. The tropics are going to be the worst place to be as the planet continues to warm. Places like Central America very well may face famines as increasing drought and desertification decimate their agricultural productivity.
Not to mention large-scale fires destroying the rainforests, as has been mentioned before.
Hmmm…
Easterbrook’s at it again:
http://wattsupwiththat.com/2011/01/24/easterbrook-on-the-magnitude-of-greenland-gisp2-ice-core-data/#comment-582556
Complete with the same old 1855 ‘present’ as far as I can see (the magical line ain’t labelled). Even Cuffey’s name is still mis-spelled! If you get called out, simply ignore and repeat…
Oh, and there’s some ‘magnitude’ bar graphing I haven’t seen before. The ‘warming possibly caused by CO2’ bar is rather, um, interesting…
And doesn’t his captive audience love it?
From where you get the GRIP data plotted in the figure where the GRIP ice core data is shown updated until 2009?
I want to say, what is the source of the data plotted in this image:
http://hot-topic.co.nz/wp-content/uploads/2011/01/GRIPtempBoxlarge.png
The reference is above the graph: Box et al’s reconstruction of Greenland surface temps.
But what is the TITLE of the paper?
Quoting the name of the author is not enough.
Please: read the article. The full reference in standard form, with doi and web link is given above the graph you link to.