
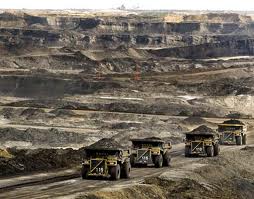
 After drawing attention to climatologist Jason Box’s intention to take part in the act of civil disobedience planned at Washington over the next fortnight, I thought it might be useful to underline why the proposed Keystone XL pipeline, which will carry crude oil from the tar sands of Alberta to refineries in Illinois, Oklahoma and Texas, is so appalling a prospect. James Hansen puts it plainly in a short paper he issued a couple of months ago. It’s the sheer size of the tar sands resource which makes it alarming. Hansen acknowledges that there are multiple objections to the pipeline, including the destruction of the environment in Canada and the likelihood of spills along the pipeline’s pathway, though thinks it unlikely that these will be enough to stop it going ahead. But it’s the climate change implication which is crucial: Continue reading “Why Tar Sands Must Stay in the Ground”
Category: environment and ecology
The Climate Show #18: The Big Chill & The Big Fracking Issue
[youtube]Ec4n8D9hQVg[/youtube]
The big chill freezes New Zealand, Arctic sea ice in the balance, the US has a warm July, the world is getting mad about fracking and some more unusual uses for solar energy. While Gareth is lost in fields of sunflowers, The Climate Show returns with Glenn and John at the helm.
Watch The Climate Show on our Youtube channel, subscribe to the podcast via iTunes, listen to us via Stitcher on your smartphone or listen direct/download from the link below the fold…
Follow The Climate Show at The Climate Show web site, and on Facebook and Twitter.
Continue reading “The Climate Show #18: The Big Chill & The Big Fracking Issue”
Scientist prepared to risk arrest
 Climatologist Jason Box, interviewed earlier this year by Gareth on The Climate Show #7 (interview begins 21 minutes in), is preparing to take part in an act of civil disobedience in coming days. The purpose is to try to convince President Obama that approving the extension of a controversial oil sands pipeline — the proposed $7 billion, 1,702-mile Keystone XL from Alberta to refineries in Illinois, Oklahoma and further to the Gulf Coast— would be the equivalent of what is described as lighting a fuse to the biggest carbon bomb on the planet. Box is among the 2000 so far signed up to line the fences of the White House, where peaceful arrests are not uncommon. They’ll begin gathering on Saturday and rotate through in waves of 75 to 100 daily for two weeks. Box is booked for a three-day stint at the tail end. Continue reading “Scientist prepared to risk arrest”
Biochar remains promising
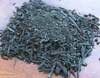 A recent commenter on Hot Topic made critical reference to biochar, providing links to publications from Biofuelwatch. Since I have written posts in the past highlighting the favourable possibilities which biochar may offer I thought it was perhaps time to revisit the matter. Biofuelwatch is an organisation which works “to raise awareness of the negative impacts of industrial biofuels and bioenergy on biodiversity, human rights, food sovereignty and climate change”. It has recently published a report Biochar: A Critical Review of Science and Policy which sets out its disagreement with the claims of biochar advocates. Continue reading “Biochar remains promising”
Charting unexplained territory in the NZ ETS Report
So far, I have posted on the comprehensiveness of the NZ ETS vs the Australian Clean Energy Future ETS, the Kyoto chart junk in the Report on the New Zealand Emissions Trading Scheme, and the over-supply of the New Zealand Units in 2010.
This post mixes two of these ideas; searching out bad charts and looking again at the supply side of the NZ ETS market, how many New Zealand Units were allocated for free to emitters and businesses.
The Report on the New Zealand Emissions Trading Scheme provides in Figure 5 a pie chart of the number of New Zealand Units (NZUs) surrendered by emitters.
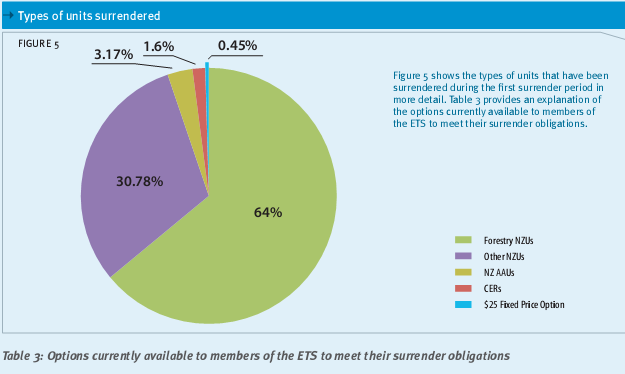
Although the pie chart is Kaiser Fung’s least favourite type of chart, this pie chart isn’t too bad. There are a manageable number of categories; only five; and no 3-D effects. The key point is clear from the pie chart, that about two-thirds of NZUs surrendered were purchased from foresters. Also the chart follows the Ministry for the Environment usual practice of providing the original data underneath so you can do you own chart. I did a bar chart of the data, re-labelling the “Other” NZUs as “Free NZUs”. Continue reading “Charting unexplained territory in the NZ ETS Report”