

In a previous guest post Simon Johnson looked at the new Australian carbon pricing scheme. Here he begins to examine the report on how the New Zealand scheme is faring.
A few days ago I was intending to carefully read the Report on the New Zealand Emissions Trading Scheme that Minister for Climate Change Issues Nick Smith released last Monday and write a considered review.
However, I only got as far as Nick Smith’s foreword on the the third page when I got stopped in my tracks by Figure 3, a misleading piece of chartjunk if I ever saw one, Its about New Zealand being on target to meet its obligations under the Kyoto Protocol. Here it is.

The chart caption underneath Figure 3 gives the source of the data and says that the chart shows “Kyoto net emissions 2000-2007”. This data series trends upward to 2007 and then in 2008 and 2009 it suddenly drops below the blue line of NZ 1990 emissions. Thus showing we are meeting our emissions reduction commitment that we signed up for in the Kyoto Protocol. Its enough to make you proud to be a Blue-Green. This chart is junk because it misrepresents the underlying data on greenhouse gas emissions. Back to the caption of Figure 3: “Kyoto net emissions”. What are “Kyoto net emissions”? Lets look at a real chart of the real data for New Zealand greenhouse gas emissions, as recorded by the Ministry for the Environment’s Greenhousegas inventory.
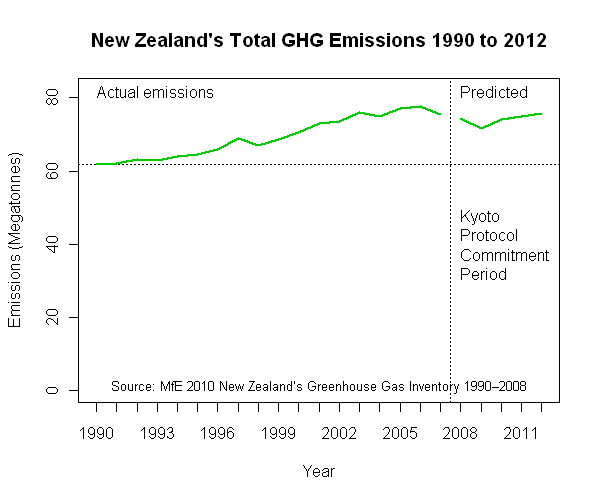
This shows total real emissions up to 2007 and predicted emissions 2008 to 2012 – the green line. It looks nothing like Figure 3. The actual and predicted trend does not show a return to 1990 volumes of emissions. However, that legend also said net emissions, that is total or gross emissions in any year less carbon absorbed by forests. Maybe Figure 3 is based on net emissions.

No it appears not. The trend in net emissions (total emissions less forest sink removals) or the blue line shows an even steeper rate of increase than the total emissions line. So how can Figure 3 show that New Zealand GHG emissions dropped back to 1990 volumes? Two more clues are in Figure 3. The title is “Kyoto net” and there is a note under the caption says “Kyoto net 2000-2007 values are backcasted”. So the Figure 3 data is not just “net”, it is also “Kyoto net” and it is “backcasted”. What does “backcasted” mean? Another chart shows how Smith gets to Figure 3 from the real total and net emissions data.

Greenhouse gas emissions, as defined for compliance with the Kyoto Protocol, are gross from 1990 to 2007, and once the Kyoto commitment period starts in 2008, an Annex B country like New Zealand can meet its target by deducting removal units issued for carbon sinks – so Kyoto-defined emissions go net from 2008. Hence the red line. The removal units issued for afforestation (the increase in carbon stock in a forest planted since 1990) appear as if from nowhere in 2008 and disguise the growth in both the gross and net emissions.
This isn’t new information. In 1997, Simon Upton, the Minister for Climate change in Jim Bolger’s 1990’s National Government spoke of New Zealand’s position at the UNFCCC talks; “if sequestration is treated in the way New Zealand has long been advocating, then the major contribution we expect to make to removing carbon from the atmosphere..will earn us ‘credits’ “.
Interestingly, Upton had this cautionary note: “It might be suggested that New Zealand’s interest in sinks stems purely from a desire to secure for itself a large buffer that would allow for significant growth in greenhouse gas emissions”. Upton believed that would not be a credible policy.
However, since Upton’s time as Minister, both Labour and National Governments have ignored his advice. The chartjunk Figure 3 indicates that New Zealand’s climate change policy has consistently aimed to provide a buffer to allow for significant growth in greenhouse gas emissions. All the time while claiming to have effective mitigation policies such as the NZ ETS that match our much-undeserved clean green overseas image.
So it’s not just a junkchat! It’s, as Disraeli would have it, worse than a damned lie!
I don’t really see the problem. NZ is allowed to account for forestry removals within Kyoto. Are you against that? Please be clearer on what the issue is.
Interesting you’ve not discussed at all the large increase in renewable generation or uptake in forestry plantings.
Sorry but even a child at school would be able to see what the problem is! They have taken values from one set of data up to 2007 AND THEN joined that to values from a DIFFERENT data set from 2008! Now that is simply telling porkies! You really can’t do that – unless you want to hoodwink people. If they want to use the data from the second data set – then they should use that EXCLUSIVELY. It’s simply a matter of not misusing mathematics (or in this case abusing).
The graph didn’t seem to be Mr Feb’s problem in the conclusion of his piece.
Maybe not. But as far as any sound analysis is concerned it’s a fundamental flaw and an immediate fail. It’s taking two entirely different things and saying that they are the same – where clearly they are not.
Furthermore, come the election later this year, when queried as to how well they are doing with regards Greenhouse emissions this nonsense of a chart will be wheeled out by the govt demonstrating just how “dramatic a reduction” in emissions there has been since 2008 – just wait and see. It’s the same sort of “accounting” practices we see with from fraudulent stock prospectuses. Highly mis-representative of the facts, and logically invalid.
I agree the graph is difficult to interpret and misleading because we are used to seeing graphs of net or gross emissions, irrespective of the Kyoto period. But as Mr Feb points out, NZ only earns removal units for sequestration from 2008 – so a graph that attempted to show net emissions from 2007 backwards with some ‘crediting’ offset for forestry would not be a Kyoto emissions graph and worthy of criticism depending how it was labelled. I also think the graph plays some dodgy perspective games with the ‘y’ axis.
“I also think the graph plays some dodgy perspective games with the ‘y’ axis.”
Yes that is another fail!
I’m well aware of the fact that we only earn removal units for sequestration post 2007. If it is considered VITAL to have such a chart then the fact that a completely different set of data is being charted post 2007 should be made clear. This could be achieved by either a vertical dashed line between 2007 – 2008 to indicate a new sequence and, perhaps more effectively, bars of a different colour or shading together with a notation to the effect that pre-2008 are Gross emissions – post-2007 are Nett.
I’m with P1 on this….if every tonne of fossil fuel carbon was sequestered in a permanent forest then we wouldn’t have a problem (with CO2 at least).
And if we are to have an ETS where the emitters buy credits then who should they buy them from if not forest owners?
“I’m with P1 on this….if every tonne of fossil fuel carbon was sequestered in a permanent forest then we wouldn’t have a problem (with CO2 at least).”
Actually Andrew we would. The simple fact is that it simply impossible to sequest every tonne of fossil fuel carbon in forests. As you know around 50% is finding its way into our oceans at this point in time leading to increasing acidification. Doug and Keith’s work here is well worth the read. So forestery would only be dealing with 50% at best, furthermore CO2 and the other nasties of FF combustion, are still main contributors to acid rain and acidification of land with the resulting outcome that many of the Earth’s natural – permanent forests are simply no longer growing.
“According to Binkley et al. (1989, p. 129) and the MAGIC model they created, it seems likely that forest soil acidification in the southeast of the United States will reach a point in about 50-100 years where many forests begin to die off. It also seems likely that this die off will not be an isolated event, as signs of it can already be seen in Germany, Norway, and Sweden (Binkley et al., 1989, p. 3). It has also been shown that it is possible to slow the effects of acidification on some forest soils through nutrient replacement and liming; moreover, it has been shown that a drop in the depositional acidification rates will allow for forest soil recovery to begin to take place. Thus, understanding the effects of higher than normal acidic deposition on forest soil becomes crucial to gaining a perspective on the future of forest ecosystems, and to finding solutions to a possible disastrous situation. “
I don’t find the chart misleading – as with most charts you just have to understand what it is telling you. It seems reasonable to chart per the Kyoto rules and only have net emissions when the kyoto emissions units kick in.
I don’t read the chart as saying we have made a massive reduction in emissions – I read it as saying we have squeaked in under our Kyoto target with a lot of help from our forests (which is what was expected when Simon Upton signed the deal but was looking pretty doubtful a couple of years ago).
Oh and my “every tonne” thing was (obviously) hypothetical. But really is 50% of CO2 finding its way into the oceans just because it has got nowhere else to go.
If the world had a massive reforestation programme (impossible perhaps – but try it as a thought experiment) could that not reduce the atmospheric CO2 leaving less for the oceans (or do the oceans preferentially take FF CO2).
I agree we have to reduce FF use – but we also have to start somewhere and somehow. Kyoto was never a solution – just a start point…where the world goes from here is where it gets interesting.
I have to disagree, both from a professional mathematician’s (now retired) viewpoint, and from the viewpoint of having seen this sort of statistical shenanigans from politicians over a number of years. Robert Muldoon was a past exponent and unfortunately the present administration are no better on a variety of counts. The chart (as it presently exists) is designed to be misleading, and to give a reassurance, that is frankly, not supported by the facts.
I don’t think we (by we I mean the current inhabitants of the Earth) have time now for a “slowly does it” approach to AGW. Every day the signs grow more and more ominous. Cap and Trade is simply an attempt to continue with a “business as usual” lifestyle by the Western and emerging economies. It is merely a sop to the super rich, and multinationals, whose only desire is to obtain as much wealth as they can, and ideologically far right economic “theorists” (the useful idiots) whose only desire is an unregulated market place.
It was an unregulated and greed driven lifestyle that got us into the mess we are now in, and continuing that behaviour will in no way get us out of it. We cannot consume our way out of global warming.
As for CO2 emissions and the other nasties into the atmosphere and their subsequent “sequestration” into the oceans – you really need to read Doug and Keith’s work on that, they are the experts.
The problem is that commercial forests are not permanent, they will be either harvested or deforested, releasing the carbon back to the atmosphere and creating a deforestation liability.
The best ETS design is for Governments to auction the carbon credits..
And that deforestation liability is then offset overtime by the forester replanting forests, or by the forester who might change land use sourcing emission reductions from somewhere else to pay the liability. That’s how it works in the NZ ETS. At a country level it is slightly diffferent, as there is expected to be a big upswing in net emissions around 2020. I think you’ve mixed up the Kyoto and ETS accounting.
Anyway, would you rather forest sequestration is kept out of a country’s carbon accounting? That seems like a terrible policy for encouraging an important offset action. Especially when I know of several people enjoying emission units for permanently foresting-out unproductive areas of their farms.
Your last line is irrelevant to forestry. Reads like a “hockey stick” bait line.
It’s Simon Upton’s cautionary note that points to the lack of credibility in relying on forestry offsets to temporarily compensate for an increase in emissions. The point of a cap and trade scheme (which our ETS isn’t, having no cap) is to reduce emissions, not find a way of increasing them. The world will need massive reforestation if it is ever to pull back CO2 levels from their already dangerous level, and there’s every reason to encourage that. But an ETS isn’t working if it allows emissions to go on rising. The confidence with which the proposed lignite development is being welcomed by the government suggests that the very substantial increase it will entail in NZ emissions will be accommodated by the ETS in its current form. Upton’s caution looks like a prophecy.
I expect we will get a cap at some point…hopefully before it is too late!
The ETS is still in its formative years – there was a good interview on radio nz (nine to noon) with Sir Richard Lambert (09:10 01/08/11) discussing how climate change actions started softly softly in the UK and is now ramping up (and how business has responded).
I wonder who would buy a used car from the current government. Nick Smith would proudly show the fudged paper work that the vehicle has passed its WOF under current standards, never mind that the engine is a write off. John Key on the other hand would say that just because a mechanic says the engine is a write off, there are other mechanics who would say that the engine is roadworthy. We all know mechanics are like lawyers if you pay them enough.
I wonder what our current government’s scientific advisor has to say about all this. Does he believe that climate change is a threat? If yes, are we doing enough to combat it? Is he satisfied that the government isn’t trying to hoodwink the New Zealand public with the message that they have everything under control with the ETS? He seems to be rather quiet. Meanwhile the used car that the Nats are trying to sell is slowly falling into a deep abyss.