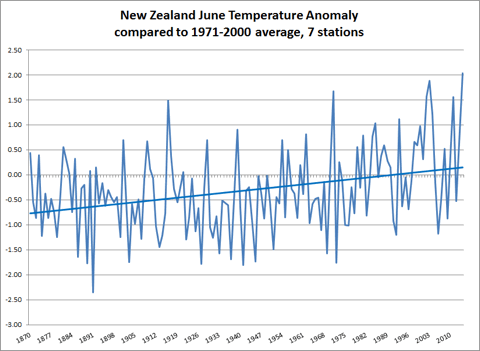
Record winter warmth in NZ: June 2014 breaks 140 year record

NZ7SSJune14

Hot off the press — or to be precise, Jim Salinger’s laptop: June 2014 was the warmest June in New Zealand since 1870, 2ºC above the 1971-2000 average, as measured by the long term “seven stations series” originally devised by Salinger and maintained by NIWA. On the larger 24 station series the month tied with 2003 at 2.1ºC above the 1971-2000 average. Many stations recorded warmest ever Junes, including Dunedin with 8.7ºC, +1.7°C above average, Invercargill with 7.8ºC (+2.2°C), Kaitaia (14.5, +1.7), Tauranga Aero (13.1, +2.4), Masterton Aero (9.8, +2.3), and Hokitika Aero (+10.4, +2.4). Jim points out that NZ warming is most clearly seen in the winter months (and expressed in the snow and ice record) but often escapes notice because a warm winter month is still “cool” compared with the seasons around it.

[Update 3/7: The Australian Bureau of Meteorology reports that the 12 months ending in June were the warmest July/June since records began (The Age. Jim Salinger tells me that in New Zealand July 13 to June 14 was the 3rd warmest in the long term record.]

The big warm: NZ heading for warmest-ever winter

If you think it’s been a warm winter in New Zealand, you’re right. NZ is rapidly approaching the end of a record-breaking winter — the warmest for at least 150 years ((Reliable temperature records in NZ date back to the 1860s.)). Calculations by Auckland climate scientist Jim Salinger show that NZ’s average temperature for June/July/August is running at 9.5ºC, a remarkable 1.2 deg C above the 1971-2000 average, and comfortably ahead of 1998’s old record of 9.3ºC. Commenting on the numbers, Salinger notes the absence of cold snaps in recent months:

The door to cold spells from the Southern Oceans — apart from a brief surge in June — has been well and truly closed this winter. September-like temperatures have been occurring throughout August, giving the country its warmest winter and August ever.

The long term warming signal is clear, he says:

The clearest climate warming signal is seen in winter, where temperatures are now 1.1 deg C warmer than they were around 1870. The warming trends have been very consistent, especially since the 1950s, when frosts days have decreased dramatically across the country.

I can certainly vouch for the absence of frost. At Limestone Hills, we recorded 19 frost days in 2011 and 23 in 2012 ((For the full year. Frost days are any day where the temp falls below zero, and are unusual (1 – 2 a year) after August.)), but only 6 so far this year. Evidence of winter warmth can be seen in gardens around the country. The asparagus spear pictured above first poked its head out of our soil two weeks ago, and is now being joined by half a dozen more — at least a month earlier than normal for North Canterbury.

To unpick just why this winter’s been so warm, I asked VUW climate scientist Jim Renwick to look back at the atmospheric circulation set-up in the New Zealand region. Here’s his (lightly edited) analysis:

Continue reading “The big warm: NZ heading for warmest-ever winter”

Fractured air

The roots of the recent cold weather in Britain and eastern North America lie in unusual goings on high in the atmosphere above the North Pole, as this animation from NASA’s Earth Observatory demonstrates (full video here: 6MB .mov file). The left hand image shows vorticity (rotation, roughly) and the right the temperature at 20km. As the animation moves through January into February, we see the polar vortex (the red bit in the middle) split into two, and stratosphere temperatures over the Arctic jump by as much as 50C. The Earth Observatory explains:

The big change in the Arctic came when the polar vortex ripped apart. A developing weather system in the lower atmosphere traveled upward into the stratosphere. The disturbance nudged into the center of the Arctic air mass, elongating it and eventually splitting it like a cell in mitosis. By February 2, two air masses existed, each with a jet of wind circling it counterclockwise […]. Warm air filled the gap between the two colder air masses, and temperatures high over the North Pole climbed […]. Now the colder air had shifted farther south over Canada and Siberia. Over North America, this piece of the stratospheric polar vortex had a deep reach into the lower atmosphere (troposphere), which created strong winds from the north that carried cold Arctic air far south into the United States.

In Europe, the split in the air mass actually changed the direction of winds in the lower atmosphere. The second piece of the polar vortex was centered east of Western Europe […], and it too was surrounded by a jet of strong wind moving counterclockwise. Like the segment of the polar vortex over North America, this piece of the polar vortex also had a deep reach into the lower atmosphere. It caused cold continental air to blow in from the east, replacing the warmer air that typically blows in from the west. As the frigid air moved over the North Sea, it picked up moisture, which fell over the United Kingdom and parts of France as heavy snow.

There’s a full explanation of the polar circulation at the Earth Observatory page. Well worth a read. Any meteorologists care to comment on just how unusual a feature this is? Are the large blocking highs that bring cold easterlies to Western Europe often associated with polar vortex splits? This is weather, not climate, but the Arctic is experiencing rapid climate change, and this will be expressed as changing weather patterns. A new paper in Climate Dynamics examines this and found “large increases in the potential for extreme weather events […] along the entire southern rim of the Arctic Ocean, including the Barents, Bering and Beaufort Seas.”

[Calexico]

Long hot summer

kanga.jpgThere’s record heat in Australia and deep snow in England (with more to come, say Met men), and it’s all consistent with continuing global warming. Over at Wellington’s leading public transport blog, this is enough to inspire a remarkably ill-informed diatribe:

Following the news as I do, it was delicious today to see the global warmers claiming Melbourne’s summer heatwave was proof of Pope Gore’s alarmism, while ignoring the inconvenient truth that the heaviest snowfalls in decades are falling in London, Paris and much of the north-east of North America.

The really inconvenient truth, of course, is that both weather events neatly demonstrate some of the impacts of global warming and the changes in climate that result.

Continue reading “Long hot summer”

Celia of the seals

sealhat.jpg It appears that my wish is someone’s command. Last month, blogging on the continuing break-up of the Wilkins ice shelf, I noted a reference to “seal hats” as data gathering devices and expressed a wish to see them. And here they are! Little devices glued to the heads of elephant seals that gather data as the seals as they go about their daily business. A new paper in the Proceedings of the National Academy of Science explains:

Here, we show that southern elephant seals (Mirounga leonina) equipped with oceanographic sensors can measure ocean structure and water mass changes in regions and seasons rarely observed with traditional oceanographic platforms. In particular, seals provided a 30-fold increase in hydrographic profiles from the sea-ice zone, allowing the major fronts to be mapped south of 60°S and sea-ice formation rates to be inferred from changes in upper ocean salinity. […] By measuring the high-latitude ocean during winter, elephant seals fill a ‘‘blind spot’’ in our sampling coverage, enabling the establishment of a truly global ocean-observing system.

Abstract here, full paper here[PDF]. More coverage at New Scientist, e! Science News.