NZ sceptics lie about temp records, try to smear top scientist

homer.jpgThe cranks in the NZ Climate “Science” Coalition have sunk to new lows in a desperate attempt to cash in on the far-right driven furore about the Hadley CRU data theft. Here’s an extract from a press release which was doing the rounds of NZ’s newsrooms this morning:

New Zealand may have its own “Climategate”, including manipulation of temperature readings, according to a combined research project undertaken by members of the Climate Conversation Group and the New Zealand Climate Science Coalition. The researchers claim that temperature readings from seven weather stations throughout New Zealand have been adjusted to show a higher degree of warming than is justified by a study of the original raw data.

The author of the press release and the “research project” into NZ’s long term temperature record is blogger Richard Treadgold, not unknown to readers of Hot Topic. Unfortunately for him, and for the credibility of any of the members of the NZ Climate “Science” Coalition, Treadgold’s approach to the issue is ignorant, his results meaningless, and he can have no excuse for not knowing he was wrong. Worse, Treadgold, Dunleavy and the rest of the NZ CSC seem determined to smear NZ’s best-known and most respected climatologist, Jim Salinger (who did much of the early work on NZ’s temperature record), based on little more than straightforward lies. Their press release continues:

“NIWA’s official graph (done originally by Dr Jim Salinger, who features also in the emails leaked from the Climatic Research Unit of the University of East Anglia) shows considerable warming, which they give as 0.92°C per century, saying this is consistent with global warming over the 20th century. But the actual temperature readings taken from the thermometers show an almost flat trend for 150 years.

These figures all come from NIWA. So, why are they so different from each other? Because NIWA has adjusted the earliest temperature readings downwards by up to 1.3°C, which has the effect of introducing a false warming as the graph then “climbs” to the present day. It’s a disgrace. So far, neither Dr Salinger nor NIWA has revealed why they did this,” said Mr Treadgold.

The real disgrace is that this analysis has been conducted by a team seemingly hell bent on ignoring the facts, preferring instead to make up their own.

Continue reading “NZ sceptics lie about temp records, try to smear top scientist”

…Keep out of the kitchen

It appears that Ian Wishart is back on the climate beat, with a couple of posts in the last week attacking Hot Topic. One goes so far as to accuse me of incompetence and dishonesty, which is a bit rich coming from someone who was threatening to sue me for libel a few months ago… Anyway, his latest offering attempts to chastise me for stating in a comment that global temperatures were not falling. That gives me a welcome opportunity to post on the subject and introduce a nifty little gadget programmed by a Hot Topic reader. Here’s Wishart:

Virtually all the major datasets are now acknowledging atmospheric warming has slowed to a crawl or stopped over the past ten years, and even some leading climate alarmists scientists are publicly suggesting we’ve entered a climate shift and may not see warming return for a further decade or more. The data clearly shows temperature anomalies trending down despite CO2 emissions rising:

He appends a graph of UAH monthly temperature anomalies from 2002 to some point earlier this year, with a descending trend line. Lo and behold, “cooling”!

Continue reading “…Keep out of the kitchen”

Spinning wheel…

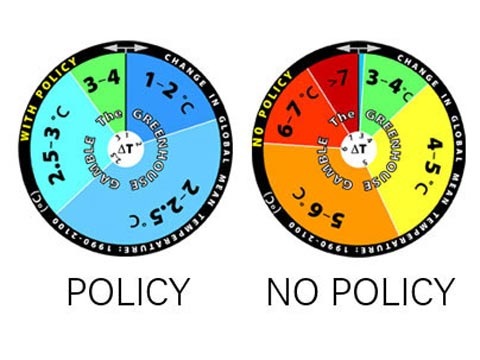
MITroulettebig.jpg

Feeling lucky? Spin these roulette wheels and see where the future lies: on the left, if the world takes decisive action to reduce emissions over the next 100 years, and on the right if we don’t. If we do: most likely an increase of 2 – 2.5ºC. If we don’t: most likely is 5 – 6ºC. Produced by the Joint Program on the Science and Policy of Global Change at MIT, the wheels are a novel way to express the uncertainties associated with projections of future climate and the way they interact with policy decisions. The message for policy makers is clear, according to study co-author Ronald Prinn:

“There’s no way the world can or should take these risks,” Prinn says. And the odds indicated by this modeling may actually understate the problem, because the model does not fully incorporate other positive feedbacks that can occur, for example, if increased temperatures caused a large-scale melting of permafrost in arctic regions and subsequent release of large quantities of methane, a very potent greenhouse gas. Including that feedback “is just going to make it worse,” Prinn says.

For a reminder of just what six degrees means, I recommend Mark Lynas. George Monbiot suggests that climate cranks will object to model projections like these:

Climate change deniers hate these models. Why, they say, should we base current policy on scenarios and computer programmes rather than observable facts? But that’s the trouble with the future: you can’t observe it. If you reject the world’s most sophisticated models as a means of forecasting likely climate trends, you must suggest an alternative. What do they propose? Gut feelings? Seaweed? Chicken entrails?

Tea leaves, obviously…

[Blood, Sweat & Tears]

Telling porkies to Parliament

NZETS.jpgThe Emissions Trading Scheme Review committee has released the first batch of submissions it has received — those made by organisations and individuals who have already made their presentations to the committee. There are some heavy hitters in there: from New Zealand’s science and policy community there’s the Climate Change Centre (a joint venture between the University of Canterbury and Victoria University of Wellington, plus all the Crown Research Institutes – from NIWA to AgResearch), VUW’s Climate Change Research Institute, and GNS Science, and from the world of commerce, we have the Business Roundtable‘s “evidence”. Why the quote marks? Because the Roundtable’s submission is a fact-free farrago of nonsense.

Continue reading “Telling porkies to Parliament”

Fractured air

The roots of the recent cold weather in Britain and eastern North America lie in unusual goings on high in the atmosphere above the North Pole, as this animation from NASA’s Earth Observatory demonstrates (full video here: 6MB .mov file). The left hand image shows vorticity (rotation, roughly) and the right the temperature at 20km. As the animation moves through January into February, we see the polar vortex (the red bit in the middle) split into two, and stratosphere temperatures over the Arctic jump by as much as 50C. The Earth Observatory explains:

The big change in the Arctic came when the polar vortex ripped apart. A developing weather system in the lower atmosphere traveled upward into the stratosphere. The disturbance nudged into the center of the Arctic air mass, elongating it and eventually splitting it like a cell in mitosis. By February 2, two air masses existed, each with a jet of wind circling it counterclockwise […]. Warm air filled the gap between the two colder air masses, and temperatures high over the North Pole climbed […]. Now the colder air had shifted farther south over Canada and Siberia. Over North America, this piece of the stratospheric polar vortex had a deep reach into the lower atmosphere (troposphere), which created strong winds from the north that carried cold Arctic air far south into the United States.

In Europe, the split in the air mass actually changed the direction of winds in the lower atmosphere. The second piece of the polar vortex was centered east of Western Europe […], and it too was surrounded by a jet of strong wind moving counterclockwise. Like the segment of the polar vortex over North America, this piece of the polar vortex also had a deep reach into the lower atmosphere. It caused cold continental air to blow in from the east, replacing the warmer air that typically blows in from the west. As the frigid air moved over the North Sea, it picked up moisture, which fell over the United Kingdom and parts of France as heavy snow.

There’s a full explanation of the polar circulation at the Earth Observatory page. Well worth a read. Any meteorologists care to comment on just how unusual a feature this is? Are the large blocking highs that bring cold easterlies to Western Europe often associated with polar vortex splits? This is weather, not climate, but the Arctic is experiencing rapid climate change, and this will be expressed as changing weather patterns. A new paper in Climate Dynamics examines this and found “large increases in the potential for extreme weather events […] along the entire southern rim of the Arctic Ocean, including the Barents, Bering and Beaufort Seas.”

[Calexico]