The final cut: crank paper on NZ temperature record gets its rebuttal – warming continues unabated

At last: the curtain falls on the final act in the case of NIWA versus the NZ climate cranks. de Freitas et al (2015) – which purported to show warming in NZ was much lower than previously calculated – is shown to be comprehensively wrong in a new paper by NZ’s top temp experts.

Way back in the spring of 2014, NZ’s little band of climate cranks somehow managed to get a paper published based on their recalculation of New Zealand’s long term temperature record1. The effort – based on calculations done to support their infamous court case against the National Institute of Water and Atmospheric Research (NIWA), which they emphatically lost – purported to show that New Zealand’s long term warming rate was only a third of the amount previously calculated. As I pointed out at the time, it was riddled with errors and bad scholarship, but it appeared in the peer-reviewed literature2, and so required a peer-reviewed rebuttal.

It’s taken a while, but in the last few days Comment on “A Reanalysis of Long-Term Surface Air Temperature Trends in New Zealand” has been published in Environmental Modelling and Assessment3. Led by NIWA principal climate scientist Brett Mullan, the authors are Jim Salinger, who first established the NZ long term temperature record4, Professor Jim Renwick from VUW, and David Wratt, now Emeritus Scientist (Climate), at NIWA, and an Adjunct Professor in the New Zealand Climate Change Research Institute at VUW. You could fairly describe them as experts – and their “comment” might better be called a demolition.

Here’s their conclusion:

In this paper, we identify what we consider to be several methodological flaws in the [de Freitas et al] paper. We conclude that, as a consequence, the temperature trend of an increase of 0.28 °C per century for the period 1909–2009 for New Zealand land surface temperatures derived in the dFDB paper is substantially too low, and that no need has been established for significant downward revision of the trend of around 0.9 °C per century found in previous studies.

They then provide a handy summary of the main flaws – which I’ve paraphrased below:

  • dFDB claimed their paper was the first to properly use a methodology developed by Jim Salinger and Rhoades, first published in 1993. It wasn’t – in two senses. It wasn’t the first, and they didn’t use it properly.
  • dFDB claimed NIWA’s long term temp record was based on calculations from Jim Salinger’s PhD thesis. It wasn’t.
  • dFDB’s interpretation of the Rhoades and Salinger technique was mistaken and flawed, using station overlaps that were too short and ignoring changes in maximum and minimum temperatures. The result was that they failed to make many adjustments that were required, and therefore underestimated the actual warming.
  • dFDB made a few arithmetical errors, dealt with missing data incorrectly, and mishandled trends in the Auckland and Wellington series.
  • dFDB ignored other lines of evidence that support warming of 0.7-1.0°C per century, such as temperature series derived by the Berkeley Earth project, the decline in NZ’s glaciers, and analyses of sea surface temperatures around NZ.

The full paper is well worth a read if you followed the arguments at the time of dFDB’s original publication. It’s an elegant and polite deconstruction of a shoddy, politically motivated piece of work that should never have passed peer review first time round. It should make uncomfortable reading for the remaining authors of dFDB (2015) and their promoters, if they were real scientists rather than propagandists. But they’re not.

[Pink Floyd]

  1. A Reanalysis of Long-Term Surface Air Temperature Trends in New Zealand by CR de Freitas & MO Dedekind & BE Brill (DOI 10.1007/s10666-014-9429-z) []
  2. The lead author, Chris de Freitas (who died last year), had a notable track record of helping rubbish through peer review. []
  3. Comment on “A Reanalysis of Long-Term Surface Air Temperature Trends in New Zealand”,Mullan, B., Salinger, J., Renwick, J. et al. Environ Model Assess (2018). https://doi.org/10.1007/s10666-018-9606-6 []
  4. Jim is currently a visiting professor at the Department of Geography and Environmental Studies, University of Haifa, Mt Carmel, Israel. []

Solid Treadgold, easy action (NZ still warming fast)

It’s time to return to the delusions harboured by New Zealand’s little coterie of climate cranks about the NZ temperature record. Readers may recall that — somehow — the men who lost a court case against NIWA and then folded the charitable trust they’d used to bring the case in order to avoid paying costs, managed to get their “reconstruction” of the NZ temperature record through peer review and into the scientific literature. To no-one’s surprise, they found that warming in NZ was only one third of that found by NIWA and a generation of NZ climatologists. To do that, they had to torture the data beyond endurance, as I showed at the time.

Equally unsurprising is that Richard Treadgold, prime mover of the whole fiasco, felt moved to respond in a number of typically prolix posts at his blog. His first, What Mullan actually says, purports to lay out the disputed points:

…I think these are the debating points he’s trying to make, lined up with the passages in which he makes them.

One small problem. This is not a debate. The facts are what the facts are, just as the temperature data is what it is. No amount of handwaving — or appeals to judicial authority — can change the facts of this matter. What can change is the interpretation placed on those facts, and that’s where Treadgold et al went wrong on day one.

In 2010 they decided — and explicitly told the world — that NZ’s climate scientists had been cooking the books. Everything they’ve done since has been a part of building a false narrative, a silly superstructure of misinterpretation and misdirection clumsily bolted together, designed to fool anyone sympathetic to their position. The new paper, by de Freitas, Dedekind & Brill 2014 (dFDB 2014) is just the latest effort to prop up that tottering edifice.

I have no intention of wasting time by playing along with Treadgold et al’s narrative. There are so many misdirections and misunderstandings on display in his sequence of posts that it would take a magnum opus to deal with them all. If I thought that by doing that I might change their minds — win them over to the world of climate rationality — then I would be happy to do it, but Treadgold et al are not what I would describe as rational actors. They admit no facts that are inconvenient to their world view, and show no sign of educability on climate science.

Continue reading “Solid Treadgold, easy action (NZ still warming fast)”

NZ cranks finally publish an NZ temperature series – but their paper’s stuffed with errors

You can’t teach old dogs new tricks, it seems — certainly not if they’re gnawing a much loved old bone at the time. The lads from the NZ Climate Science Coalition — yes, the same boys who tried to sue NIWA over the New Zealand temperature record and lost, and who then folded a trust to avoid paying court-ordered costs — have finally found a learned journal gullible enough to accept and publish their shonky reworking of NZ’s temperature record. Earlier this month Environmental Modelling and Assessment published A Reanalysis of Long-Term Surface Air Temperature Trends in New Zealand by CR de Freitas & MO Dedekind & BE Brill (DOI 10.1007/s10666-014-9429-z).

My attention was drawn to dFDB 2014 by an NZCSC press release, and yesterday Richard Treadgold, the man who kicked off the whole sad affair five years ago, posted a disingenuous and misleading article about the paper at his blog. As you might expect given the authors, the paper does not call for an upward revision in the amount of warming NZ has experienced over the last century. The abstract concludes with the following:

Current New Zealand century-long climatology based on 1981 methods produces a trend of 0.91 °C per century. Our analysis, which uses updated measurement techniques and corrects for shelter-contaminated data, produces a trend of 0.28 °C per century.

As you might also expect, given the authors and their respective track records, the paper is riddled with schoolboy howlers and outright misrepresentations. It would probably never have seen the light of day without the assistance of Chris “Pal Reviewde Freitas and his undoubted ability to steer tosh to publication.

Continue reading “NZ cranks finally publish an NZ temperature series – but their paper’s stuffed with errors”

Salinger: New Zealand is drying out, and here’s why

In this guest post Jim Salinger (currently working in Italy, but soon to return to these shores), takes a look at the climate influences on last year’s severe New Zealand drought. It first appeared on The Conversation.

Over 2012 and 2013, parts of New Zealand experienced their worst drought in nearly 70 years. Drought is the costliest climate extreme in New Zealand; the 2012-2013 event depressed the country’s GDP by 0.7-0.9%. The drought of 1988-1989 affected 5,500 farms, pushing some farmers to the wall. But what does a climate-changed future hold?
Recent evidence confirms that New Zealand on the whole is getting dryer. And we’re beginning to understand why — increasing greenhouse and ozone-depleting gases are driving changes in the atmosphere, with impacts far beyond New Zealand.

Continue reading “Salinger: New Zealand is drying out, and here’s why”

Record winter warmth in NZ: June 2014 breaks 140 year record

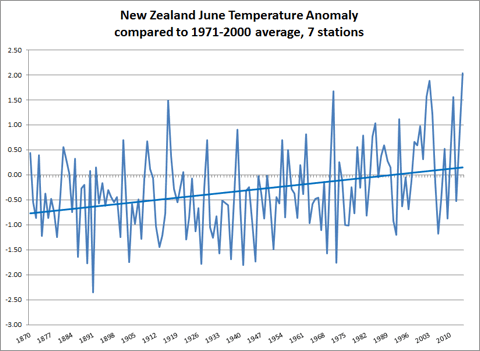
NZ7SSJune14

Hot off the press — or to be precise, Jim Salinger’s laptop: June 2014 was the warmest June in New Zealand since 1870, 2ºC above the 1971-2000 average, as measured by the long term “seven stations series” originally devised by Salinger and maintained by NIWA. On the larger 24 station series the month tied with 2003 at 2.1ºC above the 1971-2000 average. Many stations recorded warmest ever Junes, including Dunedin with 8.7ºC, +1.7°C above average, Invercargill with 7.8ºC (+2.2°C), Kaitaia (14.5, +1.7), Tauranga Aero (13.1, +2.4), Masterton Aero (9.8, +2.3), and Hokitika Aero (+10.4, +2.4). Jim points out that NZ warming is most clearly seen in the winter months (and expressed in the snow and ice record) but often escapes notice because a warm winter month is still “cool” compared with the seasons around it.

[Update 3/7: The Australian Bureau of Meteorology reports that the 12 months ending in June were the warmest July/June since records began (The Age. Jim Salinger tells me that in New Zealand July 13 to June 14 was the 3rd warmest in the long term record.]