
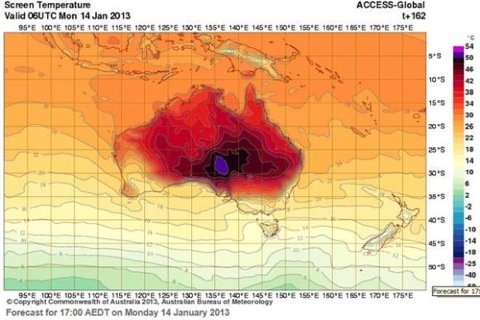
Australia is gripped by a massive heatwave, records are tumbling and fires are burning across the continent. I’m not going to attempt a comprehensive post on the subject — events are moving too fast — but I would like to note a few things. The Bureau of Meteorology forecast chart above (courtesy of Watching The Deniers) for next Monday has forced BOM to add new colours to the hot end of the range, to allow for forecast temperatures over 52ºC — well above the previous national record high of 50.7ºC. Meanwhile the current heatwave has already set a new record for the number of consecutive days where the national average temperature has exceeded 39ºC — now running at seven days, with the heat forecast to continue. That’s the average temperature for the whole of the continent, which is no small place. The previous record was four consecutive days, set in 1973.
The Sydney Morning Herald has a good summary of the records being broken here. See also: Jeff Masters, Climate Progress, New Scientist and the Guardian.
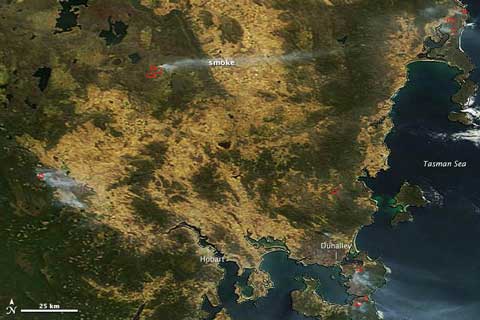
NASA’s Earth Observatory provides this overview of the fires in Tasmania over the weekend that caused chaos and destruction in the normally cool state — Hobart hit an all time high temperature of 41.8ºC, a full degree above its previous record.
Fire danger in parts of New South Wales has been classified as catastrophic, and this NASA Worldview image for Jan 8th appears to show smoke from fires in southern NSW streaming out to the east and over the sea towards New Zealand.
Ben Cubby at the SMH pulls together reactions from the scientific community under the headline “Get used to record breaking heat”, and one quote struck me rather forcefully:
“Those of us who spend our days trawling – and contributing to – the scientific literature on climate change are becoming increasingly gloomy about the future of human civilisation,’’ said Liz Hanna, convener of the human health division at the Australian National University’s Climate Change Adaptation Network.
As George Monbiot notes in the Guardian today, in a column excoriating Australian opposition leader Tony Abbott for his climate denial:
Australia’s new weather demands a new politics; a politics capable of responding to an existential threat.
My comment? That’s what the whole bloody world needs.
Yes, and sadly that arrogant fool – Abbott – is most likely going to be running the country before the end of the year, along with a horde of truly appalling cronies, virtually all of whom – i.e. Turnbull excepted – would sit perfectly happily on an Australian editorial board! The formerly centrist(ish) Australian is now merely a far-Right thinktank that uses the national daily as its newsletter.
It’s hard to recall a period – outside of the McCarthy era in the US – where such a coterie of perverse and ridiculous reactionaries dominated allegedly ‘conservative’ politics. They have chosen denial as their chief response to a world full of problems that their ideology makes it impossible for them to properly perceive or effectively act on.
We might still be able to do something about the climate. The really intractable problem is The Stupid.
Reality will eventually trump ideology, as even the North Korean regime is discovering, but will it be too late?
and reality is hitting the Chinese who are having the coldest winter in 40 years caused by Global warming
http://www.ouramazingplanet.com/3965-china-s-extreme-cold-snaps-records.html
Very predictable, Andy. Thanks for living down to my expectations.
I was pre-empting the expected response to any comment I would make about the Chinese winter.
Luckily “Our Amazing Planet” provided me with the ammunition necessary
As you seem to have difficulty with reading and comprehension, Andy, I’ll post the link re extreme weather and AGW again – just ask a grownup to help you with the big words.
http://www.nature.com/nclimate/journal/v2/n7/full/nclimate1452.html
Edit still not working – here’s another link for your edification, Andy (would that were possible):
http://www.skepticalscience.com/Record-snowfall-disproves-global-warming.htm
Yeah the editor’s save button is now just abut inaccessible – I find I have to click around it multiple times, and then press enter a few more…
Oh, I see!
The edit plug-in has stopped working for me as well. If I can find an alternative, I’ll change. Meanwhile I may just turn it off completely – which might speed page loads…
To be fair, Rob, Andy’s link goes to a story about the Chinese cold spell that explicitly discusses the possible link with a warm Arctic. You might almost think he’d accepted that premise, but then he can be found all over Treadgold’s emporium spinning the usual tosh.
I’m sure that the main reason for Andy frequenting Treadgold’s claque is that, next to them, he almost appears to have a clue…
In your link, they say:
but there is no mention of cold weather events, the ones that I mention.
So it would help if you could provide a link to a scientific paper (ie not “The Amazing Planet”) that supports CO2 induced cold winters in China.
Sorry to the newbys if this appears as trolling. In my neck of the woods, this is called “asking a legitimate question”
No problem, Andy. Here’s a paper, plus an article from
“The Amazing Planet”Scientific American to aid your understanding:Evidence linking Arctic amplification to extreme weather in mid-latitudes
http://www.citeulike.org/user/LiisiJ/article/10465238
Hadn’t seen that article before Rob. Good one. Your post had not appeared when I started my spiel.l.
Enjoying a spot of JAQing off there, andy?
Seriously, you guys really get further and further in the poo with every passing month. The only way you can try to pass off this risible ‘it all balances out’ crap is to stick your fingers in your ears and keep shouting it in your best, well-practised strident cadences, because the heat/cold records are so out of balance that it’s almost surreal.
But keep going, little soldier, and scorn the irresolute chaff, swept aside by the mere gales of reality; because, as we know your name, I can assure you can expect to be justly commemorated as one of History’s Greatest Fools.
The BoM versus andy – now, there’s a tough one…
Record cold in China. Record snowfalls in the USA. Record cold in eastern Europe, thousands of ships trapped in sea ice.
I take this very seriously Bill. I need to know how global warming caused this.
We need to take action now. We need to urge our leaders to stop this global warming caused cooling.
Read the references you’ve been provided with, and discuss that. Any more of this snark will simply not make it through moderation. (See comment policy – “good faith” required.)
And note the level of imbecility required to not comprehend that snow is precipitation, and there’s more of that – along with all those massive flooding events – because…?
I recently encountered one of these clowns elsewhere capering about a ‘new snow record’ for the NH; for December(!) Thing was, if you switched to all the other months on the very chart he linkied to the tale reversed; down, down, down all around. Try it yourself. Dramatically – and statistically significantly – so, as it turns out.
And, incidentally, just as with the Arctic ice, snow area charts ain’t telling you anything about volume. Except, of course, that it ain’t gonna have been going up! 😉
So, thanks for yet-another own-goal, andy. HINT: try getting outside the bubble at CC some time.
As I said, he has to keep blathering on like this because of that queasy feeling in his bowels. Even he knows there is no ‘balance’, or anything even approaching it.
This is the world that he and the rest of the rabble have been cheering on – and I can assure you, andy, that given your continual charming performances here many of us will ensure that it’s sheeted home to you, at every opportunity.
Thousands of ships trapped in sea ice? That’s new to me.
You might be interested in reading the Winter weirdness series on the Arctic Sea Ice blog, Andy. Part four is about China, part three about Russia, and part five is about NH snow cover and the acceptance by fake skeptics that it is probably caused by missing Arctic sea ice.
Worst in 3 years, eh? And 291 km2.
Well, that certainly ‘balances out’ a 7 day all-time heat record for the entire continent of Australia!
Do you ever bother to check these things, andy? Or do you just hope we won’t?
Sorry, one thousand ships trapped, not thousands in the plural, my mistake
http://articles.timesofindia.indiatimes.com/2013-01-04/the-good-earth/36148392_1_sea-ice-ships-cucumbers
When you’ve got a moment, andy, perhaps you could calculate the ratio of the area of the continent of Australia – you now, the place that just went through a week solid of it’s highest temperatures ever recorded – as opposed to the 294km2 caught up in the worst freeze for 3 years? Ta.
(I know you won’t do it, but your really might as well put a ‘kick me’ sign on your back, don’t you think? And we will!… ;-))
There’s no point in trying to explain it to these fools Andy, they simply don’t get your astute point that cold temperatures in China balances the extreme heat in Australia with the net overall effect between the two regions averaging zero. Perhaps some more emissions might even help the Chinese in their icy cold conditions, so the least we can do is burn more fossil fuels to help them out. After all, the cold is starting to affect their wheat harvests.
You forgot to mention that minor omission about the preceding drought:
http://www.bloomberg.com/news/2013-01-07/china-s-coldest-winter-in-28-years-hurts-wheat-crop-center-says.html
“Balances”?? Only in the minds of the deranged – and of climate trolls. Or are you being satirical …
The latter, surely?
I was hoping there were enough clues there for the penny to drop…
It was meant to be more or less in the spirit of Andy’s perverted logical sense.
One can only be deeply moved by his empathy toward those suffering under these extreme climatic conditions,
Hello All – my first post – I’ve been lurking for a while. Sorry to see you have the usual troll problem here.
You could have knocked me down with a feather when I saw that Liz Hanna quote in not just one, but two, smh articles today (smh might not be as denialist as The Australian but there sure seems to be a dearth of coverage of AGW).
If I can ever be of assistance to any non-troll please let me know. Actually I might be willing to help a troll if they require homemade ECT or need me to trepan them with my hand drill (no refunds).
Please keep up the good work and all the best for 2013.
Off the top of my head, but the clues below will take you to the research.
Towards the end of my schooling I learned the word “parameter”. Later, when I began my education, I learned that parameter applied not only to maths but to just about any attempt to establish what is true. Some assertion can only be true if the parameters within which it is true are also stated. Just to make it simple in todays language it’s called puting things in context. If we are to consider the slow passage of heat and drought alternated with floods and cold that process round the northern hemisphere we need a context within which this can be understood. Climate scientists have been working on this for some years now.
So certain keys will help find the science and grow the understanding:
.
1. Reduction of thermal gradient from equator to arctic with warming – i.e. less stratification. (Unlike southern hemisphere)
2. The meandering Rossby waves. They describe the boundary between warm and cold – i.e. the jet stream. With reduced gradient the meanders grow larger and slower intensifying with time whatever weather is happening.
3. The arctic oscillation. It used to be that the warmer south kept the arctic air locked up over the arctic ocean. That is no longer the case. Also greater freeze and thaw is throwing masses of energy around. Warmed air from the actic is still freezing cold to people in temperate zones. Now and then this escapes as has been seen a number of times in recent years over the eastern US, Europe and China for examples.
So we note that a Rossby wave bulging toward the equator may contain arctic air while the alternating waves extending toward the arctic contain warm tropical air, to put it rather simply. Various other oscillations contribute more variability.
So I was intrigued a couple of northern winters back to note that while Eastern US was moaning under a load of snow (More moisture in the air, more precipitation) Further north where one would suppose the atmosphere to be colder still, Canadians were still out kayaking in open waters where winter freeze had been the norm. Right up the Eastern side of Hudson Bay is a town that at the same time as Americans were shivering loudly were noting that the freeze had come late and current temperatures were 28° above normal for the time of year (Farenheit ?) – the temperature being as high as -2°.
So it does not do to take some weather condition and generalise from it to the whole planet, or suppose it an argument against a global observation. We have to look at the underlying trends and discern the various relationships. I first perceived this while I was 4 years old. It was pouring outside in Manurewa. An aunt arrived from Auckland saying it was fine in Auckland. I realised that weather was local and spent the next day and many days after gazing at the sky to work out where the rain was coming from and how local it could be. Readers of books on child development will know that age four to five marks the period where a child’s global feelings about the “world” give way to a more discerning relativaty. You must have gone though similar changes.
So do we pick up on cold in China or heat in Australia or SW US or floods here or there and try to draw or imply a global conclusion on that one thing without context like a four year old, or seek understanding of the parts in the whole like a scientist?
So despite deep cold in places I read that it has been 27 years since global temperature for any month fell below the average for the preceeding decades and much more on that point.
——–
To reiterate and extend: as a general principle higher thermal gradients mean more stratification of media, lower thermal gradient means less stratification and therefore more mixing. Stratification of the northern hemisphere atmosphere is decreasing. Stratification of the southern hemisphere atmosphere is increasing, (which highlights the huge difference between antarctica and the arctic ocean). With ocean warming, particularly toward the poles, verticle stratification is increasing which reduces the upwelling of nutrients in polar waters eventually threatening the ocean food supply. Have you ever wondered why cold waters are so prolific in food production compared to tropical waters?
Now I would like a better overview of what is happening in the Southern hemisphere.
Noel
Can you lay the rabbit fence over that map? Is the stretch of moderate temperatures in the western part correlated with the vegetation on one side of that fence?
You’ve probably looked at the map of the 3 fences – they don’t correlate it seems to me. They are a hundred + years old and have been deemed irrelevant since that rabbit disease they tried, From what I read there are so many holes dingoes get through to the sheep all over and only the emus are still kept out. Nevertheless I wonder if the shape of that cooler area corresponds with something.
Current Marree forecast. They have a cool change at the moment – 38C. But on Sunday they’re looking at 49C – with ‘showers increasing’. Monday: 43 – ‘showers’.
Should this unlikely – and unGodly! – combination actually transpire, I suspect this will also be a new record, at least for Australia. IIRC the record temperature for high-temperature rain was reset again recently in the US, 6 months after the previous record, and about 3 years after the one before that.
Now, I wonder what conditions can have caused that? 😉
I fished out the story about the recent highest-temperature rainfall events via Jeff Masters at Wunderground.
The previous record is rainfall at 46.1C (115F) in Needles, California, in August last year.
Because forecasts change (because, um, forecasts change, as new information comes to light, and all that – see below) there’s now no rain forecast for Marree – for better or worse! So that’s an interesting record that looks like its not going to be challenged in Australia any time soon.
It’s still looks like it’s going to be a blistering hot weekend, however…
That purple patch forecasted for next Monday has disappeared. See the updated forecasts at http://www.bom.gov.au/australia/charts/viewer/index.shtml?type=T&level=2m&tz=AEDT&area=Au&model=CG&chartSubmit=Refresh+View
While we’re on the topic of weather and imputations of CAGW – any comment on NZ average temperature in 2012 being colder than the 1971-2000 annual average ?
Your link points to the right page, but not the right time. You are right however – when you click through to Monday afternoon, the big purple splodge is no longer there. Still going to be rather hot in central Australia – 46C+
A few thoughts on NZ’s 2012 (see here for NIWA’s annual summary, and here for the annual temp graph): NZ’s annual average temperature is notably variable, and affected by the state of ENSO. With a strong La Niña at the start of 2012 we had a cold start to the year, and ended the year ENSO neutral. Wouldn’t surprise me to see 2013 warmer, but not in record territory. The next substantial El Niño could bring a new record, though. As ever, NZ’s temp tells us little or nothing about global temps.
And?
Use of the term ‘CAGW’ is going to be a clue, of course, but do us the honour of spelling out your theory as to why it’s ‘disappeared’, and why this matters first.
In the meantime, watch the video in the latest post.
Bill, the purple patch has disappeared because the predicted greater than 50 degree temperatures are no longer likely to occur. It matters because it is a central (if not main) point of this posting and other attention-seeking headlines such as SMH’s “Temperatures off the charts as Australia turns deep purple” http://www.smh.com.au/environment/weather/temperatures-off-the-charts-as-australia-turns-deep-purple-20130108-2ce33.html
I agree with Gareth’s assessment that New Zealand’s climate and weather are largely impacted by large scale weather patterns.
Record-breaking high or low regional temperatures for such brief periods shouldn’t be used to impute global cooling or warming – these records are nearly always due to other unusual weather patterns.
‘attention seeking headlines’
There are other kinds?
Intriguing. So, was there something false or misleading about the bureau’s initial forecast? Do you think that it’s somehow not legitimate for people to take note that weather conditions have reached a state where it’s necessary to add this extra colour because of anticipated unprecedented temperatures? Well, yes you do, apparently. Excuse me for disagreeing.
You really think correction of an earlier poor choice of colour range is significant news ? So significant it’s worthy of misleading attention-seeking headlines ?
It’s inevitable with any relatively chaotic system like the weather that new regional highs (and lows) will be reached over time, with or without any global temperature influences.
The fact is that the purple really hasn’t been necessary this time – it may well be useful sometime in the future, but its addition to the colour scheme is over rated – it should have been added earlier to allow for such “unprecedented temperatures” as the “50.7 degrees reached on January 2, 1960 at Oodnadatta Airport in South Australia”
In a stationary climate system, you would expect equal numbers of new high and low temp records. We do not have a stationary climate, we have one that’s changing fast, and so we see far more new high temp records than cold. As a BOM spokesman told Ben Cubby:
Note that the BOM spokesman’s use of the word ‘Clearly’ is unsupported (and likely unsupportable). There were record cold temperatures throughout Australia in 2010 and 2011 – were those temperatures also responding to the ‘background warming trend’ ?
There may well be a background warming trend, but citing brief periods of record breaking regional temperatures as proof is inadequate – it looks more like an opportunistic attempt to foster alarmism.
See, your tactical error was to go with ‘CAGW’ from the off, which automatically alerts those familiar with the debate as to which barrow you’ll be pushing.
Please find the ‘precedent’ for the recent run of national average temperatures in Australia? In the light of the quotes afforded from the BOM you are being presented with an opportunity to look very foolish indeed here. But also an opportunity not to.
Please explain how charts that do not account for regularly incremental temperatures above a certain value should designate values above their previous maximum? Whether this (the highest temperature ever recorded in Australia, I might add) happened in 1960, or not I might add.
And, then, you’re wrong –
Well, yes, but the ratios of one to the other will always change as the planet heats and cools.
I think you’re suggesting these ratios could be expected to be roughly equal over time. The point is that they’re not. ‘Without’ any ‘influence’ – maybe they could be, though surely the chances of being the greatest (or smallest) thing ever diminish over time – and sheer numbers of instances – in such circumstances?
But ‘with’ influence? You’re kidding, right?
We know that heat records are significantly outpacing cold records, and have been for a long time.
That’s ‘influence’ at work. Therefore any hypothetical ‘neutral’ conditions do not exist.
And as Monbiot points out in the article referred to in Gareth’s post, quoting a paper from Jim Hansen –
Now, that’s influence! Therefore ‘neutral’ conditions do not exist.
Interesting choice of words “looking foolish” “tactical errors” “kidding” & “barrow pushing”. Resort to ad-hominem is indicative of a poor argument – focus on the subject, not the person.
You say ratios of hot and cold records are the significant indicators of global climate influence. Then why all the focus on a one-off regional high temperature exception that’s easily attributable to special weather patterns ? Worse still, the headline focus is on an extension to a colour code to accommodate the POSSIBILITY of a one-off record temperature that is now unlikely to occur next week !
Wrong. Did you read any of the BOM’s press releases? This isn’t a few hot days. And this isn’t an isolated event globally.
Anyone who maintains that they know more than the people who do things for a living, and had to study for a long time to get there, tend to afford themselves ample opportunities for looking foolish. This generally doesn’t stop them, though.
You know, like claiming that trends in the ratios of heat and cold records, or huge shifts in those regions experiencing extraordinarily high temperatures, aren’t significant indicators of the direction in which the climate is heading.
I suggest you take the tactical advice; ‘CAGW’ is a strawman argument used by Denialists. Use it outside the epistemic bubble and you’re immediately identified as a member of the tribe. Disbelieve this at your peril.
And accusing the BOM of ‘fostering alarmism’ is similarly absurd. Next usually comes ‘they’re doing it for the money’ of ‘they’re in the pocket of the politicians’, which is ironic given that most politicians just want this problem to go away.
You’re simply refusing to understand the point. Show me the cold records that keep pace with – or outstrip – the heat records. Show me your research to counter any of this. You can’t, and you don’t have any. This is why you are reduced to conspiracy theories like suggesting that the BOM are ‘opportunists’ indulging in ‘alarmism’.
And yet you play the tone troll with regard to ad hominem arguments. You’ll be unable to see the obvious contradiction there, too, of course; others, however, will manage it.
And ‘regional temperatures’. The entire continent of Australia? Give me a break!
What sensible people conclude is that if folks like the BOM think something is alarming, then it’s alarming. The remainder talk themselves into all sorts of things…
Cadae is wrong Bill. In a climate which is stationary i.e. no long-term warming or cooling trend, the chance a record-breaking heat extreme actually falls. This is known as the 1/n rule. See this SkS post:An American Heatwave: The United States Glimpses its Hot Future.
More importantly; I don’t what the situation is like in your neck of the woods, but keep safe buddy. I wish it were otherwise, but these types of mega heat waves are only going to grow more intense and more frequent in the future.
The problem with citing the climate 1/n rule is that it ignores weather systems, and it is these other weather systems that can easily produce records regardless of a climate trend.
Also from your link, it’s great to see that SkS agrees with my point about the incorrect focus on heat records:
“Scientific understanding is not sufficiently advanced enough to be able to attribute singular heatwaves or heat records to either global warming or natural variability.”
Sorry, Cadae, but you are not making sense. All records in the climate system are generated by weather events. The rule DW refers to means that new records become less common the longer the data set, provided that the climate is not changing. But it is – getting warmer – so we see more hot records and fewer cold ones. What is also remarkable is that the new records are beating the old by a very large margin – something that would be very rare in an unchanging climate.
I suggested some people talk themselves into all sorts of things. Let’s look at the linked article, and see how it ‘agrees’ with Cadae, shall we?
“If Rob’s around he might want to comment.”
Bill, I think you pretty much have it covered.
And this seems like a good place and time to insert a link to Rob’s latest post at SkS – Ocean Heat Came Back to Haunt Australia.
PS Space Invader icons!?
Here’s a pretty picture for andyS, should he still be around after the drubbing he took over the Great Freeze of China:
http://wwwp.dailyclimate.org/tdc-newsroom/2013/01/australia-wildfires
Alas, I expect he’s retreated to the comfortable vacuity of Treadgold’s blog, where the cause of the Oz heatwave is all those grant-hungry climate scientists, who are probably poking hair-dryers out of their windows and deliberately leaving them on all night…
The Arctic is about 10C above average, as it has been every winter for some time.
http://ocean.dmi.dk/arctic/meant80n.uk.php
Relatively the warmest part of the planet at the moment, and more than enough to balance out that Chinese cold, which is due to global warming anyway.
Yes I agree Toby, the record cold in China is caused by global warming, as is the cold winter they are experiencing in India, the exceptional cold in Alaska, the snow in Tel Aviv this morning, (first since 1950), the exceptional snows they have received in the USA. All caused by global warming.
Naturally, it’s obvious
Cue Dr David Viner please…
Andy, why not try to read and understand some of the material people have generously provided for you to read about the impact of a warming Arctic on NH wetaher patterns? Because if you can’t be bothered to do that, and discuss the issue sensibly, then I can’t be bothered to allow your comments through moderation.
Thanks.
Gareth, you’re probably busy reading up on that US climate report, but did you have post planned in response to that infantile NZ Herald editorial?
The Jekyll & Hyde reporting of climate appears to be a deliberate strategy employed by some mainstream media in order to confuse the public, foster denial and, ultimately, to delay urgently needed action in regard to global warming.
When all else fails, there’s always incomprehension!… 😉
[Snipped: see my last comment to you. GR]
There may be a plausible explanation that links CO2 induced warming to cold winter weather in the NH, but there might also be a plausible explanation that it is just normal weather that we would expect from a cyclic climatic system (whether or not there is an AGW signal superimposed on it)
Unfortunately, ex cathedra statements such as “the cold winter in China is caused by AGW” just gets my BS meter red-lining.
What, you mean it’s not the coming ice age?
Well, perhaps, yes, petal, and if only there was any evidence for your position, your life would be perfect.
Still, I suppose if we’re going to determine global climate trends based on areas of 294km2, anything is possible!
I am not basing global climate trends on 294km2. The story you refer to was concerned with the sea ice trapping the 1000 ships. The whole country of China is having the coldest winter in 28 years,
And, if you are capable of reading, you will be aware that the ‘thousand ships’ were trapped in 291km2 of ‘sea ice’, which was the highest level ‘for three years’.
Also, there is a clear and significant distinction between ‘for 28 years’ and ‘since records began’. Also, heat records are way outstripping cold records, and you have no response to this beyond the anecdotal – and silly!
And, do you seriously deny that the dramatic loss of Arctic sea ice has had a massive and freakish impact on the weather patterns in surrounding regions? Well, yes you do, but that’s hardly an endorsement of your intellect, now is it?
Wow, that’s a rather humiliating climbdown, andy. You’ve gone from “cold weather in China proves AGW is wrong” to “cold weather in China might be caused by normal weather” in the space of half a dozen posts.
You’ve just abandoned your entire belief system. I can’t believed you caved so quickly.
cTG I never mentioned anything about AGW whatsoever. Anything I supposedly climbed down from is purely in your imagination.
So when you brought up China in the first place, you didn’t have an actual point to make, you were just mindlessly trolling? Interesting admission.
If you ever do have a real contribution to make, please do signal clearly. Getting upset at being called a troll when all you do is trolling is pretty pathetic. Troll.
The ice that froze a thousand ships… 🙂
But that just goes to show how well this event falls into the winter weirdness category, and when a senior engineer of China’s National Climate Center then says: “Observation and data analysis showed that Arctic sea ice loss may cause cold and snowy winters in parts of Asia”…
Well, that’s pretty interesting.
So as a denier troll you might want to be careful with using that particular event as a sign that everything balances out, that extreme cold denies the existence of AGW, and all is well. Like the wise R. Kelly once sang: Coz’ it might turn around on you.
Thanks for the charming words Mr Never
Oops, this was in reply to Andy’s: “Sorry, one thousand ships trapped, not thousands in the plural, my mistake”
Looks like the Discount Viscount “Mad-Eye” Monckton will be arriving in Australia just in time to reassure exhausted firefighters that global warming is only a myth…
This is one I hadn’t taken in –
Now, that’s what I call mean!…
It is not exactly plain sailing in NZ either. There was a scrub fire yesterday in Christchurch, another today (still going) in West Melton, and some idiot deliberately torched the Akaroa bakery last night.
Speaking of idiots deliberately torching things, Andy, would you care to comment on the Met Office post at the top of the page, wherein your mate “Dellers” / Delingpole has been caught blatantly lying again?
Oh I see, it is based around an article in the Daily Mail that Delingpole wrote.
I think his main points are probably correct, especially the bit where the MO released a downgraded warming forecast on Xmas Eve.
Only climate anoraks notice things like that, of course.
Delingpole doesn’t write “articles” – he oozes noxious slime masquerading as journalism. I could point you to reactions from a couple of English forums, but they might be beyond your limited intellectual capacity.
My limited intellectual capability reminds me that Delingpole won his last PCC complaint against him made by the University of East Anglia.
He is a self-described polemicist and pamphleteer, who is writing for the “Daily Mail”, of all places, and I didn’t bring up the subject in the first place.
This appalling and ridiculous little creep – Delingpole – actively encourages the kind of lynch-mob mentality that he’ll need to look out isn’t turned right back on himself one day. This strident, strutting jackass may yet live to see his ‘rock star’ prominence as much more in the way of a liability than an asset in an age when his tribe’s name will be ‘mud’, at best…
This cartoon that John Cook has pointed out fits in rather nicely.
Bugger! There’s 2 links there – one to the ABC’s article, the other to the CC’s report. I’m sure you’ll figure it out!
Snap! And in the US the Federal Advisory Committee’s Draft Climate Assessment Report has been released.
Here’s the opening paragraph of the executive summary –
That’s grown-ups 2, fantasists nil. Let the howling commence!…