Hangin’ on #2

wilkins090124.jpg

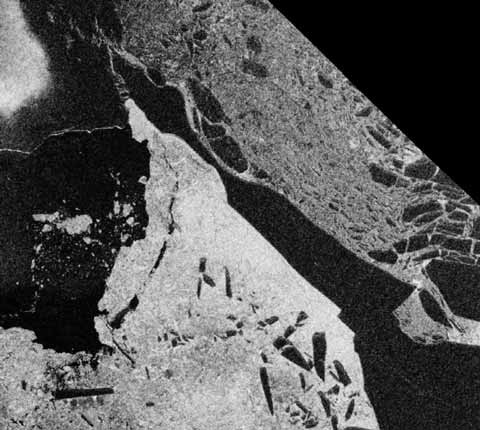
Here’s the latest imagery of the Wilkins Ice Shelf from the European Space Agency’s amazing “webcam from space” page (the ice shelf is the black structure running from top left to bottom right — sea shows as white). This image was captured on Jan 24th, and clearly shows the narrow 2km neck referred to in my recent post. Take a look at the “webcam” — the animation is regularly updated as new images are processed. In Hot Topic, I remarked how satellite views of the earth enable my senses to work overtime — this is a fantastic near real-time example.

[Hat tip to Timothy Chase in comments at RealClimate here.]

You keep me hangin’ on

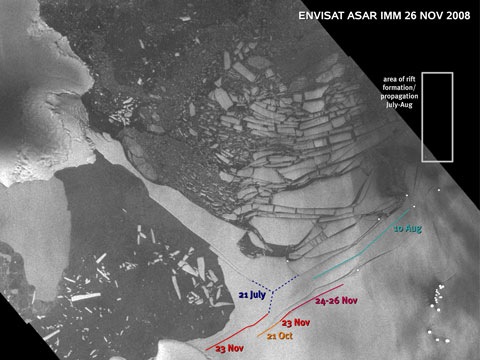
wilkins26nov480.jpg According to Alister Doyle, Reuters’ man in Antarctica (now that’s a job I’d like to try…), what’s left of the Wilkins Ice Shelf is on “the brink of collapse with just a sliver of ice holding it in place“. Earlier this week, Doyle reported on a trip with the British Antarctic Survey to the remnants of the ice shelf:
“We’ve come to the Wilkins Ice Shelf to see its final death throes,” David Vaughan, a glaciologist at the British Antarctic Survey (BAS), told Reuters after the first — and probably last — plane landed near the narrowest part of the ice. […]

BAS scientists and two Reuters reporters stayed about an hour on the shelf at a point about 2 km wide.

“It’s very unlikely that our presence here is enough to initiate any cracks,” Vaughan said. “But it is likely to happen fairly soon, weeks to months, and I don’t want to be here when it does.”

The Dominion Post‘s Paul Easton picked up the report, and managed to turn it into a story about sea level rise. Rather odd, because Doyle explicity notes:

Loss of ice shelves does not raise sea levels significantly because the ice is floating and already mostly submerged by the ocean. But the big worry is that their loss will allow ice sheets on land to move faster, adding extra water to the seas. Wilkins has almost no pent-up glaciers behind it. But ice shelves further south hold back vast volumes of ice. “When those are removed the glaciers will flow faster,” Vaughan said.

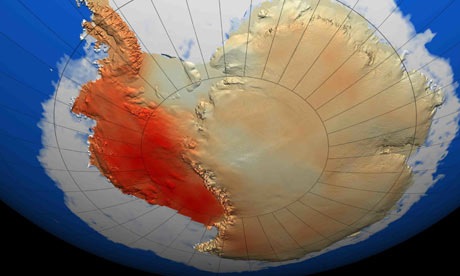
Unfortunately for us all, the most recent research suggests that the West Antarctic is warming significantly, as this image from the cover of this week’s Nature demonstrates rather well:

West-Antarctic-in-red.jpg
(E Steig/NASA)

See also: Guardian (UK) on Steig et al, Reuters on summer rain on the Antarctic Peninsula and the clear air down there, and a Danish researcher finds yet another reason to project that sea level rise this century will exceed IPCC estimates. More on land ice and the Arctic next week.

[The Supremes]

The cracks are showing #2 (polar notes)

wilkins26nov480.jpg

Summer’s arriving on the Wilkins ice shelf, and its disintegration continues. New cracks are threatening to destroy the ice “bridge” that’s been holding the ice shelf pinned between Charcot Island (top left) and the Antarctic peninsula. This picture, captured by the European Space Agency’s ENVISAT satellite on November 26, shows the new cracks (coloured lines) and the dates they first appeared (NASA version here). If the chunk of ice under “21 July” breaks away, the long thin bridge will lose support and follow suit, the ESA analysts say.

Meanwhile, a team lead by Richard Alley at Penn State has worked out that ice shelf calving – where icebergs break away at the edge of an ice shelf – is critically influenced by the rate at which the ice shelf is spreading out. The PSU release notes:

For iceberg calving, the important variable — the one that accounts for the largest portion of when the iceberg breaks — is the rate at which ice shelves spread, the team reports in the Nov. 28 issue of Science. When ice shelves spread, they crack because of the stresses of spreading. If they spread slowly, those cracks do not propagate through the entire shelf and the shelf remains intact. If the shelf spreads rapidly, the cracks propagate through the shelf and pieces break off.

When ice shelves break up, the glaciers that feed them can speed up noticeably, dumping more ice into the ocean. Over recent years, the role of water as a lubricant for glacier flow has been receiving a lot of attention (rubber ducks were recruited as under ice research tools in Greenland this year), and the BBC reports that a sub-glacial “flood” under the Byrd Glacier which feeds ice at the rate of about 20 billion tonnes a year into the Ross ice shelf caused that to increase to 22 billion tonnes over 2006. It has since returned to normal.

Up north, the NSIDC reports (Dec 3) that it continues to be warmer than average, even though the sea ice is now covering the whole Arctic ocean.

Celia of the seals

sealhat.jpg It appears that my wish is someone’s command. Last month, blogging on the continuing break-up of the Wilkins ice shelf, I noted a reference to “seal hats” as data gathering devices and expressed a wish to see them. And here they are! Little devices glued to the heads of elephant seals that gather data as the seals as they go about their daily business. A new paper in the Proceedings of the National Academy of Science explains:

Here, we show that southern elephant seals (Mirounga leonina) equipped with oceanographic sensors can measure ocean structure and water mass changes in regions and seasons rarely observed with traditional oceanographic platforms. In particular, seals provided a 30-fold increase in hydrographic profiles from the sea-ice zone, allowing the major fronts to be mapped south of 60°S and sea-ice formation rates to be inferred from changes in upper ocean salinity. […] By measuring the high-latitude ocean during winter, elephant seals fill a ‘‘blind spot’’ in our sampling coverage, enabling the establishment of a truly global ocean-observing system.

Abstract here, full paper here[PDF]. More coverage at New Scientist, e! Science News.

Melt your heart

080710Wilkins.jpg Typical winter weather down here – we’ve gone from snow last weekend to sunny days and sharp frosts, and now howling Norwester and unseasonal, but not atypical warmth (having said that, the radio reports that Kaikoura recorded 21ºC at 1am last night, which is both). Further south, however, strange things are afoot at the Wilkins Ice Shelf. It began a spectacular break up earlier this year, and this is continuing in the middle of the Antarctic winter according to imagery from the European Space Agency’s Envisat. The ESA press release includes a fantastic animation showing how the ice has fractured over the last couple of months. Ted Scambos from the National Snow and Ice Data Center in the US explains how this might be caused:

“The persistently low sea ice cover in the area and data from some interesting sources, electronic seal hats [caps worn by seals that provide temperature, depth and position data] seems to suggest that warm water beneath the halocline may be reaching the underside of the Wilkins Ice Shelf and thinning it rapidly – and perhaps reaching the surface, or at least mixing with surface waters.”

I’d love to see a picture of those seal hats! And a scientist fitting one… I’ve heard some references to anomalous warm water around the Antarctic as a mechanism for ice sheet melting – here it seems to be in action.

Up North, the summer melt continues, and the odds on my bet with William “Stoat” Connolley seem to be tilting in favour of my vicious, sharp-toothed friend. Both the Cryosphere Today and NSIDC measures are showing area/extent tracking above the same time last year, and this week a team at the Alfred Wegener Institute provided a new form guide.

The ice cover in the Arctic Ocean at the end of summer 2008 will lie, with almost 100 per cent probability, below that of the year 2005 — the year with the second lowest sea ice extent ever measured. Chances of an equally low value as in the extreme conditions of the year 2007 lie around eight per cent.

They derive this by taking ice conditions at the end of June, feeding them into their sea ice model, and then forcing the model with the weather experienced over previous melt seasons. Looks pretty convincing, but any forecast is limited by the accuracy of the initial conditions data fed into the model. Still plenty of melt season left. It ain’t over ’til Dame Nellie finishes her peach Melba.

[Update: Wayne Davidson, in a comment at RealClimate, clearly thinks I’ve still got a chance.. 😉 ]

Finally, this will be an interesting blog to follow over the next few weeks. A team of US and Russian scientists are rafting down a Siberian river, gathering data on forests and tundra. Some people have all the fun…

[Update 2: It looks like the increased popularity of the AMSR-E sea ice images from Bremen has prompted Cryosphere Today to update their graphics for the Arctic. Positively groovey, perhaps even psychedelic, man. Way to go, Bill! Much easier to see what’s going on.]

[Update 3: The BBC reports on a Russian scientific team having to be rescued from their drifting research station because it’s melting fast.]