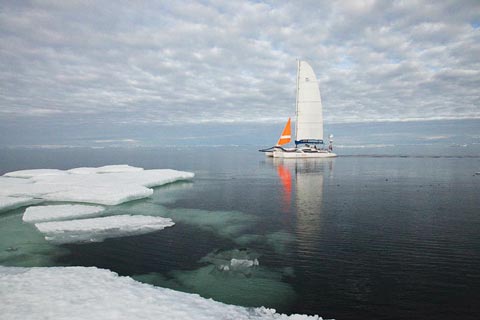
 The Arctic Ocean has been circumnavigated by sailing vessels in a single season for the first time. The Norwegian trimaran Northern Passage reports that it has passed 74ºN, traditionally regarded as the eastern end of the NW Passage, and is now sailing into Baffin Bay heading for Pond Inlet. The Russian boat Peter 1is reported to be about one hour’s sailing ahead of them. In their blog post marking the milestone, Thorleif Thorleifsson and Børge Ousland provide this telling comment:
It is, unfortunately, the dramatic changes in Arctic sea ice conditions in recent years that have made this trip possible. On the time of Roald Amundsen it took five to six years to complete the same distance, due to the extremely difficult and demanding ice conditions. Now we have proven that it is possible to make the voyage in a 31-foot fibreglass sailing boat, equipped with a 10 horsepower outboard motor for emergencies. This shows how dramatic and how fast these changes are happening. The changes that we are witnessing will influence climate on a global scale, in addition to the whole range of animal life in the Arctic – especially seals and polar bears, whose lives are dependent on the sea ice.
It is our hope that our voyage will be seen as a strong, visible symbol of the scale and the speed of these changes.
Congratulations to both teams for their remarkable achievement. Given that the first circumnavigation by a sailing vessel was made by the French yacht Vagabond over two seasons as recently as 2002-2003, it’s clear that the pace of change in the Arctic is not slackening. Reflecting that, the Arctic Forum — a meeting of countries with claims to Arctic territory — is currently underway in Moscow. The Independent reports that the mood of the meeting is “conciliatory”, but the pressure to establish territory is growing as the rush to exploit oil, gas and mineral resources intensifies (see BBC for more).
[Updated] And to remind us that what’s at stake in the Arctic is a great deal more than a few billion barrels of oil, Yahoo News carries an IPS story on Arctic warming and the methane problem. If the average global warming is held to 2ºC (which doesn’t seem likely under present policy settings), the Arctic will warm much faster. NSIDC director Mark Serreze is characteristically blunt:
“I hate to say it but I think we are committed to a four- to six-degree warmer Arctic,” Serreze said.
If the Arctic becomes six degrees warmer, then half of the world’s permafrost will likely thaw, probably to a depth of a few metres, releasing most of the carbon and methane accumulated there over thousands of years, said Vladimir Romanovsky of the University of Alaska in Fairbanks and a world expert on permafrost. […]
That would be catastrophic for human civilisation, experts agree.
In other words, we have very good reasons to believe that settling for a 2ºC target would be to acquiesce in a global disaster. We can only hope for two things: that the climate commitment (the inevitable warming “in the pipeline”) does not push the Arctic into a huge release of methane, and that the world’s leaders wake up to the real scale and urgency of the problem. For all our sakes
[Oasis]

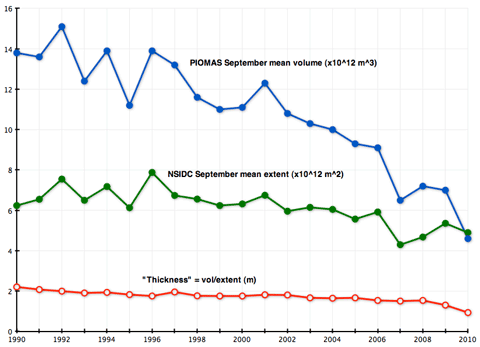
 A few days ago I used a combination of Arctic sea ice volume data from the University of Washington’s PIOMAS model and NSIDC sea ice extent numbers to