The Climate Show: Beta 1

Introducing The Climate Show, the first (beta 1) stab at a web-based “radio with pictures” programme about climate news science, policy, politics and solutions. It’s the brainchild of KIWI FM’s Radio Wammo breakfast host Glenn Williams, one of the most innovative young broadcasters in New Zealand, and he’s roped me in to add, er, something or other… 😉

The show was recorded last week via Skype video conference, and we discussed new temperature records, the state of the Arctic, chatted with Kevin Cudby about his new book From Smoke To Mirrors, recommended the Skeptical Science web site and iPhone app, and then discussed some recent developments in solar photovoltaic technologies. It’s available at Youtube, as a podcast via iTunes, and will soon have its own site at theclimateshow.co.nz . You can follow the show on Twitter at @TheClimateShow. We’re aiming to record a programme every couple of weeks to begin with. All feedback welcome — what do you think of the show and what would you like us to cover? Any guests you’d particularly like us to feature (NZ and worldwide)? And if you like the show, tell your friends… Links to the stuff we talk about below the fold.

The Climate Show (audio)

Continue reading “The Climate Show: Beta 1”

Arctic report card 2010: a one-way trip to warming

Last week NOAA released the 2010 update of its Arctic Report Card, covering the 2009/10 winter season and 2010 summer sea ice minimum. It makes for sobering reading. Greenland experienced record high temperatures, ice melt and glacier area loss, sea ice extent was the third lowest in the satellite record, and Arctic snow cover duration was at a record minimum. It’s worth digging through the whole report — it’s concise, well illustrated and referenced back to the underlying research — but a couple of things struck me as really important.


The first is the dramatic melting seen in Greenland this summer. From the Greenland report card:

Summer seasonal average (June-August) air temperatures around Greenland were 0.6 to 2.4°C above the 1971-2000 baseline and were highest in the west. A combination of a warm and dry 2009-2010 winter and the very warm summer resulted in the highest melt rate since at least 1958 and an area and duration of ice sheet melting that was above any previous year on record since at least 1978.

And…

Abnormal melt duration was concentrated along the western ice sheet (Figure GL3), consistent with anomalous warm air inflow during the summer (Figure GL1) and abnormally high winter air temperatures which led to warm pre-melt conditions. The melt duration was as much as 50 days greater than average in areas of west Greenland that had an elevation between 1200 and 2400 meters above sea level. In May, areas at low elevation along the west coast of the ice sheet melted up to about 15 days longer than the average. NCEP/NCAR Reanalysis data suggest that May surface temperatures were up to 5°C above the 1971–2000 baseline average. June and August also exhibited large positive melting day anomalies (up to 20 days) along the western and southern ice sheet. During August temperatures were 3°C above the average over most of the ice sheet, with the exception of the northeastern ice sheet. Along the southwestern ice sheet, the number of melting days in August has increased by 24 days over the past 30 years.

Not good news for the ice sheet. The atmosphere report card draws attention to the impact Arctic warming is having further south, dubbing it the warm arctic/cold continents pattern (WACC).

While 2009 showed a slowdown in the rate of annual air temperature increases in the Arctic, the first half of 2010 shows a near record pace with monthly anomalies of over 4°C in northern Canada. There continues to be significant excess heat storage in the Arctic Ocean at the end of summer due to continued near-record sea ice loss. There is evidence that the effect of higher air temperatures in the lower Arctic atmosphere in fall is contributing to changes in the atmospheric circulation in both the Arctic and northern mid-latitudes. Winter 2009-2010 showed a new connectivity between mid-latitude extreme cold and snowy weather events and changes in the wind patterns of the Arctic; the so-called Warm Arctic-Cold Continents pattern.

So now you know where the WACCy winter weather’s coming from…

Gone for good: Arctic Ocean ice free all year by the 2040s?

A few days ago I used a combination of Arctic sea ice volume data from the University of Washington’s PIOMAS model and NSIDC sea ice extent numbers to project that the Arctic Ocean would be effectively ice-free in late summer within ten years. The key to that exercise was the rate at which the volume of sea ice has been declining — 350 km3 per year over the last 30 years for the full dataset, 410 km3 per year over the last 20, and 740 km3 over the last decade at summer minimum. The rate of volume decline has obviously been increasing. Using those numbers to project ice extent in the future is one thing, but they also tell us something interesting about the overall Arctic heat budget — and we can use that to make a rough guess about when the Arctic will become ice-free year round. The answer is surprising…
Continue reading “Gone for good: Arctic Ocean ice free all year by the 2040s?”

Five years (threnody for Arctic sea ice)

Earlier this month the US National Snow & Ice Data Center issued its analysis of this year’s Arctic sea ice minimum — at 4.60 million km2 on September 19, the third lowest extent in the satellite record. However extent (defined here) doesn’t tell you everything about the state of the ice — according to the University of Washington’s PIOMAS ice model 2010 managed to set a new record low for sea ice volume.

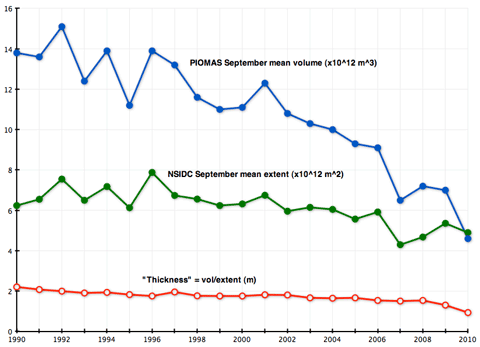
In terms of the future of the Arctic sea ice, the volume of ice remaining at minimum is a crucial metric because it represents the size of the heat budget buffer between an ocean with a perennial floating ice cap and one that’s seasonally ice-free. For the Arctic to be ice free in summer, that buffer has to disappear, or become a lot smaller. I’ve been writing about sea ice volume for some time, and considered the overall Arctic heat budget in this post a couple of years ago, so news of the new low volume prompted me to think about what it might mean for the extent metric over the next few years. To do that, I downloaded the NSIDC’s September monthly average extent for the last 21 years, and plotted that against the PIOMAS model’s September average monthly volume (kindly supplied by Jinlun Zhang). Here’s what the data looks like when you plot it on the same chart.

SeaIceData.png

The red line at the bottom, labelled “thickness”, is what you get when you divide volume by extent, and that too has been in decline, reflecting the fact that the loss of volume has been happening faster than the reductions in extent.

Continue reading “Five years (threnody for Arctic sea ice)”

Double dipping: It’s grim up north #3

AMSRESIE100919.gif

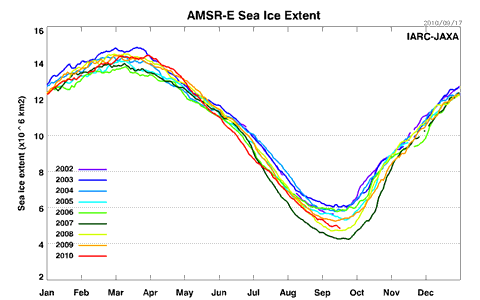
Earlier this week, the National Snow and Ice Data Center (NSIDC) announced that the Arctic sea ice had reached its summer minimum extent, based on a four day run of extent increases. And then, like the fat lady in an overwrought opera refusing to die, trilling her agony and ecstasy to an appreciative audience, ice extent started dropping again. It was, as I suggested it might be at Neven’s Arctic Sea Ice blog, a double dip minimum — and as of this morning the extent (IJIS-JAXA graph above, but the NSIDC’s shows the same thing) is still dropping down towards 2008 — which holds second place in the record behind 2007. I still think it’s unlikely that the 2010 melt will do enough to pass 2008, but there’s a lot of thin ice and warm water up there, as I noted last Monday, and it will be interesting to see how the PIOMAS numbers for ice volume turn out — a new record low is definitely on the cards.

Attention will now turn to the autumn freeze-up, and the potential for the heat released by ice formation to impact northern hemisphere weather patterns. I’ve been reading a few papers on that subject, and will post a discussion as autumn up North progresses.

On a different tack, the future of the Arctic is becoming a popular subject for books. Robin McKie reviewed a selection for the Observer earlier this year (and from that selection I plan to read Charles Emmerson’s Future History of the Arctic, mainly because it seems to have arrived in southern hemisphere bookshops recently), but the book getting the most attention at the moment is Laurence C Smith’s The World in 2050: Four Forces Shaping Civilization’s Northern Future, due out this week (Science Daily). Smith summarises his vision in an article for the Wall Street Journal:

I imagine the high Arctic, in particular, will be rather like Nevada—a landscape nearly empty but with fast-growing towns. Its prime socioeconomic role in the 21st century will not be homestead haven but economic engine, shoveling gas, oil, minerals and fish into the gaping global maw.

That assumes, of course, that the “gaping maw” still exists…