Global sea ice in uncharted territory

The big heat of 2016 is taking its toll on sea ice at both poles

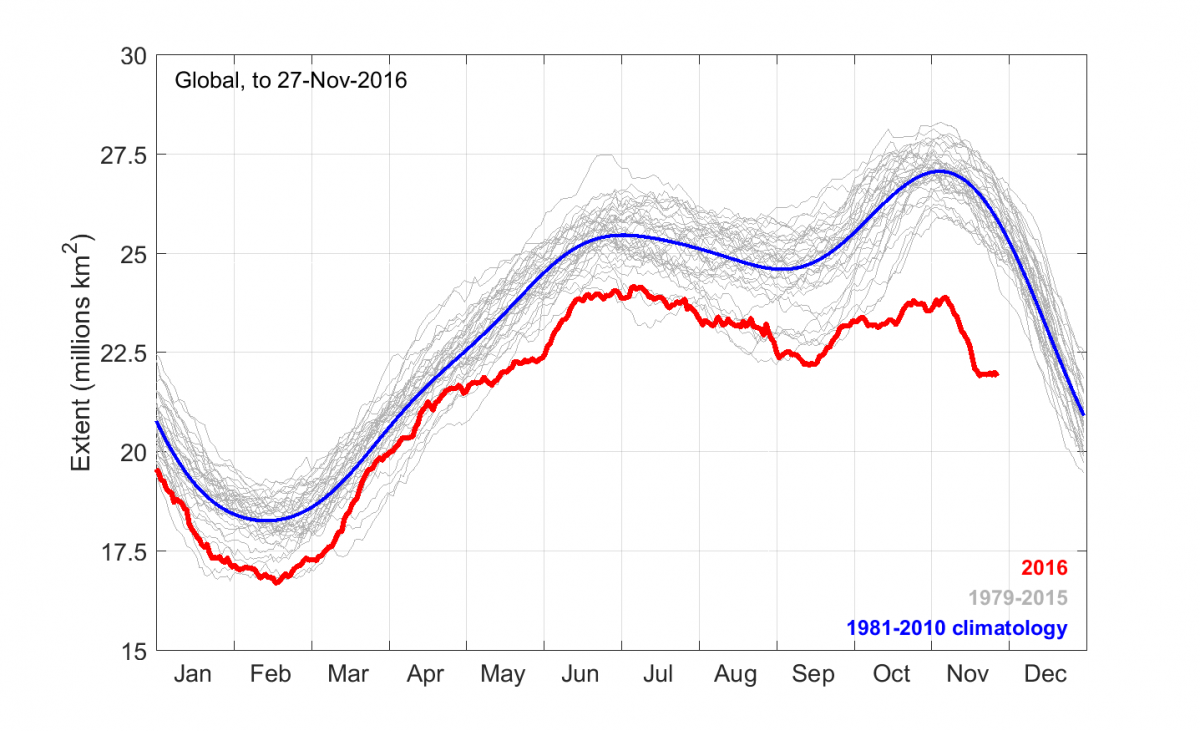
For the past couple of months, global sea ice extent (Arctic plus Antarctic) has been at record low levels. The way the northern and southern seasonal cycles add up, the maximum in global sea ice extent occurs on average in early November, at around 27 million km2. This year, the global extent curve has been relatively flat since June. In past years, climate change “deniers” have pointed to the global extent curve as a way of claiming that climate change is not a problem, as the relatively high Antarctic extent was partly offsetting the Arctic loss, making it look as though nothing much was changing. Strangely enough, we’ve heard nothing from the usual “deniers” this year! Through most of November, there has been around 4 million km2 less sea ice than normal globally (peaking at 4.5 million on 20 November), an area roughly the size of Greenland missing near each pole. What’s going on? Continue reading “Global sea ice in uncharted territory”

It’s grim up North (yet again)

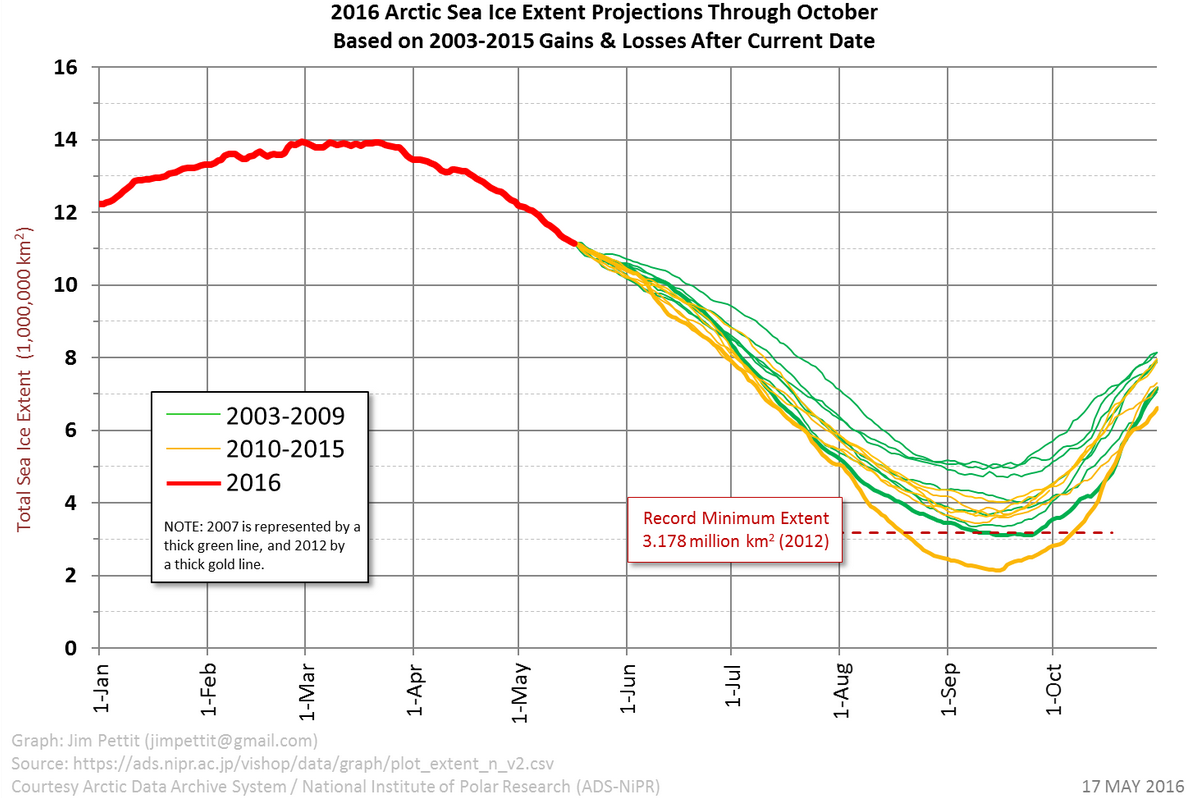
The Arctic has had a warm winter and spring, and the heat is taking a toll on the sea ice…

I find to my great shame that it’s three years since I last wrote much about the continuing and calamitous decline in Arctic sea ice. Back in the day, you could scarcely contain my enthusiasm for prognostications about the disappearance of the summer ice. But with the fantastic resource that is Neven’s Arctic Sea Ice blog covering the minutiae of every season, coverage from the other side of the world seems a little superfluous. On the other hand, the recent news is especially troubling… Continue reading “It’s grim up North (yet again)”

Fall in San Francisco: Jim Renwick’s AGU report

Jim RenwickI took part in the 2015 AGU Fall Meeting, held at the vast Moscone Center in San Francisco, 14-18 December. As always, it was an absolute cornucopia of everything to do with the Geo/Earth Sciences, from exoplanets to the earth’s core to climate change and science policy, delivered by over 20,000 geoscientists. The Fall Meeting is always a blast, a real mind-expander.

This year, I was committed to chairing sessions first thing on Monday morning and then again on Friday. Monday’s session was “Evaluating Reanalysis: What Can We Learn about Past Weather and Climate?” with my sub-session having a focus on polar regions. The Thu/Fri session was “Precipitation over Mountainous Terrain: Observations, Understanding, Modeling, and Future Prospects”. In between, I soaked up as much as I could, wandering the halls to hear and see fascinating presentations on climate history, science communication, sea ice, and designing climate change musicals for primary school children. Here’s a few highlights, my personal “tip of the iceberg” from this year’s meeting.
Continue reading “Fall in San Francisco: Jim Renwick’s AGU report”

Antarctic sea ice: The end of the trend?

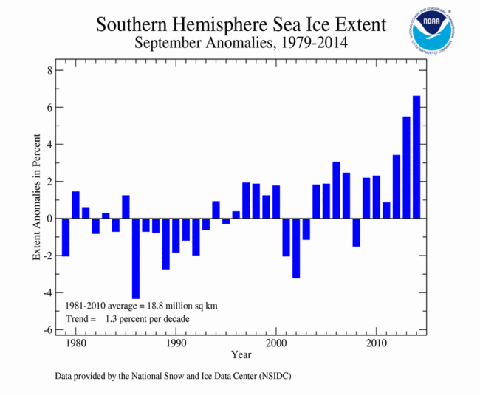
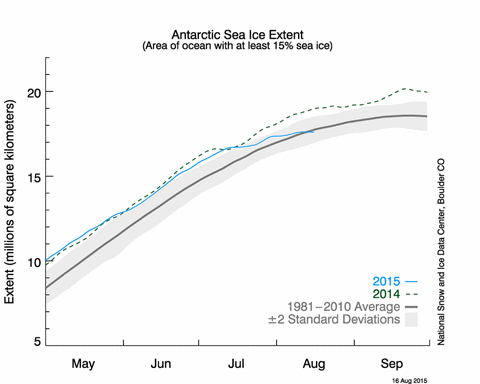
west antarctic sea iceUnusual things are happening to Antarctic sea ice extent. We are about a month away from the traditional time of maximum extent (around 20 September), and each year for the last six years, total sea ice extent around the Antarctic has been above normal. The last three years have been record-breaking, with 2014 seeing the 20 million square kilometre threshold exceeded for the first time since satellite records began in 1979 (Figure 1). But this year, sea ice growth stalled in early August and is currently going nowhere. For the first winter since 2008, total Antarctic sea ice extent is below normal (Figure 2).

ASIExtentanom201409 Figure 1: September Antarctic sea ice extent, percent difference from the 1981-2010 normal.

Antarcticseaice20150819 Figure 2: Antarctic sea ice extent in 2015 (blue line). The dashed line shows 2014 extent, the gray line the 1981-2010 average extent and the shading represents the two standard deviation spread about the average.

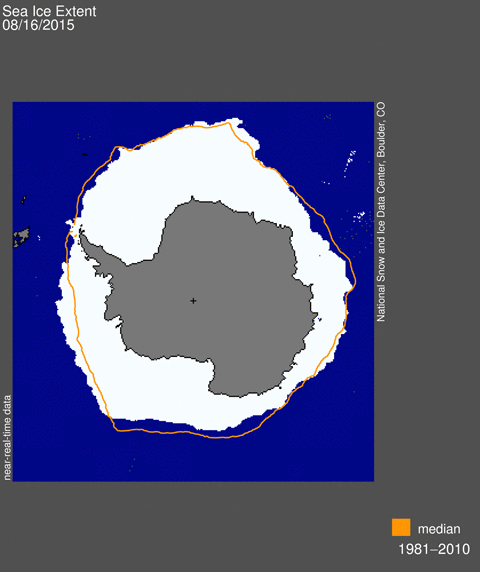
What’s more, the pattern of sea ice change this winter is the opposite of the trend pattern we’ve seen over the past few decades towards more ice around the Ross Sea and less ice near the Antarctic Peninsula ((Turner, J., J. C. Comiso, G. J. Marshall, T. A. Lachlan-Cope, T. Bracegirdle, T. Maksym, M. P. Meredith, Z. Wang, and A. Orr, 2009: Non-annular atmospheric circulation change induced by stratospheric ozone depletion and its role in the recent increase of Antarctic sea ice extent. Geophys. Res. Lett., 36, L08502, doi:08510.01029/02009GL037524.)). This year, near the Antarctic Peninsula, we have more ice than normal, and less than normal north of the Ross Sea and across parts of the Indian Ocean (Figure 3). A real turn-around.

ASI20150816extentmap Figure3: Antarctic sea ice coverage for 16 August 2015 (white). The thin solid line shows the 1981-2010 average sea ice edge for this date.

Continue reading “Antarctic sea ice: The end of the trend?”

A tale of two hemispheres

Jim RenwickAt the end of June, Professor Jim Renwick of Victoria University gave his inaugural lecture. As you might expect of a climate scientist, it concerns what we know about the climate system and where we’re heading. He pulls no punches. Jim has been kind enough to put together a text version of the lecture for Hot Topic: it follows. You can watch the full lecture, with accompanying slides, on the video embedded at the end of the post.

We live in a golden age of earth observation. With a few clicks of a mouse on a web browser, any of us can see the state of the global ocean surface, the current condition of the Greenland ice sheet, how much rain is falling in the tropics today, and on and on. Plus, the International Space Station (ISS), and a series of satellites such as MODIS give us wonderful images of our home planet. The climate science community can tell, with unprecedented coverage and timeliness, just what is going on in the climate system. It is a great time to be a climate researcher, but also a worrying time, in both cases because we can see exactly what is changing.

One thing the ISS pictures emphasise is just how thin the atmosphere is, a thin blue layer between the solid earth and the blackness of space. Not only is this life-supporting envelope very thin, some of the key gases in the atmosphere are there in only trace amounts, so we can change the properties of the atmosphere easily, by targeting the right gases. The discovery of the ozone hole 30 years ago brought this home with a bang. And we’ve found that build-up of carbon dioxide (CO2) in the atmosphere can have a profound effect on the climate system, right down to the bottom of the oceans.

Carbon dioxide is important because it’s a crucial control on the surface temperature of the earth. It is very good at absorbing heat (infrared radiation) welling up from the earth, then re-radiating both up and down, in the process warming the earth’s surface. The effect is very like a blanket put on a bed – what’s under the blanket warms up. More CO2 is like putting another blanket on the bed and less is like taking away a blanket. No CO2 and the earth freezes – temperatures like we had in the South Island in late June would be the norm everywhere, all the time. While there are several other “greenhouse gases”, carbon dioxide is the most important since it stays in the atmosphere so long, hundreds to thousands of years.
Continue reading “A tale of two hemispheres”