The final cut: crank paper on NZ temperature record gets its rebuttal – warming continues unabated

At last: the curtain falls on the final act in the case of NIWA versus the NZ climate cranks. de Freitas et al (2015) – which purported to show warming in NZ was much lower than previously calculated – is shown to be comprehensively wrong in a new paper by NZ’s top temp experts.

Way back in the spring of 2014, NZ’s little band of climate cranks somehow managed to get a paper published based on their recalculation of New Zealand’s long term temperature record ((A Reanalysis of Long-Term Surface Air Temperature Trends in New Zealand by CR de Freitas & MO Dedekind & BE Brill (DOI 10.1007/s10666-014-9429-z) )). The effort – based on calculations done to support their infamous court case against the National Institute of Water and Atmospheric Research (NIWA), which they emphatically lost – purported to show that New Zealand’s long term warming rate was only a third of the amount previously calculated. As I pointed out at the time, it was riddled with errors and bad scholarship, but it appeared in the peer-reviewed literature ((The lead author, Chris de Freitas (who died last year), had a notable track record of helping rubbish through peer review.)), and so required a peer-reviewed rebuttal.

It’s taken a while, but in the last few days Comment on “A Reanalysis of Long-Term Surface Air Temperature Trends in New Zealand” has been published in Environmental Modelling and Assessment ((Comment on “A Reanalysis of Long-Term Surface Air Temperature Trends in New Zealand”,Mullan, B., Salinger, J., Renwick, J. et al. Environ Model Assess (2018). https://doi.org/10.1007/s10666-018-9606-6)). Led by NIWA principal climate scientist Brett Mullan, the authors are Jim Salinger, who first established the NZ long term temperature record ((Jim is currently a visiting professor at the Department of Geography and Environmental Studies, University of Haifa, Mt Carmel, Israel.)), Professor Jim Renwick from VUW, and David Wratt, now Emeritus Scientist (Climate), at NIWA, and an Adjunct Professor in the New Zealand Climate Change Research Institute at VUW. You could fairly describe them as experts – and their “comment” might better be called a demolition.

Here’s their conclusion:

In this paper, we identify what we consider to be several methodological flaws in the [de Freitas et al] paper. We conclude that, as a consequence, the temperature trend of an increase of 0.28 °C per century for the period 1909–2009 for New Zealand land surface temperatures derived in the dFDB paper is substantially too low, and that no need has been established for significant downward revision of the trend of around 0.9 °C per century found in previous studies.

They then provide a handy summary of the main flaws – which I’ve paraphrased below:

  • dFDB claimed their paper was the first to properly use a methodology developed by Jim Salinger and Rhoades, first published in 1993. It wasn’t – in two senses. It wasn’t the first, and they didn’t use it properly.
  • dFDB claimed NIWA’s long term temp record was based on calculations from Jim Salinger’s PhD thesis. It wasn’t.
  • dFDB’s interpretation of the Rhoades and Salinger technique was mistaken and flawed, using station overlaps that were too short and ignoring changes in maximum and minimum temperatures. The result was that they failed to make many adjustments that were required, and therefore underestimated the actual warming.
  • dFDB made a few arithmetical errors, dealt with missing data incorrectly, and mishandled trends in the Auckland and Wellington series.
  • dFDB ignored other lines of evidence that support warming of 0.7-1.0°C per century, such as temperature series derived by the Berkeley Earth project, the decline in NZ’s glaciers, and analyses of sea surface temperatures around NZ.

The full paper is well worth a read if you followed the arguments at the time of dFDB’s original publication. It’s an elegant and polite deconstruction of a shoddy, politically motivated piece of work that should never have passed peer review first time round. It should make uncomfortable reading for the remaining authors of dFDB (2015) and their promoters, if they were real scientists rather than propagandists. But they’re not.

[Pink Floyd]

Guy McPherson and the end of humanity (not)

Is climate change going to wipe out humanity over the next 10 years? Prof Jim Renwick doesn’t think so…

Ecologist Guy McPherson has been touring New Zealand for the past couple of weeks, explaining why humanity has only 10 years to live (a kind-of Ziggy message that has immediate appeal to me). After his appearance on the Paul Henry breakfast show, I was called by TV3/Newshub for comment. Based on my understanding of climate change science I said that though the situation is very serious — dire even — extinction in 10 years is not going to happen. When I gave my remarks to Newshub, I knew little about McPherson but I understood that he is a very knowledgeable biologist who should not be dismissed lightly.

So, what’s the story? Is McPherson right? Is the IPCC woefully conservative and keeping the truth from us all? I had the opportunity to hear Prof McPherson speak in Paraparaumu on Saturday (Dec 10th) to get more insight into what his views really are. It was a very interesting presentation, and a very interesting discussion with the audience of 50-odd Kāpiti coasters who showed up to hear him. As the old saying goes, extraordinary claims require extraordinary evidence. What we heard was extraordinary for sure, but was not too convincing in terms of evidence.

Continue reading “Guy McPherson and the end of humanity (not)”

Antarctic sea ice: The end of the trend?

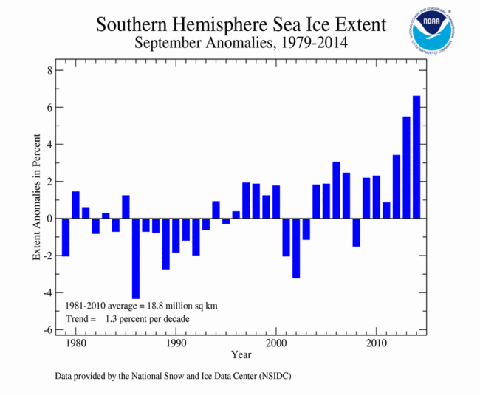
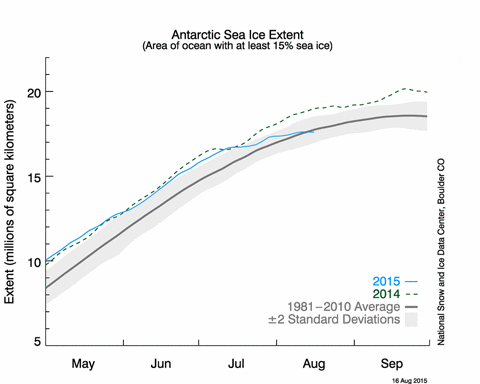
west antarctic sea iceUnusual things are happening to Antarctic sea ice extent. We are about a month away from the traditional time of maximum extent (around 20 September), and each year for the last six years, total sea ice extent around the Antarctic has been above normal. The last three years have been record-breaking, with 2014 seeing the 20 million square kilometre threshold exceeded for the first time since satellite records began in 1979 (Figure 1). But this year, sea ice growth stalled in early August and is currently going nowhere. For the first winter since 2008, total Antarctic sea ice extent is below normal (Figure 2).

ASIExtentanom201409 Figure 1: September Antarctic sea ice extent, percent difference from the 1981-2010 normal.

Antarcticseaice20150819 Figure 2: Antarctic sea ice extent in 2015 (blue line). The dashed line shows 2014 extent, the gray line the 1981-2010 average extent and the shading represents the two standard deviation spread about the average.

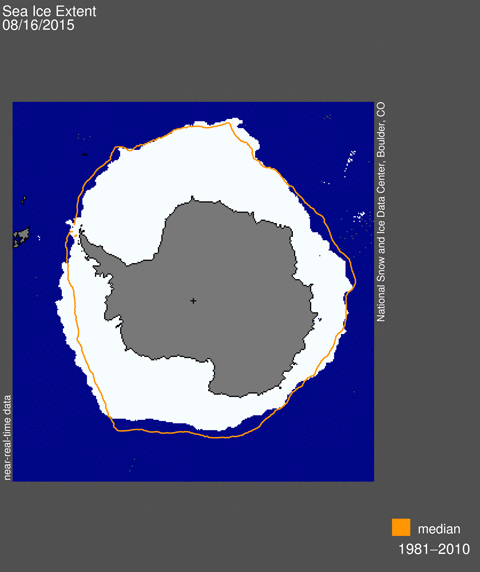
What’s more, the pattern of sea ice change this winter is the opposite of the trend pattern we’ve seen over the past few decades towards more ice around the Ross Sea and less ice near the Antarctic Peninsula ((Turner, J., J. C. Comiso, G. J. Marshall, T. A. Lachlan-Cope, T. Bracegirdle, T. Maksym, M. P. Meredith, Z. Wang, and A. Orr, 2009: Non-annular atmospheric circulation change induced by stratospheric ozone depletion and its role in the recent increase of Antarctic sea ice extent. Geophys. Res. Lett., 36, L08502, doi:08510.01029/02009GL037524.)). This year, near the Antarctic Peninsula, we have more ice than normal, and less than normal north of the Ross Sea and across parts of the Indian Ocean (Figure 3). A real turn-around.

ASI20150816extentmap Figure3: Antarctic sea ice coverage for 16 August 2015 (white). The thin solid line shows the 1981-2010 average sea ice edge for this date.

Continue reading “Antarctic sea ice: The end of the trend?”

A tale of two hemispheres

Jim RenwickAt the end of June, Professor Jim Renwick of Victoria University gave his inaugural lecture. As you might expect of a climate scientist, it concerns what we know about the climate system and where we’re heading. He pulls no punches. Jim has been kind enough to put together a text version of the lecture for Hot Topic: it follows. You can watch the full lecture, with accompanying slides, on the video embedded at the end of the post.

We live in a golden age of earth observation. With a few clicks of a mouse on a web browser, any of us can see the state of the global ocean surface, the current condition of the Greenland ice sheet, how much rain is falling in the tropics today, and on and on. Plus, the International Space Station (ISS), and a series of satellites such as MODIS give us wonderful images of our home planet. The climate science community can tell, with unprecedented coverage and timeliness, just what is going on in the climate system. It is a great time to be a climate researcher, but also a worrying time, in both cases because we can see exactly what is changing.

One thing the ISS pictures emphasise is just how thin the atmosphere is, a thin blue layer between the solid earth and the blackness of space. Not only is this life-supporting envelope very thin, some of the key gases in the atmosphere are there in only trace amounts, so we can change the properties of the atmosphere easily, by targeting the right gases. The discovery of the ozone hole 30 years ago brought this home with a bang. And we’ve found that build-up of carbon dioxide (CO2) in the atmosphere can have a profound effect on the climate system, right down to the bottom of the oceans.

Carbon dioxide is important because it’s a crucial control on the surface temperature of the earth. It is very good at absorbing heat (infrared radiation) welling up from the earth, then re-radiating both up and down, in the process warming the earth’s surface. The effect is very like a blanket put on a bed – what’s under the blanket warms up. More CO2 is like putting another blanket on the bed and less is like taking away a blanket. No CO2 and the earth freezes – temperatures like we had in the South Island in late June would be the norm everywhere, all the time. While there are several other “greenhouse gases”, carbon dioxide is the most important since it stays in the atmosphere so long, hundreds to thousands of years.
Continue reading “A tale of two hemispheres”

Renwick on NZ’s 11% cut: follow us down the path to catastrophe

RenwickThis guest post is by Carbon News editor Adelia Hallett, published with permission.

New Zealand will face droughts, floods, fires, social upheaval and catastrophic global economic damage if the world follows the country’s lead on cutting greenhouse gas emissions, says one of our leading climate experts. Dr James Renwick – Professor of Physical Geography at Victoria University, an International Panel on Climate Change lead author, and formerly a principal scientist at the National Institute on Water and Atmosphere – says that cutting emissions at the rate that New Zealand proposes would lead to at least 3 degrees of warming by the end of the century.

That’s warmer than at any time in the history of human agriculture and settlement, which started around 10,000 years ago.

The Government announced on Tuesday that New Zealand would go to international climate change negotiations in Paris later this year with a post-2020 emissions reduction target (known as an Intended Nationally Determined Commitment, or INDC) of 30 per cent below 2005 levels by 2030. That’s the same as 11.2 per cent below 1990 levels. New Zealand also has a target of halving emissions on 1990 levels by 2050.
Continue reading “Renwick on NZ’s 11% cut: follow us down the path to catastrophe”