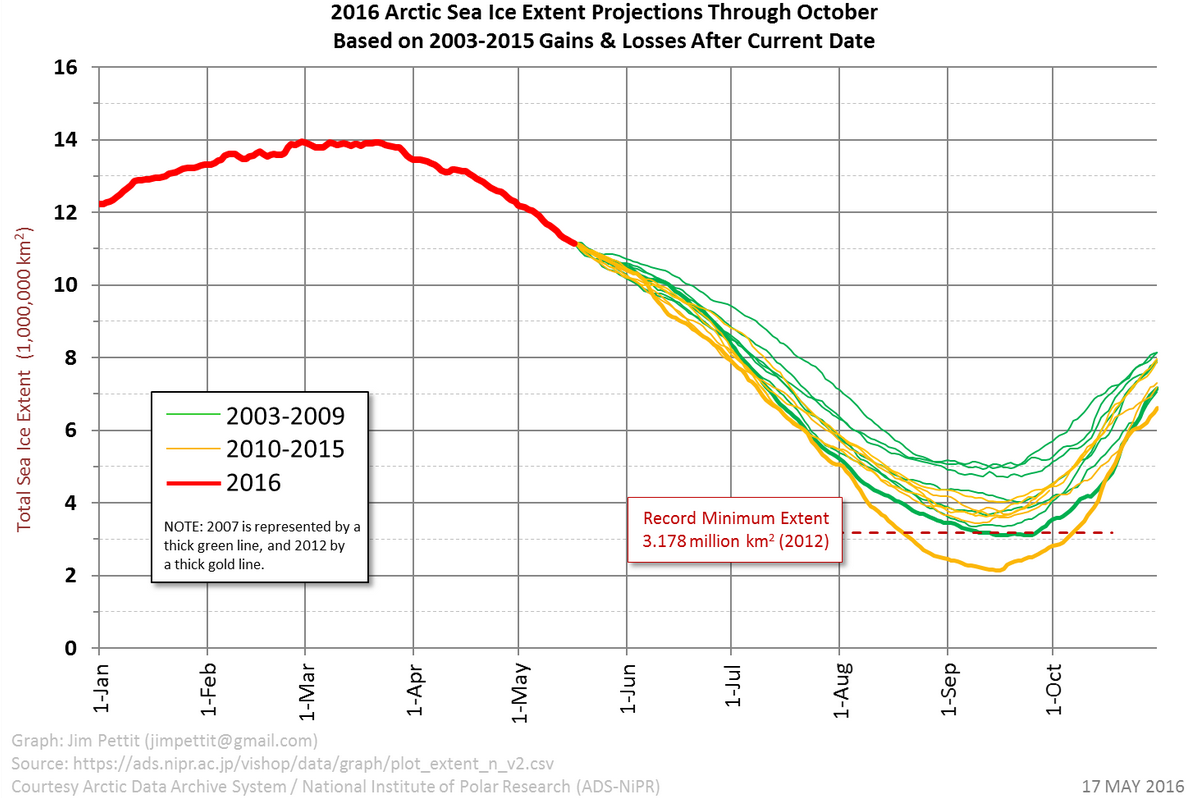
I find to my great shame that it’s three years since I last wrote much about the continuing and calamitous decline in Arctic sea ice. Back in the day, you could scarcely contain my enthusiasm for prognostications about the disappearance of the summer ice. But with the fantastic resource that is Neven’s Arctic Sea Ice blog covering the minutiae of every season, coverage from the other side of the world seems a little superfluous. On the other hand, the recent news is especially troubling…
The Arctic has been ridiculously warm this last northern hemisphere winter. The sea ice maximum in March was the smallest in the record (by a small margin). April was another warm month in the far North — especially over Greenland — and May is continuing the warm streak. The sea ice is showing the effects of prolonged unusual heat, as Tamino noted a few days ago at Open Mind.
Any way you look at it, Arctic sea ice during May has fallen far below previous May values.
My first reaction was to go looking at graphs — Neven has a comprehensive selection here — and in particular at the “plume” sea ice graph created and maintained by Jim Pettit. You can see it at the top of this post. It’s a very clever device: it shows what would happen if the melt trajectories of recent years started at the current value. I suspected it would tell me something. After all, others were worried.
When I first looked a couple of days ago, the graph hadn’t been updated since the beginning of the month, and didn’t reflect the impact of the “nosedive” detected by Tamino. A swift email to Jim, and — the news isn’t good. If the rest of the melt season is as bad as 2012, the last record setting year, then we are on course for a new record by over a million square kilometres. Worse, even “ordinary” melt trajectories — ones that didn’t set records — are beginning to toy with the 2012 record minimum.
May is not a great time to be predicting Arctic sea ice minima — there’s a long way to go to September, and a lot of weather to happen — but this year is certainly off to a flying start. Despite El Niño passing its peak and a La Niña on the way, this year is all but certain to set a new record for global temperature. That heat is going somewhere, and it’s going north. When the world warms, the Arctic burns.
Back in 2010 I wrote a couple of posts looking at what declines in sea ice volume and sea ice extent might mean for the Arctic. In the first I suggested that the summer sea ice minimum might fall below one million km2 somewhere between 2016 and 2020. In the second, I mooted the possibility that it might be ice-free in winter by the 2040s. I hope I was wrong about both, but this year may be about to disappoint me.
My thanks to Jim for updating his plume graph, and confirming my fears.
[Justified Ancients of Mu Mu — Cleethorpes!]


I wonder how close it is to a tipping point – the declining trend line suggests feedbacks are happening.
Even if the curve does get to zero it won’t be completely ice free of course, and I am sure that will be pointed out by climate change dissenters. I think the curve is based on 15% or more ice cover. And an “ice free” summer may recover again during cooler years. But it will still be a significant milestone.
1m km2 is usually taken as the threshold of substantially ice-free summers. We are unlikely to get there this year, but I don’t think it will be long…
… heading for September zero…
http://psc.apl.uw.edu/wordpress/wp-content/uploads/schweiger/ice_volume/BPIOMASIceVolumeAprSepCurrent.png
The sea ice volume chart leaves little doubt about the time when the summer ice will be gone entirely.