
This is a guest post by the statistician who blogs as Tamino, cross-posted from his Open Mind blog with his permission. It’s important reading…
A recent blog post on RealClimate by Stefan Rahmstorf shows that when it comes to recent claims of a “pause” or “hiatus,” or even a slowdown in global surface temperature, there just isn’t any reliable evidence to back up those claims.
Yet for years one of the favourite claims of those who deny the danger of global warming has been “No global warming since [insert start time here] !!!” They base the statement on the observed data of earth’s surface temperature or its atmospheric temperature. Then they claim that such a “pause” or “hiatus” in temperature increase disproves, in one fell swoop, everything about man-made climate change.
They seem a bit worried lately because it is very likely that the data from NOAA (National Oceanic and Atmospheric Administration) will record this year as the hottest on record; we won’t know, of course, until 2014 is complete. A single year, even if the hottest on record, has only a little to do with the validity of such claims, but a lot to do with how hard it is to sell the idea. Perhaps they dread the prospect that if the most recent year is the hottest on record — in any data set — it will put a damper on their claims of a “pause” in global warming. If they can’t claim that any more, it deprives them of one of their most persuasive talking points (whether true or not). Still the claims persist; they’ve even begun preparing to ward off genuine skepticism spurred by the hottest year on record.
I seem to be one of very few who has said all along, repeatedly and consistently, that I’m not convinced there has been what is sometimes called a “pause” or “hiatus,” or even a slowdown in the warming trend of global temperature — let alone in global warming.
And it’s the trend that’s the real issue, not the fluctuations which happen all the time. After all, if you noticed one chilly spring day that all that week it had been colder than the previous week, you wouldn’t announce “No more summer on the way! No more seasons since [insert start time here]!!!” You’d know that in spite of such short-term fluctuations, the trend (the march of the seasons) will continue unabated. You wouldn’t even consider believing it had stopped without some strong evidence. You certainly wouldn’t believe it based on weak evidence, and if the evidence is far too weak …
Why am I not convinced? Because the evidence for claims of a “pause” or “hiatus” or even slowdown is weak. Far too weak.
Let me show you just how weak their case is.
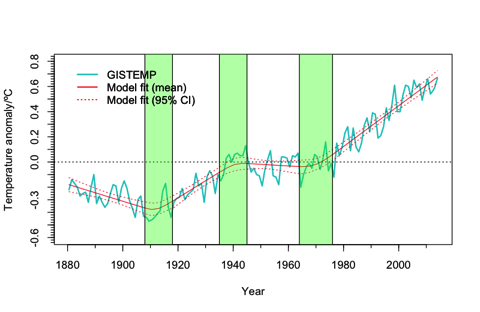
Rahmstorf’s post is based on a mathematical technique known as “change point analysis” (with the kind assistance of Niamh Cahill, School of Mathematical Sciences, University College Dublin) applied to data from GISS (NASA’s Goddard Institute for Space Studies). The result is that the most recent change point (the most recent change in the trend) which is supported by the data happened back in 1970, nearly 45 years ago. As for a change in the trend more recently than that (which is the basis of claims about a “pause”), there’s just no evidence that passes muster.
Of course, the data from GISS isn’t the only well-known data for global surface temperature; there’s also the aforementioned NOAA data, the HadCRUT4 data (from the Hadley Centre/Climate Research Unit in the U.K.), the data from Cowtan & Way (an improved — in my opinion — version of the HadCRUT4 data), the CRUTEM4 data which cover only earth’s land areas (also from the the Hadley Centre/Climate Research Unit), and the land-only Berkeley data (from the Berkeley Earth Surface Temperature project). There’s also data covering, not earth’s surface but its lower atmosphere (often called “TLT” for “temperature lower-troposphere), one from UAH (University of Alabama at Huntsville), another from RSS (Remote Sensing Systems).
With so many data sets to choose from, sometimes those who deny the danger of global warming but don’t like the result they get from one data set will just use another instead, whichever gives the result they want. Then again, some of them might accuse Rahmstorf, in his blog post, of choosing the NASA GISS data because it was most favourable to his case; I don’t believe that’s true, not at all. We can forestall such criticism by determining the result one gets from different choices and compare them. In fact, it’s worth doing for its own sake.
Let me state the issue I intend to address: whether or not there has even been any verifiable change in the rate of temperature increase — and remember, we’re not talking about the up-and-down fluctuations which happen all the time, and are due to natural factors (they’re also well worth studying), we’re talking about the trend. If there’s no recent change in the trend, then there certainly isn’t a “pause” or “hiatus” in global warming. I’ll also apply a different technique than used in Rahmstorf’s post.
First a few notes. Those not interested in technical details, just skip this and the next paragraphs. For those interested, I’ll mention that to estimate the uncertainty of trend analysis we need to take into account that the noise (the fluctuations) isn’t the simple kind referred to as white noise, rather it shows strong autocorrelation. I’ll also take into account that the noise doesn’t even follow the simplest form of autocorrelation usually applied, what’s called “AR(1)” noise, but it can be well approximated by a somewhat more complex form referred to as “ARMA(1,1)” noise using the method of Foster & Rahmstorf. This will enable me to get realistic estimates of statistical uncertainty levels.
I’ll also address the proper way to frame the question in the context of statistical hypothesis testing. The question is: has the warming rate changed since about 1970 when it took on its rapid value? Hence the proper null hypothesis is: the warming rate (the trend, not the fluctuations) is the same after our choice of start year as it was before (basically, since 1970). Only if we can contradict that null hypothesis can we say there’s valid evidence of a slowdown.
Spoiler alert: there’s no chance whatever of finding a “slowdown” that starts before 1990 or after 2008. Therefore for all possible “start of trend change” years from 1990 through 2008, I computed the best-fit statistical model that includes a change in trend starting at that time. I then tested whether or not the trend change in that model was “statistically significant.” To do so, we compute what’s called a p-value. To be called “significant” the p-value has to be quite small — less than 0.05 (i.e. less than 5%); if so, such a result is confirmed with what’s called “95% confidence” (which is 100% minus our p-value of 5%). Requiring 95% confidence is the de facto standard in statistics, not the universal choice but the most common and certainly a level which no statistian would find fault with. This approach is really very standard fare in statistical hypothesis testing.
So here’s the test: see whether or not we can find any start year from 1990 through 2008 for which the p-value is less than 0.05 (to meet the statistical standard of evidence). If we can’t find any such start year, then we conclude that the evidence for a trend change just isn’t there. It doesn’t prove that there hasn’t been any change, but it does lay bare the falsehood of proclamations that there definitely has been.
I’ll also avoid criticisms of using some data set chosen because of the result it gives, by applying the test to every one of the aforementioned data sets, four for global surface temperature, two for land-only surface temperature, and two for atmospheric temperature.
I can graph the results with dots connected by lines showing the p-values for each choice of start year, with the results from different data sets shown in different colours. The p-values are plotted from highest (no significance at all) at the bottom to lowest (statistically significant) at the top, with a dashed line near the top showing the 5% level; at least one of the dots for at least one of the data sets has to rise above the dashed line (dip below 5%) to meet the “Statistical Significance for Trend Change” region in order to claim any valid evidence of that (think of it as “You must be this tall to go on this ride”). Have a look:

In no case does the p-value for any choice of start year, for any choice of data set, reach the “statistically significant” range. Therefore, for no choice of start year, for no choice of data set, can you make a valid claim to have demonstrated a slowdown in warming. As a matter of fact, in no case does the p-value for any choice of start year, for any choice of data set, get as low as the 10% level. To put it another way, there’s just no valid evidence of a “slowdown” which will stand up to statistical rigor.
Bottom line: not only is there a lack of valid evidence of a slowdown, it’s not even close.
But wait … there’s more! Imagine you roll a pair of dice and get a 12 in some game where that’s the only losing roll. You might suspect that the dice are loaded, because if the dice were fair then the chance of rolling a 12 is only 1 out of 36, or 2.8% (hence the “p-value” is 2.8%). You can’t prove the dice are loaded, but at least you’ve got some evidence.
Now suppose you roll the dice 20 times, and at least once you got a 12. Do you now have evidence the dice are loaded? Of course not. You see, you didn’t just roll once so that the p-value is 2.8%, instead you gave yourself 20 chances to get a 12, and the chance of rolling a 12 if you get to try 20 times is much much higher than the chance of rolling a 12 if you only get to try once. In fact the chance is 43%, so the p-value for all the rolls combined is 43%. That’s way way way higher than 5%. Not only do you have no valid evidence based on that, it’s not even close.
In the above tests, we didn’t just test whether there was valid evidence of a trend change for a single start year. We did it for every possible start year from 1990 through 2008, 19 choices in all. That means that the actual p-value is much higher than the lowest individual p-value we found — it’s just too easy to get results that look “significant” when you don’t take into account that you gave yourself many chances. The conclusion is that not only is there a lack of valid evidence of a change in trend, it’s nowhere near even remotely being close. Taking that “you gave yourself multiple chances” into account is, in fact, one of the strengths of change point analysis.
I repeat: not only is there a lack of valid evidence of a slowdown, it’s nowhere near even remotely being close. And that goes for each and every one of the 8 data sets tested.
A hottest-on-record for 2014 will dampen the enthusiasm of those who rely on “No global warming since [insert start time here] !!!” Yet, in my opinion, this never was a real issue because there never was valid evidence, even of a slowdown, let alone a “pause” or “hiatus.”
Based on the best estimate of the present trend, using the data from NASA GISS (as used in Rahmstorf’s post), this is what we can expect to see in upcoming years:
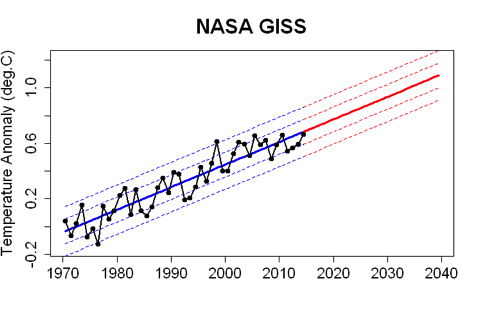
Of course there will still be fluctuations, as there always have been. But if future temperature follows the path which really is indicated by correct statistical analysis, then yes, Earth’s temperature is about to soar.
Does the data prove there’s been no slowdown? Of course not, that’s simply impossible to do. But the actual evidence, when subjected to rigorous statistical analysis, doesn’t pass muster. Not even close. Those who insist there definitely has been a “pause” or “hiatus” in temperature increase (which seems to include all of those who deny the danger from man-made climate change) either don’t really know what they’re doing, or — far worse — they do know what they’re doing but persist in making claims despite utter lack of evidence.
I will predict, however, with extreme confidence, that in spite of the lack of valid evidence of any change in the trend, and even if we face rapid and extreme warming in the near future, there’ll be no “pause” or even slowdown in faulty claims about it from the usual suspects.
Superb post that skewers the mythical “pause”. Tamino (Grant Foster) has a knack for explaining statistics simply. His text “Understanding Statistics: Basic Theory and Practice” is very good.
+1. An excellent text. Grant Foster has made a big difference to my stats education.
I predict *crickets* from the Denialiati regulars on this one! It’s notable that none have been game to take this up directly over at Tamino’s. The comments are well worth reading, if only for the cruel – and well deserved – excoriation of the ‘no warming since XX’ argument.
Yup, that’s the usual response. I made the same argument to Leyland and andy a couple of weeks ago, and they changed the subject pretty quickly.
On the face of it, this article gives prima facie evidence that Leyland lied in his TVNZ interview. Leyland’s only possible defence is that he is so ignorant of climate science that he had no idea that this was the case. It would be interesting to hear him pursue that defence 🙂
Please provide the link where you made the same claim and I changed the subject
Ah, andy’s popped up to play ‘he said / she said’ – a game he likes – but, given his previously stated mathematical chops, surely he’s a prime candidate for providing a substantive argument against Tamino?
I don’t pretend to understand change point analysis on autoregressive time series so I desist on commenting on the substance on the post. I do however feel it is reasonable to enquire when I made any claims in the past
No, I won’t.
No, you won’t what?
I won’t provide a link so that you can derail yet another post by nitpicking over whether you actually changed the subject or some other inconsequential detail.
What is your response to the article above? Do you still claim that there has been no warming since 1998? If so, what is the statistical basis for your claim?
As I have said, I am not in a position to provide any explanation of the stats in the article, except to say that it sounds very similar to the arguments that Doug Keenan used to claim that there has been no statistically significant warming in the 20th century (using the time series and dice rolling arguments)
As for “derailing” discussions, I have yet to see any discussions other than accusations of lying and the usual fluff about “deniers”
Given that there are over 50 explanations for the pause/hiatus/slowdown/whatever, made by climate scientists (including this one, that the “pause” doesn’t exist), maybe you should write to all the climate scientists who have explained the “pause” (e.g as stadium waves, ocean heating, aerosols, natural variability) and explain why they are wrong too.
No one is disputing that there has been a slowdown in the rate of warming, and there are indeed many possible explanations for why this might have happened.
However, what I am talking about is the many, many times that you have made a specific and definitive statement that there has been “no warming” over the last 15-17 years. Do you now recant those statements, or are you still insisting that there has been “no warming”?
andyS once again show us he is living in a make believe world:
Then lists only 3. Are you lying when you claim 50? To show us you are not lying then you must provide a list of at least 47. If you don’t provide a list of 47 we will call you “andy-the-liar-S”.
Pulling numbers out of your own or another AGW denier’s backside is not part of the scientific method.
Ian Forrester.
Then lists only three
See the meaning of the phrase “for example”.
I can list all 50+ reasons cited for the pause that doesn’t exist if you prefer
If it’s the list Watt’s pulled out of his backside or a list from some other AGW denier’s backside I don’t want to see it. What I would like to see is a list of 50 peer reviewed papers (all different reasons) for the pause (which doesn’t exist).
Should be fun reading.
Ian Forrester
I have no intention of finding these references that you already know about.
Why don’t you look them up yourself?
I don’t have to look for them since I know they don”t exist. The 50 or so you happily regurgitate are from Wattsuphisbutt and is just more denier lies. There are a couple more than your 3 on his list that are real but the vast majority are nonsense or repeat, repeat and repeat again of a well understood reason for the slight slowing down of the rate of temperature rise. Note, average global temperature is still rising.
but the vast majority are nonsense or repeat, repeat and repeat again of a well understood reason for the slight slowing down of the rate of temperature rise.
“A well understood reason”
Oh please elucidate to the uninformed masses what this is, please Mr F
Actually the first graph DOES show a hiatus, starting in the 40’s but it finished around 1970 and we’ve been rising steadily for the last 40 years. Related to all the extra smoke and vapour trails of WW2 perhaps?
The deniers are not going to like being corrected on the timing of the claims of a hiatus, but I doubt that they would listen anyway. They’re being paid to make lots of noise & confusion.
How many of the 50+ explanations DO in fact contribute to the apparent hiastus, Andy? The climate is an intensely complex beast and it’s more than likely that all of them play some role, large & small, sometimes positive, sometimes negative, sometimes both at the same time in different places.
In the mean time keep an eye on the BIG PICTURE and the interplay between the background physics and the observed changes.
The claim about the pause is not about science its about mis-information. There is only one way to stop the world over heating and that is to stop burning oil and coal and here we have a problem. These companies have vast amounts of money and they do not want to close down their businesses. The USA in particular is wedded to coal and oil and they also control much of the worlds media. They also have a dysfunctional and (we would say) corrupt government,This combination makes a very powerful machine and they are quite happy to continuing making money even though they know that they are destroying the world.
The claim about the pause is not about science its about mis-information. There is only one way to stop the world over heating and that is to stop burning oil and coal and here we have a problem. These companies have vast amounts of money and they do not want to close down their businesses. The USA in particular is wedded to coal and oil and they also control much of the worlds media. They also have a dysfunctional and (we would say) corrupt government,This combination makes a very powerful machine and they are quite happy to continuing making money even though they know that they are destroying the world.
Once more andy plays epistemological games, whilst ignoring the actual science. I will repeat the question you seem unwilling to answer:
Do you still claim that there has been no warming since 1998? If so, what is the statistical basis for your claim?
Do you still claim that there has been no warming since 1998…
are you still beating your wife CTG?
Since you seem unable or unwilling to find the links where I made this claim, I will take it as a no
Actually there has been a very small amount of warming since 1998, within the error margins of the equipment, as you know.
Apparently, this is not relevant
But I am supposed to “repent” in front of the climate inquisition, apparently
So you are not the andyS who said:
Okay, I stand corrected. You have never, ever claimed that there has been no warming over the last 18 years, in fact you have been shouting from the rooftops that warming continues unabated, and you suffer a torrent of unwarranted abuse because you are just trying to get people to see sense.
Congratulations CTG, you win Teh Interwebz
You are in fact correct that catastrophic global warming is real, it is happening now, and we are all going to die
Everybody agrees, the 0.05degC += .06 degC of warming over the last 15 years is the biggest crisis facing humanity.
By the way, I am still waiting to hear from Ian Forrester for the “obvious” explanation why the “pause that doesn’t exist” is occurring
Such difficulties I have CTG, like the Godel incompleteness theorem and the Russull Paradox
How do we explain the obvious solution to the problem that doens’t exist?
Can you explain it?
Well, this is progress; usually, when caught in a lie, Andy goes quiet for a time, then returms to apply his Koch-funded obfuscations to another topic entirely.
Good on you for sticking with us this time, Andy; truly, you are a profile in courage, and an inspiration to spin merchants everywhere.
Since you lie and twist what people say why should I even waste my time to explain such obvious things that I am sure you are aware of but just want to obfuscate and lie about. Do your clients like how you are shown to be so dishonest? I would certainly not pay anyone for information supplied by a well know liar.
Do you spend your entire life referring to people as liars?
By anyone’s reasonable judgement, the surface temps haven’t changed in the last 16 years or so, and I am not “lying” when I say so, even if someone has conjured up an obscure statistical technique to claim otherwise.
I only spend time outing those who actually lie. With you it is very easy so I don’t have to spend much time doing it. You just continued your lies about temperature in your latest comment. See how easy it is to show you up as a liar?
If you didn’t claim to have a degree in maths we might confuse your lying with ignorance and incompetence but someone who has a degree in maths should know about statistics and not lie about it.
Which parts of what I said do you consider to be a lie?
By the way, as I said up thread, stats is not an area of expertise for me, so I desist from commenting on the technicalities of the subject.
Change point analysis is based on linear regression. That’s an obscure statistical technique? Who knew?
Nobody disputes that the rate of warming of the last few years is lower than the long term trend, and the scientific discussion of the “hiatus” relate to what may have caused that slowdown.
However, it is clear that there is simply no way that you can claim that the trend over the last x years is equal to zero, as you are claiming. It is just not statistically valid to say that, as we have explained to you over and over and over and over and over.
And yet here you are, claiming the statistically impossible.
Either you are lying, or you are so ignorant and statistically inept that you just don’t understand what you are talking about.
I hear that change point analysis may be invalid on autoregressive time series, but as I say, I am no expert.
Am I claiming that the warming has been zero exactly?
Must have missed that “lie”
Right, we’ll go with ignorant, then.
Andy Said: “By the way, I am still waiting to hear from Ian Forrester for the “obvious” explanation why the “pause that doesn’t exist” is occurring” AND above Andy said also: “I can list all 50+ reasons cited for the pause that doesn’t exist if you prefer”
Since you think you know yourself about 50+ reasons cited that explain the variations in the air temp history around the underlying trend then you should be happy that Rahmsdorf has confirmed with mathematical rigor that no statistically relevant variations of the trend itself have occurred since the seventies.
Perhaps time to take the actual trend serious now, even for you Andy and your compatriots of trend deniers. You don’t want to continue to be considered a total fool, don’t you? Perhaps its time to actually look at your belief system and join those who would like society to do acknowledge and hopefully change this trend.
Rahmsdorf has confirmed with mathematical rigor that no statistically relevant variations of the trend itself have occurred since the seventies
and Doug Keenan used a similar technique to show that no statistically significant warming has occurred in the 20th C.
Maybe someone who isn’t a trend denier could explain the basics of time series and CPA to the less well-endowed of the trend-denier community
(Sounds almost trendy…)
Ah yes, Doug Keenan’s model that would violate the 1st Law of Thermodynamics, very convincing.
You know, you could try reading Tamino’s article, which explains it very clearly even for non-experts.
…..Doug Keenan….. oh wow!
You are walking in the footsteps of Giants Andy…
Take a look at the 8 papers that Keegan published. Can you find original research or do you find belligerent attacks against the work of others? How many papers has he written on climate change?
The algorithm used in the study is described by the author,Niamh Cahill, here
I would dispute the statement that
The following paper makes the following observations
and later
Andy, in order to dispute that “Rahmsdorf has confirmed with mathematical rigor that no statistically relevant variations of the trend itself have occurred since the seventies” you must show where he failed in his rigorous calculations. But as you admitted above, you don’t have what it would take in your math education to attempt that.
So you cite cobbled together statements form some ultra-spam ridden website such as “Science Codex” as “evidence”. This is about the lowest you have sunk so far in your fishing for crumbs exercise….
Admit it Andy, you simply don’t get this: Stuff here as it seems way above your head….
Thomas, I apparently need to disprove the fact that Ramsdorfs method is not mathematically rigorous. That is easy for two reasons. First, the work was not done by Ramsdorf. Secondly, is a change point a necessary and sufficient condition for a “pause” to exist?
I.e is it possible to construct a time series that tends towards a gradient of zero, that doesn’t exhibit discrete change points? The answer is “probably” but I would have to test it against Cahills algorithm, which assumed a priori that the temperature time series could be represented as a set of linear segments, and then used a Bayesian technique to infer the parameters of the Iinear segments.
In any case, this is a long way from what I would describe as “mathematically rigorous”
So you cite cobbled together statements form some ultra-spam ridden website such as “Science Codex” as “evidence”. This is about the lowest you have sunk so far in your fishing for crumbs exercise..
Sorry, I should have provided the peer-reviewed reference. Here it is
https://ec.europa.eu/jrc/en/news/climate-anomaly-causes-global-warming-slow-down
Gezz andy you have excelled yourself this time! A greater load of bullshit I have yet to read.
Firstly Rahmsdorf did write the first article to which Tamino refers. (unless he is signing something he did not create like some people we could name here but won’t), and in that article he clearly shows that ” that when it comes to recent claims of a “pause” or “hiatus,” or even a slowdown in global surface temperature, there just isn’t any reliable evidence to back up those claims.” Tamino confirms that by investigating all the data set of global temperature over the recent past and showing that none include a pause or hiatus or slowdown in recent years within statistical significance. As I pointed out elsewhere on this discussion, the data set of 17 or 18 scores is too limited for reliable confidence limits. More on this later.
Now with regards to your second point “is a change point a necessary and sufficient condition for a “pause” to exist. Here you really do excel yourself! Unless you are using an entirely different meaning to the word from everyone else I would have thought that was obvious. A dictionary is helpful here
I think it is clear here that something changes direction, stops, or is interrupted. A change point you might say. Is it really plausible to consider a pause that has not had a beginning – unless of course you argue that there was no pause in the first place and that the temperature has never been increasing. Which is simply to argue against the recorded fact that global temperatures have risen by around 1 degree C since the late 19th Cent. Now there are those who argue that “there has been no warming since…” with the usual start date of 1998. Rahmsdorf and Tamino have both demonstrated that this is not so, indeed warming has continued with a” linear warming trend of 0.175 °C per decade, with confidence intervals of ±0.047 °C per decade. That’s global warming – a measured fact.”
With regard to your proposal “is it possible to construct a time series that tends towards a gradient of zero, that doesn’t exhibit discrete change points?” that is very likely possible – but that is NOT what we are dealing with!! The given does not tend towards zero gradient – end of story!
There is noise within the data but it is foolhardy to suggest that this noise represents a new direction in global temperatures for the basic reason that it is too early to say. Come back in 2028 when we have sufficient data.
Macro, are you able to provide the references to Rahmsdorf’s “rigorous mathematical proof” that “no pause exists”? I found a reference to Cahills algorithm but I can’t see any “proof” other than a blog article.
Secondly, these “proofs” seem to be based on the assumption that mean global temperatures behave as a set of connected linear trends separated by discontinuities. Is there any basis for this assumption?
I have read of various curve fitting exercises based on Fourier analysis etc, and these are often curtly dismissed. I don’t see any more justification for the linear model.
Leaving aside the question of multi-decadal variability vs the “secular trend” (i.e long term trend”) that I referenced a paper to earlier, the Met Office wrote this recently
http://www.metoffice.gov.uk/research/news/recent-pause-in-warming
It then goes on to provide various materials to try to explain this.
These pronouncements from the Met Office seem to be at odds with the “rigorous mathematical proof”
Andy, once again we see you wondering about the number of angels on the head of your pin, picking quotes out of context, spinning like a top, and generally behaving in an obfuscate manner.
If you disagree with the mathematics that Rahmsdorf has used then by all means show us the error. Casting unjustifiable accusations proves nothing on your part at all.
Your second point is akin to asking for some sort of assessment of angels on a pin head, and really only a diversionary tactic designed , as usual, to muddy the water. A curve can always be viewed as a series of infinitesimal straight lines as you well know. No one here thinks otherwise. 10- 30 years over 4 Billion years could well be regarded as infinitesimal.
The current trend line over the past 30 years is 0.175 °C per decade. Prove it otherwise.
Now I have other work to do – I expect you will as usual place some rejoiner but do not expect me to waste any further time.
I leave it to the casual reader to consider the validity of your “argument”
When I see the mathematical proof of Rahmsdorf, I can find the error, if it exists.
(Maybe it’s Rahmsdorf’s Last Theorem, and he didn’t have room in the margin to write it down)
Well your a big boy andy – now’s your chance to become an Andy Wiles! And you know how long that took him.
I’d start here:
http://www.cambridge.org/nz/academic/subjects/computer-science/pattern-recognition-and-machine-learning/bayesian-time-series-models?format=HB
and the sections on change point analysis. pp 25, 205 , 359
Couldn’t resist…
or this:
http://onlinelibrary.wiley.com/doi/10.1111/jtsa12035/abstract
“The article reviews methods of inference for single and multiple change-points in time series, when data are of retrospective (off-line) type. The inferential methods reviewed for a single change-point in time series include likelihood, Bayes, Bayes-type and some relevant non-parametric methods. Inference for multiple change-points requires methods that can handle large data sets and can be implemented efficiently for estimating the number of change-points as well as their locations. Our review in this important area focuses on some of the recent advances in this direction. Greater emphasis is placed on multivariate data while reviewing inferential methods for a single change-point in time series. Throughout the article, more attention is paid to estimation of unknown change-point(s) in time series, and this is especially true in the case of multiple change-points. Some specific data sets for which change-point modelling has been carried out in the literature are provided as illustrative examples under both single and multiple change-point scenarios.”
I’m sure you could find something there to get your teeth into.
Thanks! I always appreciate book references (really!). As for Wiles, I don’t have the intellect or patience to spend 7 years working on my own without telling anyone about what I am doing.
Or the understanding wife, either.
There’s a new article on skepticalscience.com on the pause / slowdown with a new research paper. The bottom line is changes to ocean cycles have led to more heat entering the oceans than in previous decades, and fewer el ninos, but this is unlikely to last much longer.
http://www.skepticalscience.com/global-warming-continues-despite-continuous-denial.html
which pause/slowdown?
It seems pretty obvious that those who persist with trying to maintain a “pause” or “slowdown” or even “hiatus” have not understood the original posts by Stefan Rahmstorf or Tamino:
In particular they fail to appreciate the fundamental statistical fact that that even with 17 – 18 or more years of data, that simply isn’t enough to make any sensible statement about temperature “slowdown” or “cooling” or “hiatus” or “pause” or whatever! because with only small amounts of data the confidence limits are so large as to make any real sensible statement about a trend practically meaningless. At least 30 years of data is required before any real trend can be determined with any confidence, and we have that with data from 1970, and there the trend is pretty clear. Furthermore, the observed temperatures from recent years all fall around the trend line, and within the confidence limits, so that we can say with at least 95% certainty that warming continues unabated.
The article clearly sums it up – but I expect the contrarians not to have read that far – so I will repeat it here:
my bold
If there is no pause, then why are scientists trying to explain the pause?
(E.g see Nigel’s link above)
Yes, how dare those climate scientists investigate the science of climate change. Outrageous behaviour.
Andy: Scientists like to understand the fluctuations of the air temp around the trend. Thats what good scientists do. They likewise want to understand what is happening in strong El-Nino years such as 1998. It seems that ocean circulation patterns are a prime component of fluctuations in global air temps around the trend. The trend however has not changed. This Andy, is what Rahmsdorf has further confirmed.
There is no Pause in the rise of Earths heat content. Its distribution between the various components of the system however does fluctuate. One day you will get it too Andy.
This helps: http://www.skepticalscience.com/graphics.php?g=47
Macro, some of this comes down to how you define pause or slow down. Just eye balling the various graphs there has been a slowdown since about 1998 (very roughly) in surface temperatures.Of course it may not be statistically significant, but my university maths is rusty so Im not going to comment on that aspect.
Slowdowns of about 15 years were predicted in the first IPCC report due to short term natural variability. We know there is a continuing energy imbalance.You would need a 30 year slowdown to have reason to question the fundamental understanding of the greenhouse effect, or to conclude the slowdown is permanent.
The real question is what is causing the slowdown and when will it end? Foster and Rhamstorf subtracted the effects of enso, volcanoes, and the solar cycle and found no recent slowdown in the underlying 50 year trend. They had to subtract all those factors which suggests they all play a part in the slowdown. There will be a jump in temperatures with another el nino, and it is very improbable that el nino has simply stopped. The article I noted discusses this.
“eyeballing” is one thing, statistical analysis is another. Yes one can investigate temperature over recent times But as Stefan Rhamstorf says at the end of his post :
– the simple fact remains that the smaller the data set the less confidence one can have in the result. 15 – 20 scores can only provide a statistic that one can place little confidence in.
I do agree Macro, and I have no doubt the underlying global warming trend from CO2 continues unaltered, but we also need to understand the noise better and how it influences short term trends. This is the only way to silence the sceptics.
If there is a pause in surface temperatures, does that mean that the world’s glaciers and Arctic will stop melting now?
Andy S, you have to stop whittering on about trivia like the supposed hiatus. The concerns over the subtle rise in average world temperatures are just a way of explaining the far more obvious evidence of melting glaciers and Polar ice, shifting seasons, biological changes, lowering oceanic pH, rising sea levels, increasingly wacky weather, and so on.
The atmospheric CO2 and other GHG are rising and it’s a high-school lab experiment to demonstrate they do trap infra-red energy. More energy trapped in the atmosphere will bring about changes and many of them are going to be very difficult for humanity to deal with.
Andy S, you have to stop whittering on about trivia like the supposed hiatus
I am just responding to a blog post about the supposed hiatus.
If the supposed hiatus is “trivia” then why does one write blog posts about it?
AndyS. The IPCC report clearly stated that the “slowdown” was highly likely to be temporary, and gave plenty of reasons. Nothing you say convinces me otherwise.You are just making noise, much like the climate system does, ironically.
The IPCC report clearly stated that the “slowdown” was highly likely to be temporary,
but this contradicts Ramsdorfs “rigorous mathematical proof” that there isn’t a slowdown
Oh dear, whatever AndyS. Your “playing dumb routine” is wonderful. 🙁
Anyway, lets play educate the naughty kindergarten kid:
1) Rahmsdorf concludes that the “noise” or “fluctuations” seen in the air temps do not amount to a change in the global warming trend since the 70ties. Period.
2) The IPPC states that the more recent fluctuations that have been referred to as a “slowdown” by some and a “hiatus” by others are highly likely only temporary.
Both statements are highly compatible obviously: Over the decades since the 70ies here is no change in the trend to be found in the data, only fluctuations, which sometimes are accelerations, such as in El-Nino years (1998, or possibly 2014/15) and sometimes slowdowns. All the while the trend remains as the escalator shows to eloquently.
Btw, 2014 is likely to go down as the hottest year on record.
And anyway, you ware fully aware one would hope that some 90% of the heat imbalance is found in the rise of ocean heat content anyway. The air temp noise is the wagging of the dogs tail at best.
Thanks for the clarification Thomas
Now I would like to know why my ” highly compatible” statements are regarded as “lies” by the trailer trash that go by the names of Ian Forrester and CTG
Good evening
Andy, I believe you said just above:
Or was that nonsense posted by your alter ego?
Oh Andy, and in case your mind is as dumb as you pretend it to be, the “but this contradicts” above is your god damn lie!! Get it? Oh and as of trailer trash…. do you actually own a mirror?
Why is it a lie Herr Thomas, if a pause at doesn’t exist has resulted in a hiatus, then referring to the hiatus is not a lie. If you are lying about the hiatus, then the rigorous proof that doesn’t exist is a lie. Either way, it looks like a contradiction to me.
Unless, of course, you can hold two contradictory positions at the same time, which is common in modern thought.
Perhaps it is a wicket problem?
Thomas, you have to remember that andy inhabits an alternate universe where time is non-linear. This is how things work in the andyverse:
Study A is done in year X, and makes statement F. Study B is done in year X + 3, and makes statement G, based on new data that occurred since year X. This means that statement F is now redundant.
According to andy, the authors of study A should have taken into account the data that occurred for the 3 years in the future, and made statement G back in year X.
It’s only we poor souls stuck in our linear time sequence who can’t see these obvious truths.
it is now clear CTG. When Hansen, Phil Jones, the IPCC and the Met Office made statements about The Pause/Hiatus they were not aware at the time of the Rigorous Proof of Rahmsdorf, so their statements were not lies, they were just misled.
Does that not also apply to me? I was not aware of the Rigorous Proof of Rahmsdorf when I made the statement that you claimed was a lie.
If I make a statement at point x in time, and a climate scientist makes the same statement at point x, if the climate scientist is not lying, then does this imply also that I am not lying, or am I lying because I should have predicted The Rigorous Proof of Rahmsdorf?
andyS stop the ad hominems. I do not live in a trailer and no one but lowly scum balls like you have ever called me trash. You are the one posting trash. As CTG noted you posted:
Note that there has now been a steady increase in temperature for 18 years.
http://www.woodfortrees.org/plot/uah/from:1997/trend/offset:0.3/plot/hadcrut4gl/from:1997/trend/plot/gistemp/from:1997/trend/plot/best/from:1997/trend/offset:-0.3
Are you blind or have you dug your self such a large hole that you cannot accept that you are lying through your teeth? Your behaviour is despicable, you give no thought about what is going to happen down the road as long as andyS is comfy and enjoying life and screw everybody else.
You have now shown to everyone posting here that you are not incompetent and ignorant of what you say but you are one of the most dishonest liars I have ever come across. No doubt you will read this with a nasty smirk on your face and that only shows how low you will get.
Gareth, why do we have to put up with his dishonest nonsense? He was banned a while ago but he is back just as dishonest as ever.
Ian Forrester, I’m glad you popped up to defend yourself. Sorry for calling you “trailer trash”.
I guess it’s OK to call be despicable and a liar, though, with no evidence to back it up
I fully accept the Fundamental Theorem of Rahmsdorf (though I haven’t seen it) which rigorously proves that The Pause/Hiatus doesn’t exist, even though the Met Office, The IPCC, James Hansen and Phil Jones have written about it
Are these people/organisations also despicable liars too?
It’s all so confusing. Perhaps someone who is non-despicable can explain it to me in more simple terms.
For example, Phil Jones:
B – Do you agree that from 1995 to the present there has been no statistically-significant global warming
Yes, but only just. I also calculated the trend for the period 1995 to 2009. This trend (0.12C per decade) is positive, but not significant at the 95% significance level. The positive trend is quite close to the significance level. Achieving statistical significance in scientific terms is much more likely for longer periods, and much less likely for shorter periods
http://news.bbc.co.uk/2/hi/8511670.stm
This on the face of it seems to be a despicable lie. Maybe the non-despicable Ian Forrester can explain to the despised person that I am in simple terms?
Obviously, Andy Scrase would prefer that this blog be diverted to discussing his trolling, rather than the substantive issues – that, after all, is his job.
Actually Rob, I am trying to figure out why you, CTG and Ian Forrester are still insisting on calling me a “liar” when I have clear evidence that climate scientists and organisations have made the same claims as me.
I guess this is “trolling” in your book, unlike the stream of profundity that you provide us
Andy,
You are confusing variation with trend. Anyone can discuss why there has been variation, the key point is that the trend continues unabated.
No I am not confusing variation with trend. The article clearly contradicts the statements made by the IPCC, The Met Office, James Hansen, and Phil Jones
Besides, I have provided a reference to a paper that shows the long term trend is declining, when the Multi-Decadal variation is filtered out
You seem to be having some problems with basic statistical concepts. I’ve got a book you can borrow.
You seem to have some problems with basic logic. I have a book you can borrow
You have said several times that there has been “no warming since 199x”. In defence of this statement, you post a quote from Phil Jones that says there is a positive but not statistically significant trend since 1995. If you think these two statements are equivalent, then you do not understand statistics.
They are not equivalent statements.
But most people know what this statement means, in broad terms, and is consistent with the statements made by the IPCC, James Hansen, and the Met Office
EDIT: Maybe if the statement that there has been NO warming since x (x = 1998 for example) is false, you can tell me how much warming there has been, and what the error bounds on this are,
Can’t you read graphs, was that another function you missed in your maths courses? I pointed out to you the trends since 1998. Anyone who has got past grade 12 maths should be able to work out what the trend (rate of change) and thus the total change over the16 or 18 years we are discussing. Anyway, I just looked up what Hansen had to say and of course it was nothing like what dishonest andyS is claiming. Hansen was not talking about 16 or 18 year periods but 5 years if andyS had done some statistic courses he would have known that such a short period is meaningless. No wonder any sane and intelligent person responding to this evil character calls him dishonest.
http://www.columbia.edu/~jeh1/mailings/2013/20130115_Temperature2012.pdf
So if you are aware that these are not equivalent statements, and yet you use them as if they are equivalent statements, you are lying.
Hansen said this
The “five-year mean” doesn’t refer to a five year period of interest. The five year mean refers to a five-year running mean, I presume
So if you are aware that these are not equivalent statements, and yet you use them as if they are equivalent statements, you are lying.
CTG, how much warming has there been since 1998, and what are the error bounds on this?
Perhaps you could answer the question rather that droning on about “liars”
According to the trend calculator, GISTEMP shows a trend of 0.075 ± 0.117 °C per decade. That is not zero. Yes, I am aware that the error bounds include zero, but they also include 0.192 °C. So it is not possible with that trend to claim that the trend is equal to zero (or your waffly equivalents “no warming since” or “temperatures have not changed”). The error bounds on that linear regression in isolation are not sufficient to tell you what the true trend is. That is the whole point of Tamino’s article – that you need to establish whether or not there has been a statistically significant change from the longer term warming trend, and there simply has not been such a change.
So there is no way that your statements hold true.
From the SkS trend calculator
1998-2014
GISTemp 0.064 +-0.127 C/Decade
NOAA 0.039 +-0.121 C/Decade
HadCrut4 0.049 +-0.123 C/Decade
Berkeley 0.075 +-0.125 C/Decade
RSS -0.052 +-0.217 C/Decade
UAH 0.060 +-0.223 C/Decade
And?
Andy, a few questions for you:
1) Do you comprehend what this graph is telling us?
2) Do you comprehend what this graph is telling us?
3) So in the discussion of the rise of Eath’s heat content and the trend of Global Warming (all Eath’s systems) what do you think is the relevance of fluctuations around the trend of air temperatures?
4) Are you as stupid as you seem or are you simply making it up as you go to deride the discussion on this website Andy???
Thomas, I really don’t know why I bother. I have already posted a link to a paper that separates out the multi-decadal variability from the secular trend (i.e the “escalator” graph) which also discusses the slowdown in the secular trend. You dismissed this peer-reviewed paper as “spam”
Regardless of whether there is a long term trend, or change-points can be found, I have provided data and quotes from the IPCC, Met Office, Hansen and Jones, that show the general concept of a “hiatus” is widely accepted
For my efforts, I get called a liar, an idiot, despicable, and even evil
Have a really great Christmas folks
Rolling on the floor laughing 🙂
Furthermore, Thomas, I provided a link to Cahill’s comment on RC that explained the algorithm used, yet you still seem to be under the impression that Rahmsdorf has provided a “rigorous mathematical proof” of the lack of inflexion in the temp. series.
You have yet to provide any evidence of this “rigorous mathematical proof”, meanwhile spamming us with yet another link to the SkS escalator graph
It might actually pay to understand the comments I make rather than instinctively respond with your pre-programmed set of Flash Cards from SkS and your little green book on “how to talk to a climate change sceptic” or whatever material you chose to use
That is the great mystery that we’d all like an answer to. Why do you bother? We are obviously all a bunch of know-nothing blockheads who will never see the light as you do, so why bother? Seriously, why don’t you just go away?
cTG
I did actually “go,away” for a while and you and your fellow bedmates managed to have a very interesting discussion about the plural of “nincompoop” which caused much delight and amusement here.
The only reason I am still here is that you and Ian Forrester keep referring to me as a “liar” not to mention “despicable” “evil”
Etc, without a shred of evidence to back up your claims.
Have a Happy Christmas
Aw, diddums, did the nasty man say nasty things about you? There, there.
So, you posted some pretty sciency-looking numbers back there. Did you have an actual point to go with those? I notice that you can’t even find the ± symbol on Windows, though, so I’m not holding my breath. (It’s Alt-241, by the way, just so you can look extra sciency on your next post)
andyS moans:
That is another lie.I provided lots of evidence for your lies. If you simply ignore them and pretend that they do not exist that is just more of your dishonesty.
Get lost! You have the morals of a rabid skunk and a personality to match.
Let’s review facts Ian Forrester. You provide a set of graphs without error bars, and claim that I am “lying” because the trends are all non-zero and positive
When I review all the errors for these trends, the errors are ALL much more than the trend values, which themselves are tiny (compared with the previous 14 year period).
Furthermore, one of the series is even negative over this time period
Next, you accuse me of mis-quoting Hansen, and mix up the 5 year running mean with the period of interest (10 years in this case)
So, I have presented all the facts. I haven’t made any claims of statistical significance, nor have I made any claims on what might happen into the future (that’s a subject for a another day)
I could rise to the bait and return volley with a stream of abuse directed at Ian Forrester, but Ian will run away screaming like a little girl that the horrid man is upsetting him and the horrid man needs to be banned.
It’s a pattern that gets repeated across many blogs that Ian frequents
So that would be a no, you don’t have an actual scientific point to make.
So that would be a no, you don’t have an actual scientific point to make.
I have given up on discussing science with you CTG. You are clearly no interested in science. You are merely interested in maintaining some kind of status quo, even if that involves making contradictory statements.
What I am interested in is the fact that you and Ian Forrester insist on claiming that I am lying.
You have nothing to back up this claim. Nothing.
But then why does that surprise me?
EDIT. I see it’s 8:22 am. Must be time for Thomas to link to the “escalator graph”
Andy,
You selectively quote people to misrepresent them and wonder why others get upset.
You quote a lightweight spectral analysis paper from PLoS ONE which ignores underlying climate dynamics. Not all papers are equal.
You then post trends from 1998-2004, which if you had read the post, would know is a pointless exercise.
If there was a pause, the super El Niño year of 1998 would be easily the warmest year ever recorded. Now it takes the mere hint of El Niño to beat it.
Merry Christmas.
andyS makes an honest statement at last:
But why did it take so long for you to come to realize that you just spout rubbish? We’ve known it for years.
Yes, andy, you have certainly given up any semblance of science in your posts. Now you won’t even discuss statistical significance, you are just asserting that temperatures have not changed because you say so.
I take back what I said about you lying. It is clear now that you are just arguing from total ignorance.
You’re wrong CTG, andyS knows exactly what he is doing. That is what makes him so despicable. It is dishonesty through and through.
Ian Forrester,
I have given up discussing science with you
I am very interested in science.
[Snipped: Tone it down, please. That applies to Ian and CTG too. This should be a discussion – robust or otherwise – of the subject of the post, not an exchange of unpleasantries. GR]
So what is the science behind your assertion that “the surface temps haven’t changed in the last 16 years or so”?
Simply quoting trend values with confidence limits is not good enough, as Tamino’s article shows. Clearly you disagree with Tamino’s analysis, but you have not given any scientific reasons why you disagree.
I’m not disagreeing with Cahill’s analysis
I am merely repeating what the IPCC and the Met Office publish in their official documentation, that there has been a slowdown/pause/hiatus in the last 16 years or so, that looks pretty close to zero degrees of warming over that period.
If it is a “lie”, why do the IPCC and the Met office repeat this “lie”?
The temperature trend over the last few years is certainly lower than the long term trend, nobody is disputing that. The question is whether that is significant. Tamino and Cahill have demonstrated that the slowdown is not significant.
What is most certainly clear is that there is absolutely no scientific evidence for your statement that “temps haven’t changed”. The trend over the last few years is non-zero, so “temps” have definitely changed.
” What is most certainly clear is that there is absolutely no scientific evidence for your statement that “temps haven’t changed”
Other than all the temperature series that I presented earlier, all of which show a trend close to zero, one or two are even negative
Non-zero is not zero, that’s why it’s called non-zero, bit of a giveaway, really.
Oh, and by the way, the figures you quoted from the trend calculator did not include the data from 2014, which is why you gave a different figure for GISTEMP. You put 2014 into the end box, which excludes the data from 2014 – to get the data to present date, you should leave the end box blank.
Ironic, really, as this pretty much proves our point – as more data comes in, the less significance there is in the slowdown.
Non-zero is not zero. This is something we can agree on.
If I have a parcel, and I make the assertion that the parcel weighs 1 kg, am I lying?
The parcel could be weighed on a number of measuring devices, each with their own accuracies. So the parcel might actually weigh 0.998kg +- 0.01kg, for example
If I took the parcel to the post office to post it, would I expect to call the postal worker a “rabid skunk” for claiming that the parcel weighed 1kg, when in fact I had weighed it at 0.998kg +-0.01kg?
Confidence limits have nothing to do with measurement precision, so I have no idea why you are talking about that.
The simple fact of the matter is that temperatures have changed over the last 16 years, contrary to your assertion. The IPCC have noted that there has been a slowdown in the trend, but were very clear that this is not a pause (see Box 9.2).
You are claiming something different to what the IPCC said, and there is no scientific evidence to back up your claim.
So anyone that claims that a measured value has an integer value is a liar, by your definition
If I say “the man weighs 80 kg”, I am lying.
if I say “a day is 24 hours long”, I am lying
If I say, “a year is 365 days long”, I am a liar, a rabid skunk, a despicable, evil person
Etc.
Wait, what? Where did I say anything even remotely like that? Your parcel example related to the precision measurement of a single value, so has no relevance to the issue of confidence limits on a trend line. I didn’t say anything about whether it is permissible or sensible to round to an integer value, because it is just not relevant to this discussion.
Are you suggesting that because the confidence limits include zero, you are therefore justified in rounding the trend to zero? What a bizarre suggestion. I’m pretty sure you won’t find that in any stats textbooks.
I am suggesting that the casual observation “that something is zero” (not a mathematically rigorous statement) is a conversational version of the statement that something is close to zero, and the error bounds do not preclude exactly zero as a potential value.
Obviously, the parcel analogy is limited, as this is a single measurement. Global mean temperature, if such a concept exists, is an aggregation of measurements over time and space.
Nevertheless, if one is not permitted to say, casually, that “something has zero value”, then by induction, we should not permit anyone to make any statement about a value without the error bounds, and the statistical context of the measurement.
It would make life rather turgid though, if every single statement had some disclaimer attached. It would read like the UK NHS diversity office’s guidelines on how to run a diverse and non-discriminatory Christmas party
Okay, I accept your explanation that you are not lying, you are just being hopelessly imprecise and unscientific. Fair enough.
CTG – thanks, we can draw a line under that one then.
(* readers draw a collected sigh of relief *)
I haven’t seen anyone use (* *) for comments in over twenty years. Are you still programming in Turbo Pascal Andy?
EDIT Ooops, my attempt at lame HTML humour was treated as a comment. Let’s say…
// No comment
then…
Because too many people are getting distracted and making claims that short term variations are a excuse for inaction at a time when panic should be setting in and a serious response is demanded.
The latest Lima reports are truly depressing, once again we’re getting prevarication and dithering. I find myself almost praying for a really awful heat wave/drought or such that would hopefully scare the bejezuz out of all those knot-head politicians that are still in deep denial.
I doubt very much if andyS has actually read any of IPCC AR5. He seems to get most of his information from denier sites or biased media reporting. Here is a quote from AR5 WG1 chapter 2 summary:
No where do I see “pause” mentioned. In fact it does explain the deniers affection for 1998 as a starting point since the only 15 year periods with a lower trend than the long term trend include1998. Anyone who claims to understand statistics should be aware of cherry picking.
IPCC AR5 SPM
http://www.ipcc.ch/pdf/assessment-report/ar5/wg1/WG1AR5_SPM_FINAL.pdf
(Section B1)
Gareth, how on earth can I respond to andyS in a civil manner when he posts such nonsense? He is quoting from the SPM which we know is not as rigorous as the actual WG1 report. What he quotes, which I assume is to dispute what I posted says exactly the same as what I said except that in the SPM report the vital bit about starting points for short term trends is omitted:
Did he not read my post or is he being his dishonest and misleading self?
You said that you found no reference to a hiatus or the 1998 date and I found both in the SPM for you
You can read what you want into the meaning of the numbers, but there they are.
Numbskull, they say that short term trends starting close to 1998 are meaningless because of the very high starting point. Why do you continue with your dishonest nonsense? And surely you realize (or should realize) that the SPM’s have much more political influence than the actual scientific reports?
Ian Forrester asks
The answer would appear to be, “with difficulty”.
December 11, 2014 at 3:20 pm “we will call you “andy-the-liar-S”.”
December 12, 2014 at 5:03 am “Do your clients like how you are shown to be so dishonest? I would certainly not pay anyone for information supplied by a well know liar.”
December 12, 2014 at 6:51 am “You just continued your lies about temperature in your latest comment. See how easy it is to show you up as a liar?”
December 17, 2014 at 9:11 am “andyS stop the ad hominems. I do not live in a trailer and no one but lowly scum balls like you have ever called me trash. You are the one posting trash”
December 17, 2014 at 10:23 am “No wonder any sane and intelligent person responding to this evil character calls him dishonest.”
December 18, 2014 at 5:13 am “That is another lie.I provided lots of evidence for your lies. If you simply ignore them and pretend that they do not exist that is just more of your dishonesty.”
Get lost! You have the morals of a rabid skunk and a personality to match.”
December 18, 2014 at 9:29 am “You’re wrong CTG, andyS knows exactly what he is doing. That is what makes him so despicable. It is dishonesty through and through.”
December 18, 2014 at 4:26 pm” Numbskull, they say that short term trends starting close to 1998 are meaningless because of the very high starting point. Why do you continue with your dishonest nonsense? ”
———————
Any time you want a civil discussion with this “troll”, aka “it”, just feel free to start.
Will you guys please, please, PULEASE stop feeding the troll. It’s been clear since Dec 11 he’s just here to argue. I doubt that he’s even read the original article, judging by how far off-topic the arguments are.
Plus I’m getting buried in relentless, pointless incoming emails.
I apologise, I had no idea that quoting from the IPCC SPM is considered “trolling”
By the way, I did read the original article and I also linked to the explanation of Cahill’s algorithm on Real Climate. Everyone still seems to be under the impression that this is original work by Tamino or Rahmsdorf, however, indicating that my reading might be slightly more detailed than some.
Furthermore, my concern was being referred to as a “liar”. At least CTG has acknowledged my explanation that I have not been “lying” and we have shaken hands (virtually) and moved on.
Tamino’s analysis is independent and original, he uses a different approach to that used by Cahill. The RealClimate piece was written by Stefan Rahmstorf, so it is fair enough to call him the author of the article. Cahill did the work at the request of RealClimate, as the article makes clear.
So your reading was not particularly thorough, it seems.
The post by Tamino starts by referencing Rahmsdorf, which references Cahill.
Tamino then goes on to his dice-rolling analogy, which you may remember a long time ago I mentioned sounded like Keenan’s work. This was then greeted with a series of ad homs against Keenan
Remember?
Seconded. The troll tactics are obvious, and the best reply, whatever the temptation to do otherwise, is to ignore its posts. It would be good though if the forum had an “ignore” feature that many forums do have – so that one has the option of making selected contributors invisible.
RW, you can ignore “its” posts by using the unsubscribe feature on the subscription manager.
“It” tries to be helpful, when “it” can
Andy – let’s get this straight..
Stephan Rahmsorf is Professor of Physics of the Oceans at Potsdam University, he received his PhD at VUW incidentally. I don’t know, but I would presume that Ms Niamh Cahill of the School of Mathematical Sciences, University College Dublin, is carrying out Post Graduate work under his supervision. or he requested her expertise on this work. Whatever – I am sure that Rahmsdorf is fully aware of the techniques of change point analysis which it would appear is the subject of her research. You know – this is how science advances does it not?
Listening in on Andy’s litter-mates, it seems that, faced with the imminent demise of their “global warming stopped in 1998” meme, the denialerati are engaging in what defeated generals the world over call “a strategic retreat to previously-planned positions”:
http://www.climateconversation.wordshine.co.nz/2014/12/eco-minimal-criminals/comment-page-1/#comment-1262327