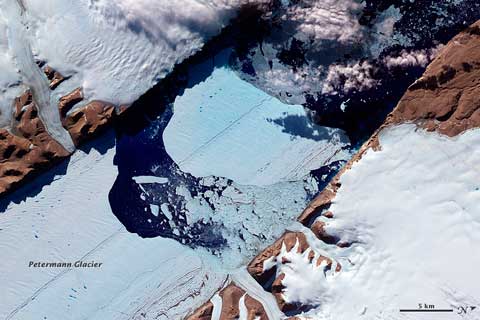
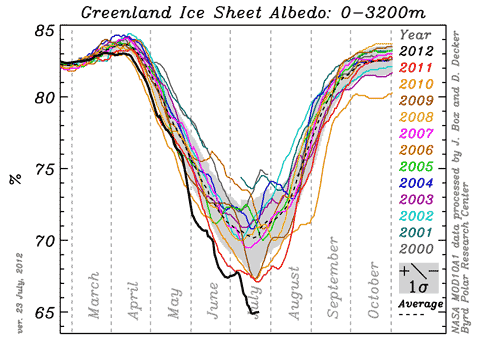
July has been an amazing month in Greenland. The Petermann Glacier has given birth to another huge ice island — taking its terminus further back up its fjord than at any time in the last 100 years (at least), record high temperatures have been recorded at the summit of the ice sheet at 3,200 meters, initiating surface melt over the whole vast sheet, ice sheet albedo has plummeted, and the Jakobshavn Isbrae’s calving front has retreated into the ice sheet.
The best coverage of the Petermann event, as on most matters to do with the Arctic summer and sea ice melting season is to be found at Neven’s Arctic Sea Ice blog. It’s well worth reading the comments under the Petermann post there, to get a really informative picture of what’s being going on. Here’s a description by Dr Andreas Muenchow ((Andreas provides great coverage of the Petermann glacier at his blog — perhaps unsurprisingly, as he’s on his way up there to recover instrumentation soon.)) of what the calving would have been like:
I described the Petermann calving to some media folks as a gentle and very quiet affair similar to a rubber duckie pushed out to sea from the deck of a flat pool.
Some duckie, some pool…
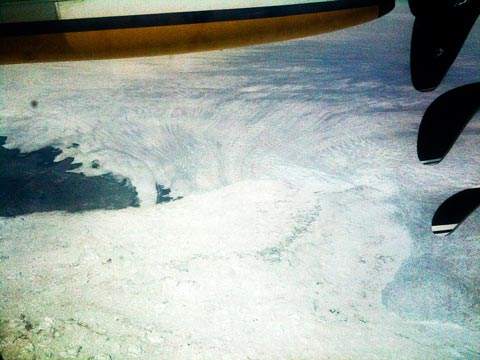
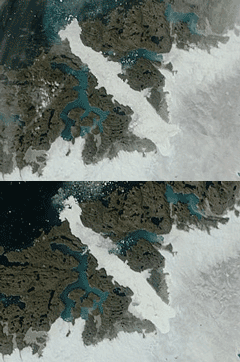 Further south, the the “root” of the Jakobshavn Isbrae has enlarged significantly, with the calving front of Greenland’s most productive glacier retreating further into the ice sheet. The “blink” image I’ve cobbled together (left) shows day 203 of this year compared with day 202 of last year ((Source: 2012, 2011.)). The difference is large and very obvious. Greenland specialist Dr Jason Box was flying out of Ilulisat shortly after the retreat earlier this month, and snapped the photo below out of the window of his plane. As he commented on Facebook, it looks like the glacier has divided into two streams.
Up at the summit of the Greenland ice sheet at 3,200 metres, a new high temperature record of 3.6ºC was set on July 16, hard on the heels of four days in row of temperatures above freezing, from July 11 to 14. Considering that temperatures above zero had only been recorded four times in the preceding 12 years, this amounted a remarkable heatwave, and triggered an astonishing melt record.
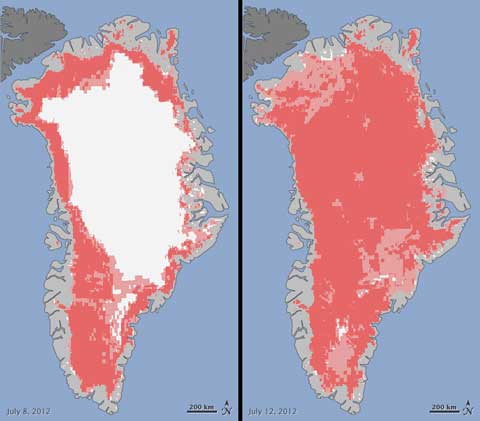
This NASA graphic shows how the melting surface, shown in shades of red, spread over the whole surface of the ice sheet from July 8 to July 12. This amounts to “the largest extent of surface melting observed in three decades of satellite observations”, according to NASA. The last such melting event occurred in 1889, and ice cores show that they occur every 150 to 250 years. However, given the steady increase in melt area over the last decade, and the precipitous drop in ice sheet albedo (see below), especially at high altitudes, it may not be 150 years before such a melt happens again.
The last time I looked at this extraordinary summer in Greenland, it was to report Jason Box‘s view that “it is reasonable to expect 100% melt area over the ice sheet within another similar decade of warming”. It took two weeks to come true. Forgive me if I find that alarming.

And I note from Neven’s blog forecasts of +O°C temperatures forecast for this weekend, too.
May we live in interesting times.
Excellent overview, Gareth.
But enough about Greenland already, back to the sea ice!
I couldn’t have asked for more: Loss of Arctic sea ice ‘70% man-made’.
🙂
That’s a nice stock photo of a Polar Bear. So creative.
That’s a nice stock trolling comment, Andy. So creative.
It is a stock photo. It says so underneath
That is a stock trolling comment. It is asinine, irrelevant, and intended only to draw attention away from the topic to the no-life troll making the comment.
Don’t you think that pictures of Polar Bears sitting atop a piece of ice floe is a little cliched?
Why do they have to drag out these stock photos everytime there is an article about the Arctic?
It’s about as original as showing water vapour from a cooling tower when writing about “emissions”.
That’s enough polar bears. They’re off-topic here.
Are you telling me you actually read the article, and all you took away from it was a polar bear picture? That’s amazing Andy… amazing.
… I mean, you could have critiqued the font choice instead…
No I think the choice of font is just fine.
The choice of ‘Trebuchet MS’, Verdana, sans-serif is pretty standard and I liked the way Neven provided css for both browser and print.
Spelling errors? Style? Punctuation?
Come on, there must be something else non-essential worth critiquing?
I very nearly tagged that story on to the end of the piece, but – as you say – enough Greenland already…
Enough Greenland? Surely not?…
It was posted here before I think but I put it in again here because its so stunning: http://www.youtube.com/watch?v=DjeIpjhAqsM
Greenland glaciers flowing and calving in time lapse video.
Gareth did you see this piece about the 150 year frequency, etc?
http://www.thearcticinstitute.org/2012/07/where-did-all-ice-go-medias-coverage-of.html
Thanks cindy, I have seen that – but it’s not much more than an extended whinge about how headline writers got carried away and oversold the story. The real gen on the frequency of melting can be seen in this chart (borrowed from Andreas Muenchow’s post on the subject:

The vertical green lines are melt events at the GISP2 site (slightly lower than Summit IIRC). The 1889 event is the single line at left (I presume). The one before it appears to have been about 750 years ago, so “every 150 years” is probably based on averaging over the Holocene, not the last 1,000 years.
Given the high standard deviation in this “every” 153 years claim, the final quote from the NASA press release is almost criminally misleading. “Right on time” only makes sense if we’re looking at a timeframe of something like 10,000 years and is a serious understatement of the significance of this event in the context of Greenland warming, Greenland ice sheet mass loss, Arctic sea ice decline, NH warming and, of course, global warming.
thanks Gareth