
This article, by Steve Sherwood, of UNSW Australia and Stefan Rahmstorf, of the Potsdam Institute for Climate Impact Research, currently working in Australia, first appeared at The Conversation.
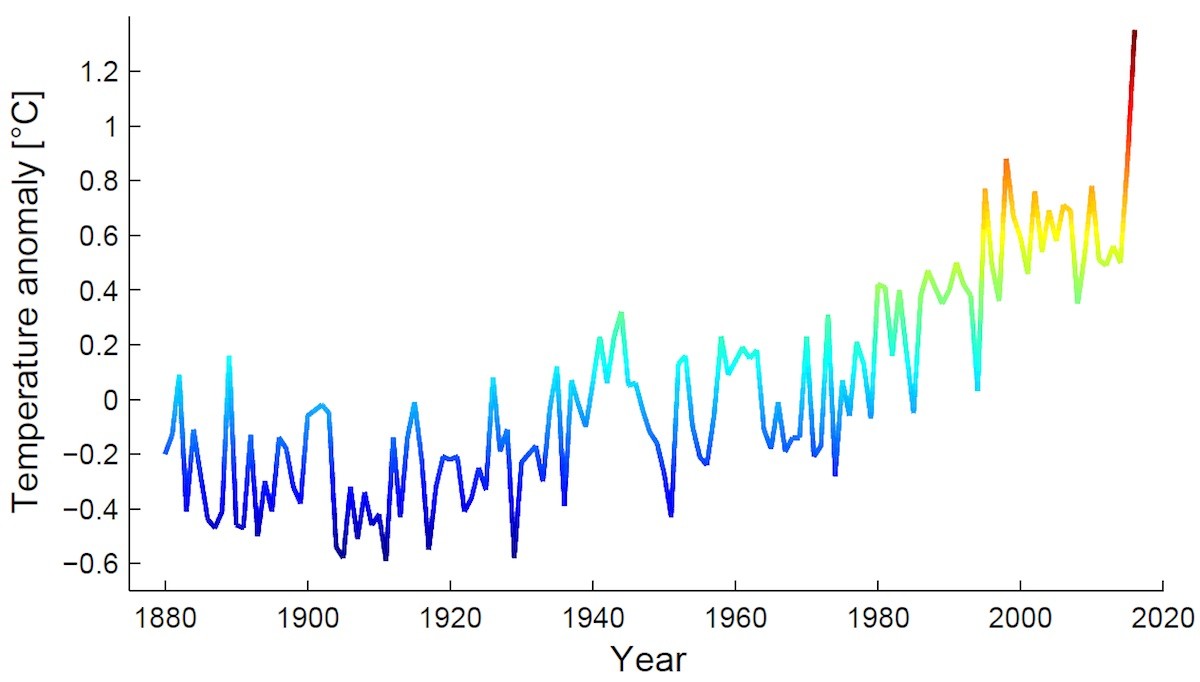
Global temperatures for February showed a disturbing and unprecedented upward spike. It was 1.35℃ warmer than the average February during the usual baseline period of 1951-1980, according to NASA data.
This is the largest warm anomaly of any month since records began in 1880. It far exceeds the records set in 2014 and again in 2015 (the first year when the 1℃ mark was breached).
In the same month, Arctic sea ice cover reached its lowest February value ever recorded. And last year carbon dioxide concentration in our atmosphere increased by more than 3 parts per million, another record.
What is going on? Are we facing a climate emergency?
El Niño plus climate change
Two things are combining to produce the record warmth: the well-known global warming trend caused by our greenhouse gas emissions, and an El Niño in the tropical Pacific.
The record shows that global surface warming has always been overlaid by natural climate variability. The biggest single cause of this variability is the natural cycle between El Niño and La Niña conditions. The El Niño in 1998 was a record-breaker, but now we have one that looks even bigger by some measures.
The pattern of warmth in February shows typical signatures of both long-term global warming and El Niño. The latter is very evident in the tropics.
Further north, the pattern looks similar to other Februaries since the year 2000: particularly strong warming in the Arctic, Alaska, Canada and the northern Eurasian continent. Another notable feature is a cold blob in the northern Atlantic, which has been attributed to a slowdown in the Gulf Stream.
The February warming spike brought us at least 1.6℃ above pre-industrial global average temperatures. This means that, for the first time, we have passed the 1.5℃ international aspirational goal agreed in December in Paris. We are coming uncomfortably close to 2℃.
Fortunately, this is temporary: the El Niño is beginning to subside.
Emissions still increasing
Unfortunately, we have done little about the underlying warming. If unchecked, this will cause these breaches to happen more and more often, with a greater than 2℃ breach perhaps only a couple of decades away.
The greenhouse gases slowly heating the Earth are still increasing in concentration. The 12-month average surpassed 400 parts per million roughly a year ago – the highest level for at least a million years. The average rose even faster in 2015 than previous years (probably also due to the El Niño, as this tends to bring drought to many parts of the globe, meaning less carbon is stored in plant growth).
A glimmer of hope is that our carbon dioxide emissions from fossil fuels have, for the first time in decades, stopped increasing. This trend has been evident over the past couple of years, mainly due to a decline of coal use in China, which recently announced the closure of around 1,000 coal mines.
Have we underestimated global warming?
Does the “spike” change our understanding of global warming? In thinking about climate change, it is important to take the long view. A predominant La Niña-like situation over recent years did not mean global warming had “stopped” as a few public figures were (and probably still are) claiming.
Likewise, a hot spike due to a major El Niño event – even though it is surprisingly hot – doesn’t mean global warming was underestimated. In the longer run the global warming trend agrees very well with longstanding predictions. But these predictions nevertheless paint a picture of a very warm future if emissions are not brought down soon.
The situation is similar to that of a serious illness like cancer: the patient usually does not get slightly worse each day, but has weeks when the family thinks he may be recovering, followed by terrible days of relapse. The doctors do not change their diagnosis each time this happens, because they know this is all a part of the disease.
Although the current El-Niño-driven spike is temporary, it will last long enough to have some severe consequences. For example, a massive coral bleaching event now appears likely on the Great Barrier Reef.
Here in Australia we have been breaking heat records in the past few months, including 39 straight days in Sydney above 26℃ (double the previous record). News reports seem to be focusing on the role of El Niño, but El Niño does not explain why oceans to the south of Australia, and in the Arctic, are at record high temperatures.
The other half of the story is global warming. This is boosting each successive El Niño, along with all its other effects on ice sheets and sea level, the global ecosystem and extreme weather events.
This is the true climate emergency: it is getting more difficult with each passing year for humanity to prevent temperatures from rising above 2℃. February should remind us how pressing the situation is.
![]()
This article was originally published on The Conversation. Read the original article.
A friend commented that an ex-colleague at Canty Uni made claims about the ice/seabed cores from the Ross Sea revealing a regular 1200 year cycle of warming and cooling that hasn’t been observed before and may be contributing to the current rises in temperature. I can’t find anything on the net about it, maybe it’s too soon.
I’m a little sceptical, I thought if anything we were slowly cooling prior to the Industrial Revolution. If there is a cycle, I suspect it will be very faint and only contributing a small proportion. We would have spotted it sooner otherwise.
Any thoughts?
I hadn’t heard of any 1200 year cycle. Sounds suspiciously like something Fred Singer used to peddle…
True, I had noted hints of something like it at the wacko sites but disregarded them automatically. I’m curious as to whether this is something new as the Andrill findings must be still percolating through the peer review process.
This recent article by Chris Mooney in the Washington Post discusses Andrill findings…
Connecting a “curve fit” through the maxima and a separate one through the minima on the graph shows nicely the channel within which our temps are developing. Not only the first but worryingly also the second derivative of Temp(time) looks so far clearly positive. We need to get CO2 down before feedbacks take the matter out of our hands entirely.
That’s fascinating. I was under the impression that climate change was defined over a 30 year time scale to determine any changes in long term climatic trends.
Since 2016 is a leap year, February had 29 days.
Are you now claiming that long term climatic trends are defined over a 30 day (approx), rather than 30 year, time frame?
Will future climate trends be determined over 30 minute time frames, since the process is obviously speeding up?
Admittedly, the pause that doesn’t exist was less than 30 years, but then the period of global warming (1976-1998) the preceded the pause that doesn’t exist was also less than 30 years.
andy FYI 140 > 30. And here I thought you had a degree in maths!
What is 140?
Please show your working for full marks
I think a dissertation on Peano, Frege, Russell et al would be entirely off topic here.
I assume that you agree there exists a number 0?
And that every number has a successor?
And you agree that the Principle of Mathematical Induction holds true?
Need I go on?
140 = 30 + 90.
I think a dissertation on Peano, Frege, Russell et al would be entirely off topic here.
I assume that you agree there exists a number 0?
And that every number has a successor?
And you agree that the Principle of Mathematical Induction holds true?
Need I go on?
140 = 30 + 110.
Are your comments iterating or recursing?
There is no edit button andy
Precisely, Andy, climate trends are seen over long time frames. That’s why you need to connect the dots over long timeframes to see the trend. Looking at an envelope of that trend by seeing how maxima and minima progress is a common part of that analysis.
And as you quite aptly said it and confirm here, that talk about a GW pause based on neglecting long-term trends and looking just at the short time between 1998 and 2010 while neglecting the context was nonsense as we told you many times. I am glad you finally come to the same conclusion now. What took you so long to realise that?
Precisely, Andy, climate trends are seen over long time frames
So why are you looking at second derivatives of what has happened over the past month?
He’s not andy – that’s the whole point.
The data represents 140 months of recorded Global temps for the months of Feb. Only the end point of that data set represents Feb 2016.
I’m sure I could find a metric like “the hottest Thursday in the last week of March since the instrumental record began” and use it to gain a PhD in Climate Science
I’d probably fail NCEA Level One Maths though, using the same argument.
Andy, you are once again, I presume deliberately as usual, misrepresenting what is said:
Take a look at the long-term trend. You may visualize the envelope of that by imagining a smoothe curve fit through the maxima (say 1890, 1945, and then do another one by connecting the minima. You get a channel that shows the development of the tops and the bottoms of the noisy temp curve. The second derivative of such a long-term trend looks positive over the last 50 years. And I suppose you know what that means. I am not the slightest interested in the steepness of the rise over the last couple of years, or the drop that will likely follow in the next year, that is noise. But the level of the current maximum is not, nor is the level of the minima which have been also steadily rising. These are another data point in the envelope of the extremes.
And both the maxima and the minima have been getting hotter, and as I said, the second derivatives look clearly positive.
Meant to say: connect with a curve fit the maxima around (1890, 1945, 1998, 2016), and the appropriate minima of the curve around (1910, 1930, 1950, 1975, 1994, 2004)… you get the idea…
For goodness sake andy – the values are not the maximum value of any one month – or the minimum for that matter – they are the average for the 28 days of Feb (or 29 in the leap years) expressed as an anomaly from the base line 1951 – 1980 (30 years).
What do you mean `Wake up call` If there is anyone out there that is asleep to the issue of climate change they would have to be Andy S or brain dead.
There is our government!
Well as the government is not Andy S, that leaves the other alternative…
According to the World Meteorological Organisation Carbon release into the Atmosphere is significantly faster now than at any time since the dinosaur extinction event and especially also much faster than during the so-called Palaeocene–Eocene Thermal Maximum (PETM), that saw temperatures rise by 5C over a few thousand years.
The consequences of this super fast CO2 kick to the Earth’s climate and ocean system are likely going to be severe and many of the consequences of what we have done may not yet be apparent until it is too late.
http://www.theguardian.com/environment/2016/mar/21/carbon-emission-release-rate-unprecedented-in-past-66m-years
I wish to make a correction. Given more recent comments by Simon Bridges re new areas of fossil fuel exploration and Andy S`s absurd and ignorant comments herein I declare both Andy S and current Govt. certifiably and irretrievably brain dead.
Andy is simply a mental Zombie. No matter how hopeless the AGW deniers stance is, once you are an AGW denier Zombie there seems to be no way back to the word of the living minds…..
Thanks.
I was merely seeking clarification of the points you were making, and the relevance of the February spike to these trends.
Your arguments are still not quite clear to me, but it is early and I am a brain dead zombie looking for my first coffee.
Maybe old dogs can learn new tricks? Here’s a shattering admission from Bryan Leyland in a recent email (emphasis mine):
The significance of this admission is that, since the last super El Nino in 1998, Bryan and his denier ilk have been braying that “global warming stopped in 1998!”.
No doubt they will start up again next year.
According to this graph, the spike is only seen in NH temperature series
https://bobtisdale.files.wordpress.com/2016/03/figure-8.png
Same as in the NASA data, Andy:
http://data.giss.nasa.gov/gistemp/graphs_v3/Fig.A3.pdf
No surprises there, as the ratio of land to water in the Southern Hemisphere is approx. half of that in the Northern.
Rob
>”Same as in the NASA data”
Andy’s graph by Tisdale is Nasa GISTEMP LOTI data too except it is monthly to February 2016 inclusive. Your pdf is of annual means to 2015 inclusive i.e. it doesn’t include January and February 2016.
>”No surprises there, as the ratio of land to water in the Southern Hemisphere is approx. half of that in the Northern”
Look at your pdf of annual means in 1998. There was an even north – south distribution of heat-in-transit (heat transfer) from sea to space. This El Nino has been a predominantly NH phenomenon in terms of air temperature over land at surface. Not so in 1998, CRUTEM4 shows that.
🙄
“Angels”, “dancing”, “pin heads”.
“This El Nino has been a predominantly NH phenomenon in terms of air temperature over land at surface.”
Tell that to the Australians
BOM- 2015 5th warmest on record.
And neither of those graphs show any global warming trend /sarc
FYI andy last year Auckland’s average temp was 0.9 degrees about average.
Of course the spike in global temps has been influenced by an el nino event equivalent in strength to that of 1997-98. But please also note that the average global temperatures on this occasion are well in excessive of those reached in 1998. Surely that must tell you something?
Macro
>”And neither of those graphs show any global warming trend /sarc”
Don’t be fooled by the GMST illusion. Yes there is ocean warming (see OHC illusion below) but there is no accumulation in the troposphere, an El Nino proves that conclusively. What you are looking at in GMST is heat-in-transit (heat transfer) from ocean and land to space at any time (more on El Nino and OLR below). El Nino is simply an abrupt localized oceanic sub-surface COOLING process. It’s not atmospheric warming except transitory.
The illusion is the same in OHC. All you are seeing in the global metric over the ARGO era is Indian Ocean warming.
In terms of heat the troposphere is a bit player and simply a sea-to-space transfer medium. The ocean is by far the greatest heat sink that takes time to dissipate accumulated energy. Keven Trenberth’s rough range is that the ocean adds “10 – 100 years” to the system and there’s a body of literature on planetary thermal lag with characteristic ranges that fall mostly in Trenberth’s range but towards the shorter end..
As indicted by HadSST3 below, oceanic heat accumulation began 1910. That was not GHG-driven. It will take decades to dissipate the energy accumulated in the ocean. Now that the tropical input (the sun heats the ocean in the tropics) has peaked and reducing since around 2005 (PMOD), look for the secular trend in GMST, it’s a curve by SSA/EMD, to peak in the 2020s. MDV being the additional oscillatory component.
Trends? Are you assuming linear ENSO-neutral GMST from 1970 as per Grant Foster without recourse to signal analysis (e.g. SSA, EMD) or latitude split?
Take a look at this split:
HadCRU 5 yr mean: NH SST & NH LOT vs SH SST and SH LOT
http://woodfortrees.org/plot/hadsst3nh/mean:60/plot/hadsst3sh/mean:60/plot/hadcrut4nh/mean:60/plot/hadcrut4sh/mean:60
HadCRUT4 LOT is HadSST3 Ocean + CRUTEM4 Land. The 5 yr mean eliminates noise including ENSO. SH SST and SH LOT are in lockstep, not so in the NH. NH CRUTEM4 (Land) skews that entire HadCRU Global Mean Surface Temperature metric this century. Similar for GISTEMP LOTI.
SSA and EMD detect an inflection in GMST since 1970 that is more in keeping with the 5 yr mean latitude split that neglects NH land i.e. the minor component that skews the global metric. Foster’s anylyst-imposed linear trend in ENSO-neutral data since 1970 doesn’t “see” the inflexion.
What is the trajectory of ENSO-neutral data now since 2000? There’s no guarantee that it is linear from 1970 onwards is it, given the entire series and signal analysis of it?
BTW, the GCM model mean is already ENSO-neutral and MDV-neutral, therefore it must be compared to a similar GMST residual “spline” (nominally from Macias et al):
MDV-neutral spline in GMST: 1865 – 1895 – 1925 – 1955 – 1985 – 2015 – 2045
The model mean conforms to this spline up until 1955 after which it is far too warm at ENSO-neutral 2015.
Mann et al (2016) instead adjusted the model mean to compare to GISTEMP LOTI, finding an invalid match.
>”What you are looking at in GMST is heat-in-transit (heat transfer) from ocean and land to space at any time”
Much of that is horizontal along the equator to poles temperature gradient (EPTG) and fastest by far in the troposphere. Ocean heat is far greater but moves at snails pace:
Horizontal heat transfer this 2015/16 El Nino has been via NH rather than an even north – south distribution. Goes some way (but not all) to explaining the 2015 annual mean anomaly in GISTEMP LOTI by latitude:
GISTEMP LOTI 2015 annual mean anomaly by latitude
http://l2.yimg.com/bt/api/res/1.2/ABpZjd4AnHFp.4g2goHRfg–/YXBwaWQ9eW5ld3NfbGVnbztxPTg1/http://media.zenfs.com/en-US/homerun/mashable_science_572/bb88a1a459ed8b467290bac3540e39dd
And that’s just at the surface.
Again, should be:
GISTEMP LOTI [2016 Feruary] mean anomaly by latitude
>”What you are looking at in GMST is heat-in-transit (heat transfer) from ocean and land to space at any time”
Much of that along the equator to poles temperature gradient (EPTG):
Heat transport
http://www.climate.be/textbook/chapter2_node7_2.xml
Goes some way, but not all, to explaining the 2015 anomaly by latitude:
GISTEMP LOTI 2015 annual mean anomaly by latidude
http://l2.yimg.com/bt/api/res/1.2/ABpZjd4AnHFp.4g2goHRfg–/YXBwaWQ9eW5ld3NfbGVnbztxPTg1/http://media.zenfs.com/en-US/homerun/mashable_science_572/bb88a1a459ed8b467290bac3540e39dd
Re El Nino OLR. In an El Nino OLR goes from normal to less than normal (tropical thunderstorm activity) to more than normal and back to normal again:
Outgoing Longwave Radiation (OLR) Anomalies In El Nino to La Nina years: analogs to 2015/16
http://fingfx.thomsonreuters.com/gfx/ce/1/592/592/olr_anom_analog_15-16_2.png
GHGs didn’t “trap” past El Nino heat (temps returned to neutral) so why should this one be any differeent? Or is this El Nino heat somehow different in that GHGs will trap the heat i.e. air temperature will remain elevated and will not return to neutral this time?
>”FYI andy last year Auckland’s average temp was 0.9 degrees about average.”
NIWA reports the NZ 2015 average was 27th warmest since 1909. BOM reports the AU 2015 average was 5th warmest on record. Africa 2nd – NOAA, Europe 2nd – KNMI, North America 2nd – NOAA. Argentina 2nd – NOAA.
The spike in 2015 (began October in GISTEMP LOTI) was relatively localized in Eurasia and NH Pacific Ocean and Arctic
2015 ranked #1 in Northern South America too I think.
At the risk of feeding the troll, Andy should be reading the latest posting from Skeptical Science:
http://www.skepticalscience.com/current-record-shattering-temps-shocking-to-climate-scientists.html
It’s not just a matter of a few thermometer readings, it’s the sum of all the changes that are occurring. Record droughts AND record high temps AND new heat records being set by increasing margins AND record loss of ice AND new records being set all over the world each year as trends continue upward AND a paucity of new low temp records, etc etc.
Arrg!!! Just when a decent storm is arriving my solar rechargeable weather station batteries give out. It’s just a bit too dangerous up there to replace them. Weather records? Phah!
Were the batteries receiving enough solar? They could be Ok.
It’s cloudy and murky in BoP, SSR must be minimal right now.
Little SSR indeed but they will normally outlast three days of overcast and rain. Nominally they have another year of life not counting shelf life in factory and store.
Batteries confirmed in excellent health. Damn!
@ Richard
Sorry I’m not going to be responding to your nonsense and cherry picking of data above, other than to this final comment. You obviously have no concept of statistical analysis other than its abuse by yourself and others of like mind.
You believe what you want – but don’t think that you convince anyone else with your twisting of evidence to suit your contorted world view.
The facts of disappearing glaciers and ice sheets, increasing extreme weather events, rising sea levels and increasing global temperatures speak for themselves.
Go and preach to the misguided believers in your church of denial and stop wasting space here.
Does cherry picking and abuse of statistics include the discussion of a single month’s temperature anomalies?
It you who choose to think that andy – for others the time series is quite understandable.
The spike is certainly an outlier and warrants further investigation. The temperature anomaly seems well correlated with latitude in the Northern Hemisphere. (Richard C posted a graph of this elsewhere)
What meteorological phenomenon caused this and whether it has any anthropogenic influence seems unclear to me.
>”The temperature anomaly seems well correlated with latitude in the Northern Hemisphere. (Richard C posted a graph of this elsewhere)”
GISTEMP LOTI 2015 annual mean anomaly by latitude
http://l2.yimg.com/bt/api/res/1.2/ABpZjd4AnHFp.4g2goHRfg–/YXBwaWQ9eW5ld3NfbGVnbztxPTg1/http://media.zenfs.com/en-US/homerun/mashable_science_572/bb88a1a459ed8b467290bac3540e39dd
Thanks for reposting that RC. It is quite an interesting correlation I’m sure you agree
Should be:
GISTEMP LOTI [February 2016] mean anomaly by latitude
The “spike” is expected – the same thing has been observed during other strong El Niño events. That it’s stronger in the NH than the south is also expected for the reason given by Rob Taylor above. It’s not a meteorological (synoptic) phenomenon, it’s climatic because it’s a property of the whole system (ocean/land/atmosphere). The anthropogenic influence is clear because this “spike” is much bigger than 1998’s.
March is running very hot too. ENSO will have to swing into a doozy of La Niña to stop this year’s global average temp topping last year.
>”That it’s stronger in the NH than the south is also expected for the reason given by Rob Taylor above.”
Then why not expect the same in 1998?
The 1998 SST spike was evenly distributed north – south:
http://woodfortrees.org/plot/hadsst3nh/from:1997/to:2000/plot/hadsst3sh/from:1997/to:2000
But the land surface metric detected almost no (apparent) response in the air over SH land:
http://woodfortrees.org/plot/crutem4vnh/from:1997/to:2000/plot/hadcrut4sh/from:1997/to:2000
That’s because there’s far more thermometers on say continental US than there is in the Pacific, especially south Pacific.
The 2015 SST spike was NOT evenly distributed north – south:
http://woodfortrees.org/plot/hadsst3nh/from:2014/plot/hadsst3sh/from:2014
No spike at all in SH SST. This El Nino a NH-only phenomenon.
If this El Nino had been evenly distributed north – south as in 1998 instead of just north, there would still have been a spike but only about half as much i.e. a similar globally averaged spike to 1998.
This El Nino, ALL of the heat release is in the NH which skews the globally averaged metric. It’s the same in any global climate metric averaged like GMST e.g. OHC:
https://www.nodc.noaa.gov/OC5/3M_HEAT_CONTENT/heat_content55-07.png
Do a basin-by-basin analysis of ARGO-era data and turns out all you are effectively looking at is the Indian Ocean:
https://bobtisdale.files.wordpress.com/2013/03/19-argo-era-ohc-atl-ind-pac.png?w=640&h=415
Pacific and Atlantic both cooling. Don’t be fooled by the global average illusion.
>”What meteorological phenomenon caused this and whether it has any anthropogenic influence seems unclear to me.”
Combination of factors to my mind – El Nino, AO, AMO, whatever.
But the factor most relevant to El Nino is the equator to poles temperature gradient (EPTG) and horizontal heat transport. I’m reluctant to post the UCL link but just search: 2.1.5.2 Heat transport and select the UCL link.
I’ve tried submitting the link twice but both comments went to the spam trap or somewhere. I’ll post the link in a following comment. If it doesn’t appear just do the search yourself.
Since this El Nino’s heat is moving through the NH troposphere, as measured at surface anyway, it stands to reason that NH tropical and sub-tropical heat is moving towards the north pole. NCEP reanalysis of the entire troposphere might show otherwise of course.
2.1.5.2 Heat transport
http://www.climate.be/textbook/chapter2_node7_2.xml
Link didn’t appear but here’s the graph and caption from the page:
Figure 2.17: The required total (RT) heat transport in PW (1015 W), needed to balance the net radiation imbalance at the top of the atmosphere (in black) and the repartition of this transport in oceanic (blue) and atmospheric (red) contributions, accompanied with the associated uncertainty range (shaded). A positive value of the transport on the x axis corresponds to a northward transport. Figure from Fasullo and Trenberth (2008). Copyright 2008 American Meteorological Society (AMS).
http://www.climate.be/textbook/images/image(15).png
Andy
>”The spike is certainly an outlier and warrants further investigation.”
it’s not temperature point samples that reveal whether this El Nino is any larger than 1998, it’s the total quantity of heat. Here’s 2 articles on this I selected randomly, I don’t know if it is accurate or not:
*********************************************
3. ………. To answer this question we need to consider how much heat change is involved in climate oscillations such as El Niño.
The increase in SST during January through July 1997, averaged over the equatorial Pacific (10S-10N, 150E-75W) was about 1.62°C.
But the quantity we need is heat content, which proportional to the mass of water times its temperature. This can be estimated from the TAO buoy array, by multiplying the density of water (1030 kg/m3) times the heat capacity of seawater (4000 J/kg/K) times the area of the TAO array times the vertical integral of buoy temperature with depth. (see the note on units and symbols below) (The area was estimated by dividing the array into regions each assumed to be represented by one buoy. Each day, the above calculation was made summing over the area of only those buoys with data for that day). Performing this calculation with TAO temperatures, the time series of heat content in the upper 500m shows that this quantity increased by about 3.5e22 J (“3.5 times ten to the twenty-second Joules”) during July 1996 through March 1997, then decreased slightly. (See also other related calculations).
http://faculty.washington.edu/kessler/occasionally-asked-questions.html
And,
Precursor? ARGO Measured Data Show Record Breaking Indo Pacific Subsurface Cooling Underway!
The global temperature in February announced by GISS was 1.35 °C above the average from 1951 to 1980. This is an impressive record, 0.8 ° C (!) warmer than in February 2014. What is behind such a large jump in a relatively short time? One of the reasons is of course the current El Nino. Another element is the Indo-Pacific Warm Pool (IPWP). It extends from 90° East to 180° East and 20° South to 20° North:
Fig. 5: The IPWP (turquoise highlighted). Source: “Google Earth”
This sea area receives heated water of the tropical Pacific from South / Central America, driven by the trade winds under neutral conditions of ENSO (El Nino Southern Oscillation) and during La Nina situations. We explained it here in more detail. Largescale, the globally highest ocean temperatures occur in this IPWP area, about 28.5°C. The heat that comes from the entire tropical Pacific is stored down to 500m water depth. The following figure shows how temperatures in this depth range developed since 2004:
Fig. 6: The vertical temperature distribution of IPWP (dbar = m water depth). Figure base on “Argo Global Marine Atlas”.
https://wattsupwiththat.files.wordpress.com/2016/03/clip_image0102.jpg
Clearly recognizable: Small El Nino 2004/2005 (blue = cooler), the La Nina 2008 caused a warming of IPWP, the El Nino 2009/2010 cooled, the La Nina 2011-2012 brought back the heat. Since 2014 a marked cooling occurs over the entire depth interval. For the discussion of the current global heat pulse, we concentrate on the period after January 2013.
Fig. 7: The temperatures of IPWP to 500m water depth (blue) since 2013, and the history of global temperatures (GISS, red) respectively to December 2015. (Data: GISS, Argo) [prior to spike in December]
The average temperature of the IPWP has decreased by about 1°C since spring of 2013. Since the beginning of the Argo measurements in 2004, it has never been cooler than today. Note that this refers to a huge water mass of about 16 million cubic kilometers. For comparison: The energy that has been released from here corresponds to the amount that the whole earth receives from the sun by the solar radiation flux during a 4 days period. This huge amount of energy increases the global surface temperature which leads to increased radiation of a good part of the heat into space. An El Nino in the end therefore generates a heat loss of the system earth
http://notrickszone.com/2016/03/15/precursor-argo-measured-data-show-record-breaking-indo-pacific-subsurface-cooling-underway/#sthash.h0jYSyJg.AfELZp5c.dpbs
Seperately
Fig. 6: The vertical temperature distribution of IPWP (dbar = m water depth). Figure base on “Argo Global Marine Atlas”. [to Oct 2015]
https://wattsupwiththat.files.wordpress.com/2016/03/clip_image0102.jpg
Figure 7: The temperature curve of the IPWP down to 500 m depth (blue) since 2013 and the GISS global temperature (red) until December 2015. (Data source: GISS, Argo).
http://kaltesonne.de/wp-content/uploads/2016/03/ben7.png
Better Fig 6 from NTZ (ignore WUWT link)
http://kaltesonne.de/wp-content/uploads/2016/03/ben6.jpg
Richard: You’ve been warned before about your habit of posting impenetrably long comments, often peppered with links to µWatts or worse. Please make your comments short and to the point, or I’ll be forced to snip them. If you can’t make your points intelligible, then post them at Treadgold’s emporium. At least there, everybody will be on the same page…
Richardcfromnz, I have no clue what you are talking about in any of your posts. Its just nonsensical, denialist drivel.
If the heating is mainly in the northern hemisphere that’s where it is. The fact that is northern on this occasion doesn’t invalidate any global average.The arctic is warming more than the Antarctic, but are you seriously suggesting we leave the arctic out of the global average?
You don’t give one single compelling explanation why its northern, just a grab bag of anything including the kitchen sink. Go away.
>”You don’t give one single compelling explanation why its northern”
Was this graph not sufficient?
http://woodfortrees.org/plot/hadsst3nh/from:2014/plot/hadsst3sh/from:2014
Richard. A temperature graph is not an explanation! Nobody is disputing this el nino is mainly northern.
Can you at least please keep your utter pseudo scientific drivel short? At least Andy keeps it short, and vaguely comprehensible.
nigelj says:
>”Richard. A temperature graph is not an explanation!”
It is if it’s a north – south split of SST as I’ve presented (following Andy’s lead LOT graph). The explanation is simple. This El Nino is/was, firstly, a heat release from NH Pacific only. That’s shown by 2 NH SST spikes (yes 2, not unprecedented) that do not occur in the SH. Similarly with the air response.
Then it’s just a matter of comparing to 1998. 1998 was distributed evenly north – south.
Obviously, if there was the same quantity of heat released in 2015/16 as 1998 (yet to be determined), the 2016 GMST spike will be twice as great after global averaging i.e. concentrated NH heat skews the global metric. It’s the same in any global metric e.g. GMST (NH skew), OHC (Indian Ocean skew), satellite SLR (IPWP skew).
But there’s more to this NH spike than just El Nino because it’s more than 2x 1998 (I think). Certainly the high NH latitudes are way high in February. No I don’t have an explanation for this except my previous “Combination of factors to my mind – El Nino, AO, AMO, whatever” statement.
I’m sure some climate scientist(s) will get NSF funding to study all this after which we can all read the report.
>”Nobody is disputing this el nino is mainly northern.”
Huh? Kiwiiano is. Simon’s a bit vague and sarcastic as usual but seems to be with Kiwiiano.
But in response to Simon’s sarcastic “…lack of warmth in the southern hemisphere?” I can only repeat what I’ve already stated upthread, viz,:
As of February there is no SH spike in GISTEMP. That’s not to say there might be a blip in March but It seems unlikely to me.
It’s only NCEP re-analysis of the entire troposphere that can really show what heat originated in what location and was transported to wherever in the troposphere and over what time frame. Even this neglects radiation that went straight through the atmospheric “window” to space.
Should be:
That’s not to say there might [not] be a blip in March but It seems unlikely to me.
Also, from upthread (GISTEMP LOTI monthly):
andyS says: March 23, 2016 at 1:31 pm
According to this graph, the spike is only seen in NH temperature series
https://bobtisdale.files.wordpress.com/2016/03/figure-8.png
We don’t know why there is a temperature spike in the NH that correlates very strongly with latitude.
That in itself should pique some scientific interest.
Anyway, have a Happy Easter, Purim, or whatever you celebrate, as long as it involves alcohol and chocolate
Bugger, it seems that the logorrheic Richard Cummings has left his perch in the near-deserted Treadgold Swamp and flapped his leathery wings over to this site.
Expect long screeds of pseudo-scientific rant, enlivened by mention of fairy volcanoes under the sea…
Shouldn’t you be packing kiwifruit Richard?
Or has picking been delayed by the lack of warmth in the southern hemisphere?
Is there a lack of warmth in the SI? I must have missed that memo
I thought it must be the El Niño but apparently that’s a Northern Hemisphere only phenomenon.
>”…apparently [2015/16 El Nino]’s a Northern Hemisphere only phenomenon.”
According to NASA GISS and UKMO HadCRU data it is. You could try disputing their data with them Kiwiiano.
>”Shouldn’t you be packing kiwifruit Richard?”
Yes but not yet. I’ll be working on a NZ Compac sizer that’s being reconfigured to (optimistically) pack 1000 bins a shift but it’s behind schedule. It’s #3 of 3 in the biggest packing shed in SH that last year were packing 500 a shift each (400 people a shift total). 1 and 2 have started. #3 was highly automated incl 2 huge stacking robots and infrared grader (30 IR cameras per fruit – $400,000, top of range – 60 cameras). Automation was more trouble than what it was worth so it’s been ripped out except one robotic stacker, IR grader, and a strapper. 30 more labour units reqd.
I’m looking forward to seeing actual performance having worked an $5.4m French Maf Roda that was touted to pack 700 a shift but struggled to do 400. In other words, I’m more than a little sceptical of the 1000 bin projection, same with IPCC climate projections. Differnce is, we work to strict and daily reviewed performance budgets – target vs actual.
How often are the NZ MfE/NIWA temperature and sea level projections reviewed against actual Simon? Shouldn’t the model vs obs data be live on each respective website? It’s not as if it’s technologically difficult is it? NIWA has VCSN for temperature and there’s about 9 PSMSL tide guages around NZ for SLR. T&T explicitly neglected historical Wellington TG rate of rise in their report to WCC – how hard can it be? Click on the NOAA Tides and Currents interactive map or download the PSMSL data. Dr Jan Wright neglected to stipulate the IPCC’s projection baseline in her 2014 SLR report but T&T at least copied that in.
>”Or has picking been delayed by the lack of warmth in the southern hemisphere?”
No, picking has started. Cool enough to bring up brix levels.
While RichardC is taking one of his exhibitionistic ritual mud baths in his home brewed pseudoscientific mental manure, on the other side of the globe the Rockefeller’s are exiting from Exxon and are said to divest from Fossil fuel companies completely:
http://www.reuters.com/article/us-rockefeller-exxon-mobil-investments-idUSKCN0WP266
Wow!
from the link:
My bold. That’s a kick in the eye for Koch Bros.
[OT, snipped. GR]
Oh and by the way, when you “divest”, you are merely selling your stock to someone else.
Something comprehensible for a change and OT
Who has been looking at panasonic’s 8 kwh home battery? SolarCity (no relation of US SolarCity) are promoting it. Main points:
1. Guaranteed for 10 yrs at 80% charge. Shuts down at 14 years.
2. Includes an inverter and an indoor controller which can be programed.
3. 150 volts.
4. can be inserted into “any” existing system so no need to dump an existing inverter. Offline capability.
5. Current price (new product and incl. installation) $11,000 – other options available later in year.
That’s $786/yr. My e.imports last year were $573. I said too expensive. If this were a 4 person home the battery would be a clear saving.
Hi Noel, have a look at the new Enphase modular battery storage system. Enphase is also the make of the micro-inverters which are revolutionizing solar AC system installation.
https://enphase.com/en-us/products-and-services/storage/our-system
I think that Whatpowercrisis.co.nz who are selling the Enphase inverters will be selling the batteries too.
Richard, please explain this comment:
“Obviously, if there was the same quantity of heat released in 2015/16 as 1998 (yet to be determined), the 2016 GMST spike will be twice as great after global averaging i.e. concentrated NH heat skews the global metric. It’s the same in any global metric e.g. GMST (NH skew), OHC (Indian Ocean skew), satellite SLR (IPWP skew).”
Why would temperature distribution affect the mean?
Richard is in good company. Even G.W.Bush was allegedly confused about the “mean”. It was told that when he heard somewhere that half of the US population had a lower than average I.Q. he wondered how one could improve the situation and pointed the finger at the education department…. 😉
He could improve the situation by using median rather than mean.
If your distribution is asymmetric, then it is indeed possible that more or less than half the population sit below the mean level
Only median divides the population into two equal parts.
capoeiranick says: Richard, please explain this comment:
>”Why would temperature distribution affect the mean?”
That’s not what I said. Read carefully:
“…..if there was the same quantity of heat released in 2015/16 as 1998 (yet to be determined)”
A total quantity of heat (in Joules) passing thermometers in the dissipation process i.e. sampled by temperature (in Celcius), when evenly distributed either side of the equator (as it was in 1998), exhibited a spike in GMST of 1998 proportions.
If the same quantity of heat (yet to be determined) is concentrated in the NH this 2015/16 El Nino, the GMST spike would be 2x 1998 because there is only minimal SH detection (and that is in the SH tropics only) and the AREA OF AVERAGING is half as much when just NH than it is when NH+SH. But I didn’t say it was 2x did I?
I think it is greater than 2x but I really don’t know unless the total quantity of heat is determined. I’m inclined to think there have been other coincident factors in addition to just El Nino e.g. here’s an insurance report stating the NAO:
But is the AO another factor for example, or AMO?
Put another way, the NH El Nino heat is not “smeared” across the entire earth’s surface in GMST. It remains in the NH.
So lets say for 1998:
50 units of heat in 1 unit of area (NH)
50 units of heat in 1 unit of area (SH)
100 units of heat total. GMST spike equivalent to 50 units of heat.
And for 2015/16:
100 units of heat in 1 unit of area (NH)
0 units of heat in 1 unit of area (SH)
100 units of heat total. GMST spike equivalent to 100 units of heat.
Effectively, all you are looking at in GMST this El Nino is NH heat.
Don’t be fooled by “global” means because they are easily skewed by local anomalies. There are other examples but just OHC for example.
“Global” OHC is skewed by the Indian Ocean which exhibits considerable warming but the Pacific and Atlantic exhibit cooling i.e. a basin-by-basin analysis of “global” is required in order to know what basin is doing what and how does that effect the “global” metric.
“Global” metrics are meaningless, and illusory, unless there’s a breakdown of the constituent components.
Richard says
“Global” OHC is skewed by the Indian Ocean which exhibits considerable warming but the Pacific and Atlantic exhibit cooling ”
Can you provide a specific and clear internet link for this claim. Plus is this for about one year, or some longer time frame?
I thought most oceans were warming / increasing heat content as per the IPPC below.
https://www.ipcc.ch/publications_and_data/ar4/wg1/en/ch5s5-2-2.html
nigelj says:
>Richard says “Global” OHC is skewed by the Indian Ocean which exhibits considerable warming but the Pacific and Atlantic exhibit cooling ”
>”Can you provide a specific and clear internet link for this claim. Plus is this for about one year, or some longer time frame?”
Sure. It is over the ARGO era. The basin-by-basin data is here:
Basin time series of heat content
https://www.nodc.noaa.gov/OC5/3M_HEAT_CONTENT/basin_data.html
If you plot Pacific vs Atlantic vs Indian OHC you get this graph:
https://bobtisdale.files.wordpress.com/2013/03/19-argo-era-ohc-atl-ind-pac.png
>”I thought most oceans were warming / increasing heat content as per the IPPC below.”
Not according to NOAA basin data of OHC. It’s only the Indian that is warming in the ARGO era.
Hi Andy, do you agree with Richard’s analysis here or is he confused about one of the more trivial mathematical concepts?
Alternatively are you going to weasel out of providing any sensible demonstration of critical thinking?
Richard says:
“And for 2015/16:
100 units of heat in 1 unit of area (NH)
0 units of heat in 1 unit of area (SH)
100 units of heat total. GMST spike equivalent to 100 units of heat.”
It seems pretty clear to me that 100 units of heat / 2 units of area = 50 GMST spike.
>”It seems pretty clear to me that 100 units of heat / 2 units of area…..”
No, it’s 100 units of heat / 1 unit of area (NH) for 2015/16.
For 1998 it was 100 units of heat / 2 units of area (NH & SH).
By dividing by 2 in 2015/16 you are “smearing” NH heat over the SH too. Clearly (see GISTEMP NH & SH upthread) that has not occurred in this El Nino.
Alternatively are you going to weasel out of providing any sensible demonstration of critical thinking?
I don’t recall entering into any agreement to review yours or Richard C’ comments, so I will decline the invitation to engage with your line of questioning.
My comment was directed at Thomas who was making remarks that Richard C didn’t understand the concept of mean, by demonstrating a lack of understanding on his part.
Andy, you need to read up on the way that IQ scores are calculated before commenting on whether there is a difference or not between the median and the mean of IQ scores. IQ score tests are normalized and therefore, the Median and Mean are both 100 and equal! There is no difference between the two measures when talking about an IQ test by design! You will find reading about it interesting perhaps.
But in a general discussion on statistics you are quite right: the median and the mean can be different from each other and should not be confused. Unfortunately not only G.W.Bush has a lack of understanding of statistics but the majority of the population would be unable to tell you what the difference between Median and Mean is.
>”the GMST spike would be 2x 1998 because there is only minimal SH detection (and that is in the SH tropics only)”
What I mean by this is that GISTEMP LOTI data say, shows minimal detection of 2015/16 El Nino heat in the SH. Certainly no spike and barely a blip in the SH data relative to NH.
>”the AREA OF AVERAGING is half as much when just NH than it is when NH+SH”
Asymmetric vs Symmetric as Andy points out. From upthread, this is demonstrated by the February anomaly breakdown by latitude (Zonal Mean):
GISTEMP LOTI February 2016 mean anomaly by latitude
http://l2.yimg.com/bt/api/res/1.2/ABpZjd4AnHFp.4g2goHRfg–/YXBwaWQ9eW5ld3NfbGVnbztxPTg1/http://media.zenfs.com/en-US/homerun/mashable_science_572/bb88a1a459ed8b467290bac3540e39dd
But not only is the spike concentrated only in the NH, the NH mean is probably north of the 45N median in that graph. This is after accounting (by cosine) for decreasing Lat/Lon grid area towards the poles (as I understand in GISTEMP – could be wrong).
In other words, the higher latitudes may have skewed the NH mean too. How can that be just El Nino heat? Surely there must be another Arctic driver such as AO or NAO (as per insurance report above) that has no other effect anywhere else south.
Or it could just be Lat/Lon grid area weighting that is introducing another skew.
Richard you are seriously befuddled. Why would the area of averaging for a global mean be different in 1998 and 2016?
>”Why would the area of averaging for a global mean be different in 1998 and 2016?”
You’re mixing two separate concepts – my total El Nino heat analogy and calculation of global mean temperature. Two distinctions to make for clarification. 1) Total El Nino heat release and over what area respectively, 1998 vs 2015/16 (my assumption of 100 units). 2) Calculation of a global temperature mean.
1) For my assumption and analogy of equal 100 units of heat 1998 and 2015/16, the area in which the heat release occurred was totally different for each – that should be obvious from the graphs upthread applicable to to each phenomenon (see HadSST3 NH & SH for 1998 and 2015/16 respectively). It is also indicative in the 2016 February temperature anomaly by latitude – see 2) below.
In 1998 the heat release was evenly distributed north – south so 100 units of heat / 2 = 50 units in each hemisphere.
In 2015/16 the heat release was only in the NH causing a NH-only temperature spike so 100 units of heat / 1. = 100 units in the northern hemisphere only. You cannot “smear” that NH heat over the SH by dividing by 2. 100 units in the NH then becomes the effective NH + SH heat total because SH = 0 in 2016 (near enough).
The area of averaging is different in 1998 and 2016 for total heat in this analogy and assumption. In 2016 100 units of heat is averaged over the NH, o units of heat is averaged over the SH. There is no more averaging to be done in this case.
2) Global Mean Surface Temperature can be thought of as the mean of all latitudinal means to see where the heat went. The February 2016 mean temperature by latitude is indicative of WHERE the heat was being dissipated (from upthread):
GISTEMP LOTI February 2016 mean anomaly by latitude
http://l2.yimg.com/bt/api/res/1.2/ABpZjd4AnHFp.4g2goHRfg–/YXBwaWQ9eW5ld3NfbGVnbztxPTg1/http://media.zenfs.com/en-US/homerun/mashable_science_572/bb88a1a459ed8b467290bac3540e39dd
Feb 2016 heat dissipation is in the higher northern latitudes along the Equator to Poles Temperature Gradient (EPTG) but obviously that profile begs questions as to other factors than just El Nino because El Nino heat transport would not necessarily be along the surface. There must be other oceanic factor(s) to support surface heat in the high latitudes.
Each latitudinal band (“zone”) is a mean of all grid cells on that latitude. The global mean is the mean of all latitudinal means when viewed this way.
The area of averaging is the same in 1998 and 2016 for calculation of global mean surface temperature.
But note the Lat/Lon grid cells decrease in area towards the poles i.e. a polar cell does not have the same weighting as a cell near the equator in GMST because it does not have the same area. Same with each respective latitudinal band of cells making up latitudinal means from which the global mean is calculated.
Similarly with thermometer sampling. Continental USA has high density sampling, large areas of the Arctic have no sampling at all.
Goodness Richard, do tell us what do you mean by “the NH mean is probably north of the 45N median….”… arghhh…. Might it be that you got the word Meridian mixed up with the word Latitude and muddled into the concepts of averages in statistics…..
Also do you think a square meter of area where the Reindeer roam is somehow smaller (by some cosine rule of yours…) than a square meter at the tropics?
Perhaps Dr. Don Key knows the answer… 😉
>Richard, do tell us what do you mean by “the NH mean is probably north of the 45N median….”
Sure. 45N divides 0 – 90N in half i.e. 45N is the median latitude of that range (but it is NOT half of the NH by area).
The NH temperature anomaly mean does not occur (by eye) on the median latitude, it’s north of it. In other words, there’s an asymmetric distribution “skew” of the temperature mean so that it occurs north of the 45N latitudinal median.
This illustrates why looking at a global mean without recourse to a distribution breakdown is illusory.
So what you are trying to say is that the Arctic is heating up faster than the equatorial regions. Yes we know that. It is called polar amplification and it is a direct result of AGW. (a nice simple explanation for you).
>”So what you are trying to say is that the Arctic is heating up faster than the equatorial regions.”
No I didn’t say that or imply it. You’ve made this up.
A NH February spike is NOT “global” neither is it long-term “warming”. It is ENSO noise, not signal in respect to GMST. The signal is ENSO-neutal temperatures in GMST (also MDV-neutral but ‘nuther story – IPCC AR5 admits this was neglected).
5 year smoothing by low pass filter (e.g. running 5 yr average) eliminates ENSO noise from GMST. Therefore, we have to wait for the end of the entire El Nino/La Nina process to determine ENSO-neutral temperature, maybe sometime around 2018.
ENSO-neutral/MDV-neutral temperature in GMST is a critical, but secondary, metric for the man-made climate change conjecture. If around 2018 – 2020 there is no radical ENSO-neutral warming in GMST i.e. ENSO-neutral observations way out of CO2-forced model range as they already are, the conjecture is falsified in surface temperature. In other words, 2018 – 2010 ENSO-neutral temperature is the acid test for the man-made climate change conjecture, it’s make or break.
The IPCC’s primary, and critical, climate change metric is the earth’s energy balance “measured at top of atmosphere (TOA)” because the balance/imbalance “controls” surface temperature according to IPCC FAQs.
The man-made climate change conjecture is already falsified by the IPCC’s own theoretical values (Chap 9, and df = 5.35ln(C/Co) ) vs atmospheric observations (Chap 2):
1.9 W.m-2 – theoretical CO2 forcing at TOA 2015.
0.6 W.m-2 – actual TOA imbalance 2000 – 2010 (no trend)
Theory is 3x actual. Net anthro theoretical forcing (2.4+ W.m-2) is even worse (4x actual). The IPCC did not address this critical disparity in Chap 10 Detection and Attribution. Was that:
A) Sloppy incompetence, or
B) Willful negligence?
Should be:
“In other words, 2018 – [2020] ENSO-neutral temperature is the acid test for the man-made climate change conjecture, it’s make or break.
>”…..the Arctic is heating up faster than the equatorial regions”
You might also consider AO, AMO, and NAO.
Rural non-UHI contaminated Arctic staions i.e. “isolated”, just track the AMO, see:
‘A Light In Siberia’
http://notrickszone.com/2010/09/21/a-light-in-siberia/
Particularly this graph:
AMO versus isolated stations.
http://notrickszone.com/wp-content/uploads/2010/09/AMO-and-Isolated-Stations.jpg
In other words, the oceanic oscillation controls Arctic surface temperature.
OMG Richard you need to be on the IPCC!
I’m sure they would be fascinated with your new insights into Thermal Dynamics and their implications for Climate Change. perhaps you could write a paper and have it published in a scientific Journal. I hear the Journal of the Economic Society of Australia (Queensland) is looking a such a paper after the sad demise of Bob Carter. Maybe you could even trump his achievement
I’m sure such a paper would really make those Fellows of the Royal Society et al sit up and take notice.
Macro says:
>”OMG Richard you need to be on the IPCC!”
Why? The IPCC puts its reports in the public domain for anyone to read. That’s what I’ve done and I’m not the only one to notice the IPCC’s theory is not conforming to observations in their primary climate change metric.
I notice you don’t dispute my rationale, viz.:
AR5 Chap 2 cites Stephens et al (2012) and Loeb et al (2012) for observations. The former was featured at JoNova so there’s plenty of familiarity with that paper.
Given the IPCC didn’t address the issue, I’m wondering what your explanation for the disparity is Macro?
>”Also do you think a square meter of area where the Reindeer roam is somehow smaller (by some cosine rule of yours…) than a square meter at the tropics?”
Where did I state that Thomas? I didn’t did I? You made this up. It is the Lat/Lon grid cells that decrease in area going from equator to poles.
This is how it works:
If say, the globe is a 6 x 12 grid consisting of 72 cells measuring 30 degrees latitude times 30 degrees longitude. Because degrees longitude are shorter closer to the poles, the grid cells are also smaller. The relative length of one degree longitude, is cosinus of the degree latitude at the same spot. The weight of each grid cell is therefore the absolute value of cosinus of the degree latitude in the middle of the cell.
Lat/Long is just a location identifier. A m² in the Arctic is the same area as a m² anywhere on the planet. Any spatial interpolation would use an accurate global projection representation. WGS84 works well, most GPS systems use it.
“5 year smoothing by low pass filter (e.g. running 5 yr average) eliminates ENSO noise from GMST.”
What a load of codswallop. ENSO doesn’t follow five year cycles.
SimonP says:
>”Lat/Long is just a location identifier.”
Yes, a grid cell defined by borders of lattitude and longitude. But the area of a polar grid cell is NOT the same area as a tropical gril cell.
>”A m² in the Arctic is the same area as a m² anywhere on the planet.”
I’ve never stated otherwise. I challenge you to quote where I do if that’s what you think.
>”Any spatial interpolation would use an accurate global projection representation. WGS84 works well, most GPS systems use it.”
Exactly, but fact remains that Arctic grid cells are smaller in area than tropical grid cells.
>“5 year smoothing by low pass filter (e.g. running 5 yr average) eliminates ENSO noise from GMST.” What a load of codswallop. ENSO doesn’t follow five year cycles.
Again, I’ve not stated that ENSO follows 5 yr cycles. I challenge you to quote where I do if that’s what you think.
But I’m curious Simon. Do you consider ENSO fluctuations in GMST to be signal or noise?
SimonP says:
>”Lat/Long is just a location identifier.”
My statement was this:
I did NOT state “Lat/Long” in isolation as you selectively state. My element is: “Lat/Lon grid cells”.
There is a huge difference in those elements – yours vs mine. Yours is a point location, mine is an area.
Nobody uses Lat/Long grid cells in deriving an estimation of surface temperature.
Your statement “5 year smoothing by low pass filter (e.g. running 5 yr average) eliminates ENSO noise from GMST.” is absolute rubbish. I have no idea where you got that from but I suspect it is a copy/paste from some crank science website.
It is very difficult to comprehend climate science if you have a complete misunderstanding of the basics. Your posts are a textbook example of the Dunning-Kruger effect in action.
SimonP says:
>”Nobody uses Lat/Long grid cells in deriving an estimation of surface temperature.”
Correct. But how is temperature data presented spacially?
NASA GISS:
Go over to JoNova’s ‘Met Bureau Bingo’ and read about one shonkey station (Walungurru) determining anomalously hot temperature in the middle of Australia even though a quality station “nearby” (Giles) is the only staffed weather station within an area of about 2,500,000 square kilometres and does not exhibit the same hot anomaly.
>”I have no idea where you got that [5 yr smoothing] from……”
5 yr smoothing is ubiquitous in climate data Simon. Take a look at NODC 0 – 700m OHC:
https://www.nodc.noaa.gov/OC5/3M_HEAT_CONTENT/heat_content55-07.png
What do you suppose “Pentadal average” means?
Or mid-troposphere climate models vs observations:
https://cei.org/sites/default/files/styles/large/public/Figure%201.JPG?itok=Rtgz7VOb
What do you suppose “5-year averages” means if not 5 yr smoothing?
I repeat because you didn’t venture an opinion in reply:
I’m curious Simon. Do you consider ENSO fluctuations in GMST to be signal or noise?
BTW, it’s not all El Nino spike in the NH:
‘HADCET March 2016 Mean Temperature – Tied For 143rd Warmest out of 355’
http://sunshinehours.net/2016/04/02/hadcet-march-2016-mean-temperature-tied-for-143rd-warmest-out-of-355/
SimonP says: >”Nobody uses Lat/Long grid cells in deriving an estimation of surface temperature.” Correct.
On reflection this is not correct. NASA GISS explains what they do in FAQs:
Missed a tag after the GISS link.
Richard: You have absolutely no idea about anything you are talking about.
Your incomprehensible ramblings:
….once more clearly show that you are simply throwing around “scienceny” sounding terminology with absolutely no understanding whatsoever of what you are dabbling with.
It is amusing maybe, sad more likely.
Thomas, El Nino heat is the total quantity of heat (in Joules) released by the ocean in each El Nino event. Upthread I posted a Washington Edu/NOAA quote and link to an article by Dr. William S. Kessler NOAA / PMEL / OCRD that starts to deal with this. Didn’t you read it?
The oceanic heat released (stated in Joules) is dissipated to space by radiation, evaporation, and conduction from the surface and ultimately all by radiation to space (OLR).
Therefore, the heat “passes” surface thermometers where it is point sampled by the thermometers (stated and measured in Celsius). Once the oceanic El Nino heat release is over, the thermometers no longer detect any “passing” heat, the heat has gone to space and surface temperatures revert to ENSO-neutral again.
Fot the respective north – south distribution of heat, 1998 vs 2015/16, you can review the graphs upthread (e.g. HadSST3 NH & SH for 1998 and 2015/16. They should be self explanatory.
Richard, your misconceptions all over the place are simply too many really to deal with in total. But let’s just look at one of them here as an example and for the last time:
Misconception: “In an El Nino the ocean releases heat”.
If that was generally true then the Ocean should cool as a result in El Nino years. That is not necessarily so at all! In fact if you check with the ocean heat content time series, you will not find a decernible dip in ocean heat content in El Nino years such as 1998 for example.
Here is why this is so: Normally Ocean temperatures, in particular in the tropical regions in the Eastern Pacific where the El Nino effect is most notable in form of ocean surface temps, are cooler than the air. These cooler oceans moderate atmospheric warming. All up, the oceans work a bit like a cooling system for the Earth temperatures, especially for the tropics. In an El Nino year, ocean temperatures in parts of the oceans are a degree or two warmer than in other years, but may still be below air temperatures in these regions. However, the warmer water has a number effects on the air temps: It reduces the heat flow into the oceans – thereby leaving the air warmer than it would normally be – and also, and that is a significant effect, the warmer ocean causes in increase in evaporation and that will result in an increase in the H2O GW forcing as well as release additional latent heat of condensation into the atmosphere where clouds are forming. The later also increases the severity of storms.
So in El Nino years the world’s oceans may well continue to accumulate NET heat, while the atmosphere is seeing a warming spike due to the effects cited above. All considered, the heat content of the Earth system increases also in El Nino years.
Think of an El Nino year as a time when the cooling system of your car (the oceans in this analogy) is a bit less effective, leaving your car running a bit hotter. However, this does not mean that your cooling system suddenly becomes a net heating system for your car’s engine. Got it?
Now Richard, I do not have the time or the patience to teach you out of the plethora of misconceptions and outright nonsense that seem to occupy your mind. It is my sensere advise though to stop pouring rubbish into the internet blog sites. It is unfortunate that the sciency sounding tosh you excreet impresses a few gullible minds here and there.
So I plead with you to simply stop your silly quest. Go and get a sound education in science. Perhaps enrol into a course on climate science.
>”Think of an El Nino year as…..”
I’d rather not Thomas, given NOAA / PMEL supports my statements but runs contrary to yours:
And (still PMEL),
I’ll leave you to dispute with PMEL Thomas, Dr. Kessler’s email address is at the bottom of the second link.
>”Go and get a sound education in science. Perhaps enrol into a course on climate science.”
What course do you recommend Thomas? Have you completed/passed this course? What climate scientists have this qualification?
An education in applied heat is not sufficient, including being examined on the laws of thermodynamics?
What laws are atmospheric physics based on if not those laws? Wratt has a PhD in Atmospheric Physics and Renwick a PhD in Atmospheric Sciences. What fundamental laws are those topics based on if not the laws of thermodynamics?
>”I do not have the time or the patience to teach you”
That’s a pity because I have a couple of questions for you:
1) Does the AGW/Man-made climate change conjecture conform to, or violate, the Clausius statement of the Second Law of Thermodynamics? How so either way?
2) Do the IPCC climate models conform to, or violate, the Kelvin-Planck statement of the Second Law of Themodynamics? How so either way?
I look forward to being educated if you can spare a few minutes Thomas.
IPCC Lead Author Chapter 10: Detection and Attribution:
Krishna Mirle AchutaRao (India),
M.Engg Mechanical Engineering
B. Engg (Hons) Mechanical Engineering
M. Sc (Hons) Mathematics
http://web.iitd.ac.in/~akrishna/biosketch.html
Ring in?
🙄
Ever heard of the Greenhouse Effect Richard?
and what Thomas says.
Macro says (in respect to El Nino heat dissipation):
>”Ever heard of the Greenhouse Effect Richard?”
I refer you to my challenge upthread that no-one has yet dared to reply too:
Go ahead Macro, be the first.
>”and what Thomas says.”
You’re ageeing with Thomas word-for-word Macro?
Even though what he says on El Nino runs contrary to NOAA / PMEL on El Nino?
That’s a very strange position to adopt.
🙄
A total quantity of heat passing thermometers! What the hell does that mean???
Gobbledegook!
The image of a Thermometer counting Joules as the fly by makes for an amusing sight indeed. Perhaps we need to make the bulb on Thermometers bigger then so that these pesky little Joules can’t slip by unnoticed…. 😉
If I wanted to collect a book of science misconceptions for teaching purposes, citing Richard C would offer a rich picking ground of some of worst jumbo-mumbo indeed.
The sad thing is that the likes of Andy and Richard T. can’t tell the difference between Richard C.’s deluded ramblings and the combined weight of decades of peer reviewed science. When he pisses on their legs and tells them is raining they look around for umbrellas.
The sad thing is that the likes of Andy and…
You don’t need to feel sorry for me. I do. however, wonder how you come to the conclusion.
Speaking of peer-reviewed science, I went to a public meeting last night to assist with the new peer review of our coastal hazards report, yes yet another one.
The problem doesn’t go away, it seems
So enlighten us, is Richard talking rubbish or do you agree with him?
Unless of course you can’t tell the difference between rational analysis and Dunning-Kruger fueled ravings. In that case I’m sure you’ll just find some weasel way to avoid answering.
Andy in order to Peer Review anything you would need to qualify as a Peer and be respected as such by the Peers whose work you review and by those in charge of overseeing the process of such a review!
What do you think makes you qualified as a Peer Reviewer of a coastal hazard management plan?
Your public resume as a serial science denier, word-weasel and fact twister makes you non-such in the eyes of any person with a sound mind!
Btw did you update your coastal management plan review after digesting the latest warnings from the science community, for example Hansen et.al., over the strong possibility of a much faster SLR than assumed by the IPCC reports? Or did you weasel around inconvenient messages from the science community as usual?
In response to Thomas’s concerns about my involvement in peer review, let’s be clear: I am not doing any peer review, because, as you say, I don’t have any qualifications or expertise in the subject matter to do so.
I merely attended a public meeting hosted by GHD, a consultancy company charged with the task of forming a peer review panel from a group of national and international experts in coastal hazards, sea level rise, RMA law, statistics, economics, etc.
I also spend 2 days at the Independent Hearings Panel in Christchurch where I presented and listened to submissions, and asked questions of expert witnesses (all at my own expense, I might add, like all of the public)
These proceedings are all transcripted online should you wish to allay your fears that people are being misled.
In terms of Hansen’s report, etc, this is not how the process works. Councils take their briefs from higher order documents, in particular the NZCPS 2010 (NZ Coastal Policy Statement) and the CRPS (Canterbury Regional Policy Statement)
Generally, this is all that happens. We don’t discuss science or “new findings”. It’s all policy
>”A total quantity of heat passing thermometers! What the hell does that mean???”
See my reply to Thomas re the same quote with explanation here:
http://hot-topic.co.nz/februarys-global-temperature-spike-is-a-wake-up-call/#comment-47459
Macro
>”A total quantity of heat [in Joules] passing thermometers! What the hell does that mean???”
Applied to El Nino.
A transfer of heat Q from ocean to troposphere is detected by surface thermometers as a spike in temperature T i.e. ΔT of troposphere positive. Q of troposphere positive.
The heat transferred to the troposphere is then in the process of dissipation to space in accordance with the Kelvin-Planck statement of the Second Law of Thermodynamics i.e. heat transfer Q from troposphere to space, Q of troposphere negative, ΔT of troposphere negative.
Good, you’ve looked up the 2nd Law of Thermodynamics. You understand now thermometers do not measure Heat, and your previous statement was mere gobbledegook.
So enlighten us, is Richard talking rubbish or do you agree with him?
I haven’t been following the details of the argument, so I can’t comment. I was just picking up on some high level remarks about means and medians.
Funny, you never let lack of understanding stop you from commenting in the past. I didn’t realise the details of calculating a simple mean were beyond your ability to follow.
Funny, you never let lack of understanding stop you from commenting in the past. I didn’t realise the details of calculating a simple mean were beyond your ability to follow.
I am perfectly capable of calculating a mean. Why do you think otherwise?
Since all your remarks aimed at me are dripping with sarcasm, why do you think I have any interest whatsoever in engaging into a discussion with you?
Did anyone watch that rather good documentary on climate change last night on TV3? It took a rather good historical look at climate science and climate change.
The thing that stands out is of course the longer term warming trend since about 1900, that at least approximately correlates with increasing CO2.
Of course this warming trend is obvious to most people, regardless of el ninos sometimes being concentrated in one hemisphere. The warming trend doesn’t care if events like el nino are variable in nature or location. Or if only part of the oceans are warming at any one times. or if the arctic is warming more than the antarctic.
The longer term global warming trend just continues on anyway.
RICHARD do you comprehend this? No of course you don’t. Thomas is far too kind to you!
By the way the arctic is warming for a combination of reasons including AGW. Your attempt to spin it as natural is just laughable.
>”……the longer term warming trend since about 1900, that at least approximately correlates with increasing CO2.”
1900? The CO2 uptick wasn’t until the 1950s. The IPCC’s anthro attribution period doesn’t even begin until 1951.
Unfortunately the IPCC reports in Chap 9 that they’ve neglected natural variation (e.g. MDV). Given their models are MDV-neutral they now have 2 big problems: models running too warm; and, not tracking MDV-neutral observation data.
The acid test is now on the IPCC. If there’s not some radical ENSO-neutral and MDV-neutral warming by 2020 their conjecture’s falsified at the surface at least.
RichardC spouts two “facts”. Unfortunately, like most AGW deniers he gets them wrong.
Wrong here are the CO2 data:
http://www1.gly.bris.ac.uk/BCOG/images/co2_conc.gif
Wrong, IPCC noted more than half of the observed increase in globally averaged temperatures since the mid-20th century is extremely likely (95%+ probability) due to human influence, notably the observed increase in anthropogenic greenhouse gas concentrations
http://www.world-nuclear.org/information-library/energy-and-the-environment/climate-change-the-science.aspx
Of course CO2 had an influence before mid 20th century.
The rest of his post is just unintelligible gobbledygook.
>”The rest of his post is just unintelligible gobbledygook.”
So can I assume that you are not aware that GMST has 2 components: a secular trend (ST); and, multidecadal variation (MDV) ?
There’s a body of signal analysis literature on this Ian. That’s if you’re willing to defer to it of course.
More gobbledygook. Do you deny that global temperature is rising at unprecedented rates? There is a long term trend and shorter term modulations. Do you accept that greenhouse gases are responsible for causing the long term increase?
>”There is a long term trend and shorter term modulations.”
Well done Ian – ST + MDV. The IPCC neglects MDV as they concede in Chap 9, you know more than they do. Their climate models are MDV-neutral so comparing the model mean directly to GMST is not apples=to=apples. The only valid comparison is to GMST minus the MDV signal. There’s a large divergence after 1955.
>”Do you accept that greenhouse gases are responsible for causing the long term increase?”
No, given the above and that the most recent GMST secular trend (ST) is now in negative inflexion, confounding signal analysts with a head full of IPCC attribution. It SHOULD be rising in concert with CO2 rise if CO2 is the driver. Obviously it can’t be. See for example:
Application of the singular spectrum analysis technique to study the recent hiatus on the global surface temperature record.
http://www.ncbi.nlm.nih.gov/pubmed/25208060
But more importantly, actually critical, the IPCC’s primary climate change criteria is NOT surface temperature (see IPCC FAQ – “What is radiative forcing?”), contrary to popular belief.
I’ve already presented this upthread but basically, theoretical CO2 forcing is ineffective at TOA where the IPCC implies it would act if it is actually the climate driver. The IPCC states the TOA energy imbalance “controls” surface temperature. Therefore, if CO2 doesn’t control the earth’s energy imbalance at TOA then it doesn’t control surface temperature either.
>”….theoretical CO2 forcing is ineffective at TOA where the IPCC implies it would act if it is actually the climate driver.”
Perhaps some clarification. The earth’s energy imbalance is “measured at top of atmosphere” by satellites i.e. if CO2 acts, it’s effect would be measured at TOA.
The actual action is posited to take place at top of troposphere. Just follow the IPCC’s hotlinks on this.
Basically the earth’s energy budget is solar radiation in (UV-A/B, Vis, IR-A/B) vs IR-C out at TOA.
>”The rest of his post is just unintelligible gobbledygook.”
>”More gobbledygook. ………There is a long term trend and shorter term modulations.”
You appear to have deciphered the “unintelligible gobbledygook” with ease Ian. Are you sure it was in fact “unintelligible” and “gobbledygook” ?
Richard.
“>”……the longer term warming trend since about 1900, that at least approximately correlates with increasing CO2.”
1900? The CO2 uptick wasn’t until the 1950s. The IPCC’s anthro attribution period doesn’t even begin until 1951.”
Richard I said the long term warming trend “approximately correlates” with CO2. With respect can’t you read?
In fact CO2 increases quite substantially from about 1900 to 1950 and then accelerates after 1950 as has been pointed out to you in various internet links.
Most of the warming before 1950 is put down to solar factors and about 20% to AGW. I dont know what the IPCC say, but most of the published literature says this.
The IPCC say most of the warming after about 1970 is AGW. The correlation with CO2 is also very obvious over this time period.
The point I’m making is this warming trend after 1970 has encompassed variability in el nino and its locations, and also variability in where the ocean is heating. So these factors are interesting but have had no direct bearing on the AGW caused warming trend which has just continued on.
“The acid test is now on the IPCC. If there’s not some radical ENSO-neutral and MDV-neutral warming by 2020 their conjecture’s falsified at the surface at least.”
With respect this is absolute nonsense. Its based on the assumption that the high temperatures of 2015 – 2016 are entirely caused by el nino. A quick google shows climate scientists like Mann are saying a very large proportion of current warming is AGW and part is el nino. I have no reason to doubt these people.
http://www.bbc.com/news/science-environment-35354579
If you believe otherwise publish your theory whatever it is. However having read your posts I doubt you would get past peer review. People would laugh.
>”Most of the warming before 1950 is put down to solar factors and about 20% to AGW.”
OK, progress. But nothing re MDV? The IPCC admits it neglects MDV which was max positive in 1940 and 2000. Don’t you think then that there’s been some miss-attribution?
Again, it is the MDV-neutral “spline” in GMST that is the only valid apples-to-apples comparison with CO2-forced models because the models are MDV-neutral. The models track the spline up until 1955 after they diverge too warm when CO2 forcing kicks in. The IPCC admit in Chap 9 that one of the reasons the models are not tracking 21st century temperature is incorrect CO2 sensitivity (the others being neglect of natural variation and volcanism).
>“The acid test is now on the IPCC. If there’s not some radical ENSO-neutral and MDV-neutral warming by 2020 their conjecture’s falsified at the surface at least.” With respect this is absolute nonsense. Its based on the assumption that the high temperatures of 2015 – 2016 are entirely caused by el nino
Read again Nigel, “ENSO-neutral” in particular. We have to wait for the entire El Nino-La Nina sequence to play out before ENSO-neutral temperature can be determined. This is the “acid test” at surface. AGW theory having already failed the acid test at TOA. If ENSO-neutral and MDV-neutral GMST is not up in the model range by 2020, AGW is busted on both counts.
The El Nino spike took GMST into the model range but it will drop out again when temperature returns to ENSO-neutral conditions, As time is progressing, the divergence between ENSO-neutral GMST and the models is growing ever larger and becoming an ever larger problem for the IPCC. They’ve only just started to tackle this in Chap 9 ‘Evaluating Climate Models’. They’ve been the last to “see” the natural variation issue. AGW sceptics have known about it for yonks and have said so vociferously. The IPCC finally conceded in AR5.
>” A quick google shows climate scientists like Mann are saying a very large proportion of current warming is AGW and part is el nino. I have no reason to doubt these people.”
Isn’t it a bit early to dispense with objectivity? Yes, several climate scientists have come out with some statements that are very impressive in regard to accuracy. Gavin Schmidt is on record as saying the 2015 annual mean was 0.07C El Nino (think about this). Similarly with Rahmstorf (Feb 2016 “more than 80%” AGW), Sherwood, and Foster.
But Foster and Rahmstorf (2011), which was cited in AR5 Chap 10: Detection and Attribution, was subsequently wrong with the addition of new data. Foster now has a new “model” to cover up.
It will be the new data coming in over the next 3 – 4 years that will show whether the El Nino/AGW attribution by all these scientists had any validity or not. Time will tell on this, it’s too early to pronounce validity at this stage.
We’ll have to wait and see but i think those climate scientists have set themselves up for considerable embarrassment.
Should be:
“(the others being neglect of natural variation and volcanism [and solar change]).’
>”The models track the spline up until 1955 after they diverge too warm when CO2 forcing kicks in.”
I’m alluding to the model mean here but that is not to say the model mean is worth consideration except to demonstrate that the models are generally junk. The IPCC concedes that 111 of 114 CMIP5 simulations are not tracking 21st century temperature at surface.
One of the 3 that does fall within observations is the Russian Academy of Science’s INMCM4, I confirmed this with John Christy and there was a section on this in a post at Climate Etc:
Unfortunately INMCM4 doesn’t perform so well at mid-troposphere but its differences to the other models are important given its surface performance.
INMCM4 is the simulation with the flat trajectory to 2020 in this graph (RCP4.5):
http://www.skepticalscience.com/pics/ChristyFig2.1.jpg
Note that flat trajectory is ENSO-neutral and MDV-neutral, hence the 7 yr running average for observations.
>”3.INMCM4 exactly matches observed atmospheric H2O content in lower troposphere (215 hPa)”
I think there’s an error here. 215 hPa is upper troposphere.
Richard.
MDV is not all that well understood, and this is probably partly why its not in climate models. I’m also not at all convinced it explains slow periods within the longer term warming trend.
But let’s assume for the sake of argument that MDV does explain the slow periods. This is still just natural variation or noise within the longer term temperature trend. Virtually every climate scientist acknowledges this sort of noise, as does the IPCC. There is still a longer term warming trend since about 1900 regardless of slow periods whatever the cause. So I have no idea what your point is.
It should be noted that temperatures from 1970 to feb 2016 are reasonably within model projections. We don’t have to “wait” for anything.
Temperatures from 2016 – 2020 remain to be seen. They dont have to show “radical warming”. How on earth do you conclude this? If the years 2016 – 2020 are reasonably above the previous 10 years, loosely speaking, that would show a positive warming trend. I expect they will be, in the main.
You have some nerve accusing Man of lacking objectivity. He isn’t just guessing about what factors contribute to the current high temperature spikes. I recall reading explanations.
In contrast all I see in your posts is guesswork. To quote you said essentially something like “the current el nino is confined to the northern hemisphere due to some combination of AMO, MDV, and a few other things”. This is pure guesswork on you part given with no proof.
You have also failed to address at least half the points I made so obviously have no real answers.
There is a lot of evidence CO2 is implicated in warming since 1970. Satellite data, nights warming more than days, other characteristics of the warming and atmospheric changes. This is why there’s a strong consensus we are altering the climate. Its not reliant on just one thread of evidence.
nigelj says:
>”Richard. MDV is not all that well understood, and this is probably partly why its not in climate models. I’m also not at all convinced it explains slow periods within the longer term warming trend.”
Are you serious? There’s a body of literature on this. I’ve extracted the MDV signal from HadSST2 myself some years ago with EMD. I’ve given Ian Forrester this example but here it is again for you Nigel:
Application of the singular spectrum analysis [SSA] technique to study the recent hiatus on the global surface temperature record.
http://www.ncbi.nlm.nih.gov/pubmed/25208060
They extract the MDV signal from the entire HadCRUT4 series. The residual is the secular trend. The models are MDV-neutral so it’s just a matter of adding the signal in. Once that’s done the model mean tracks GMST but only up until 1955, after which the models are waaay too warm.
Jeff Patterson has a TSI-driven climate model running that mimics GMST ST+MDV (look it up). CO2 is an OUTPUT from his model. IPCC GCMs must have CO2 as an INPUT parameter – think about this.
>” Virtually every climate scientist acknowledges this sort of noise [e.g. MDV], as does the IPCC”
Not until AR4 they didn’t. They’ve only just conceded they neglected natural variation. And they have NOT yet corrected for it.
>”There is still a longer term warming trend since about 1900 regardless of slow periods whatever the cause. So I have no idea what your point is.”
Good grief. I have not stated anywhere that there is no rising secular trend (ST) in GMST, on the contrary I’ve referred to ST all over the thread. I would point out that the secular trend begins warming from the LIA according to proxies, not 1900.
The problem is Nigel, that after 1955 the CO2-forced model mean does NOT conform to the secular trend in GMST. The models are too warm i.e. CO2 forcing is either excessive or superfluous. Currently, the best model has the lowest CO2 forcing response of all models.
>”It should be noted that temperatures from 1970 to feb 2016 are reasonably within model projections. We don’t have to “wait” for anything.”
This is rubbish Nigel. Have you not read AR5 Chapter 9 Evaluating Climate Models? The IPCC explicitly concedes that 111 CMIP5 model simulations are NOT tracking 21st century temperature. Only 3 are. These are the only 3 models worth consideration (see INMCM4 upthread), the rest are junk.
>”Temperatures from 2016 – 2020 remain to be seen. They dont have to show “radical warming”. How on earth do you conclude this? If the years 2016 – 2020 are reasonably above the previous 10 years, loosely speaking, that would show a positive warming trend.”
You really have not got a clue what the critical issue is Nigel. From the beginning of this century the models have been diverging from observations i.e. they are TOO WARM and increasingly so. The IPCC concedes this. They even offer reasons why: CO2 forcing response too high, and neglect of natural variation, solar change and volcanism.
There is now no possibility of ENSO-neutral observations entering the model range without radical warming between now and 2020. Surely you can see this from all the models vs observations graphs around?
I assume you didn’t look at the RCP4.5 graph I posted upthread but here it is again:
RCP4.5 models vs observations
http://www.skepticalscience.com/pics/ChristyFig2.1.jpg
Clearly there are only 3 models worth consideration, the one with the flat trajectory conforming to observations is INMCM4. Now. how can observations even come within cooee of the model mean without radical warming by 2020? Note that the 7 year running mean smooths out ENSO fluctuations so the 2015/16 EL Nino spike is irrelevant.
>”You have some nerve accusing Man of lacking objectivity.”
Huh? I did no such thing. I was pointing out that it was far too early, on YOUR part, to attach any validity to El Nino vs AGW attribution by any of the climate scientists I listed. Read my comment again Nigel.
>”To quote you said essentially something like “the current el nino is confined to the northern hemisphere due to some combination of AMO, MDV, and a few other things”. This is pure guesswork on you part given with no proof.”
For goodness sakes. GISTEMP and HadSST3 (see way upthread) clearly show the El Nino confined to the NH.
I did NOT say “the current el nino is confined to the northern hemisphere due to some combination of AMO, MDV, and a few other things”
You’ve made this up Nigel. In future, don’t put quotes around a statement you’ve made up yourself and attributed to someone else. Copy the statement directly from the source, then you can put quotes around it and make the attribution.
What I was speculating (“pure guesswork”) was that given the February 2016 GISTEMP anomaly by latitude (see upthread) shows a huge skew to the higher NH latitudes then there must be factors involved other than just El Nino that warrants study by climate scientists (see my statement re NSF funding for that). Andy picked up on this too. The NH anomaly by latitude is extraordinary.
But no warming whatsoever in the high SH latitudes 55S – 90S i.e. no anomaly above the GISTEMP climatology baseline. Not much warmer at 15N either even with the El Nino:
GISTEMP LOTI February 2016 anomaly by latitude
http://l2.yimg.com/bt/api/res/1.2/ABpZjd4AnHFp.4g2goHRfg–/YXBwaWQ9eW5ld3NfbGVnbztxPTg1/http://media.zenfs.com/en-US/homerun/mashable_science_572/bb88a1a459ed8b467290bac3540e39dd
That’s problematic for AGW isn’t it Nigel?
>” Virtually every climate scientist acknowledges this sort of noise [e.g. MDV, natural variation], as does the IPCC”
Not until [AR5] they didn’t.
>”There is now no possibility of ENSO-neutral observations entering the model range without radical warming between now and 2020. Surely you [Nigel] can see this from all the models vs observations graphs around?”
It’s the model mean vs surface to 50,000 ft that’s the biggest embarrassment for the IPCC:
Models vs Observations, Sfc – 50k ft.
https://curryja.files.wordpress.com/2015/12/christy_dec8.jpg
Absolutely no chance of reconciliation by 2020. That would require about 0.5C warming in 4-5 yrs.
Richard
I mostly disagree. I also cant follow your cryptic style, and made up abbreviations all the time, and clearly nobody else can. Your communication style is awful.
Thank’s for the link but that research paper on the MDV doesn’t look very convincing to me and doesn’t seem to have gained any traction with the climate science community. The usual reason given for the pause around 1945 – 1970 is increased aerosols, and this is more convincing to me. Therefore I don’t think your models incorporating it in that way make much sense.You can rabbit on all you wish but I wont be commenting further on it.
Please read what I said. Temperatures from about 1970 – 2016 look to be getting close to model prediction if you google it. They are getting towards the middle of the range. I was not referring to the last IPCC report, which is obviously not up to date with current temperatures.
You said “There is now no possibility of ENSO-neutral observations entering the model range without radical warming between now and 2020. Surely you can see this from all the models vs observations graphs around?”
I gather your point somehow relates to Manns comment that the current big 2015 temperature spike is largely agw and only minimally el nino. Then I would agree coming years would be expected to be very warm as well. However there will likely be a few cool la nina years shortly, however the coming ten years would need to be very warm to confirm the claim by Mann. But only time will tell, and in no way is it impossible.
However put that aside and forget the big 2016 spike, and also the possible composition of current temperature spikes. The next 10 years approximately would still only have to be moderately warmer than recently, loosely speaking, to put things back roughly in the middle of climate model predictions. It doesn’t require a massive jump. I’m referring to giss surface temperature data here.
I didn’t mean t missquote you, however your explanation for the el nino being northern was certainly a list of different natural cycles. I’m not going to trawl back to find exactly what you listed. You didn’t explain a thing to anyone. Why would you think that particular combination of things is responsible? Its just empty rhetoric without substance.
I haven’t got the time to discuss further, but thanks.
>”What I was speculating (“pure guesswork”) was that given the February 2016 GISTEMP anomaly by latitude (see upthread) shows a huge skew to the higher NH latitudes then there must be factors involved other than just El Nino that warrants study by climate scientists (see my statement re NSF funding for that). Andy picked up on this too. The NH anomaly by latitude is extraordinary.”
NSF funding not required, already explained. From Dr Tim Ball’s essay ‘How Much Of Global Temperature Increase Is Due To El Niño?’:
Supports my “pure guesswork” quoted above.
Also, this 2016 NH extreme is certainly not unprecedented.
Ian Forrester
>1900? The CO2 uptick wasn’t until the 1950s. “Wrong here are the CO2 data:”
Which clearly shows the uptick in the 1950s.
Problem is: the 1910 – 1940 linear trend in GMST is the same as late 1970s – early 2000s but CO2 is rising at different rates in each period – slow first, faster second.
>The IPCC’s anthro attribution period doesn’t even begin until 1951. “Wrong”.
Right. Note “mid-20th century” in your quote (which isn’t IPCC BTW).
IPCC AR5 SPM 1.2 is more precise:
>”Of course CO2 had an influence before mid 20th century.”
And your IPCC attribution quote is what, in respect to early 20th century attribution?
Like all dishonest AGW deniers you make the claim that climate scientists only accept that CO2 concentrations cause increase in temperature. That is just a lie, climate scientists look at all factors (they are called forcings since you seem to be ignorant about the science).
And stop quibbling about the difference between “mid century” and 1951. You are pathetic.
>”Like all dishonest AGW deniers you make the claim that climate scientists only accept that CO2 concentrations cause increase in temperature. That is just a lie,…..”
Whaaat???
No such claim. Read my SPM quote, this in particular:
“Other” is non-CO2 and the residual implies non-anthropogenic. How is that a “lie” Ian.
>”And stop quibbling about the difference between “mid century” and 1951.”
I wasn’t. I was responding to Nigel’s statement:
[Nigel ”……the longer term warming trend since about 1900, that at least approximately correlates with increasing CO2.”
I challenge you to quote an IPCC attribution to CO2 prior to 1951. Or, what IS the IPCC’s attribution to temperature rise prior to 1951?
Come on, Richard, when are you going to get to the bit about the fairy undersea volcanoes?
My popcorn is getting cold.
>”….when are you going to get to the bit about the fairy undersea volcanoes? My popcorn is getting cold.”
Oh dear. Better shoot over to GNS Rob:
From now on I suggest you communicate with them directly if you don’t like cold popcorn. Here’s their contact page:
http://www.gns.cri.nz/Home/Contact-Us
Don’t be ingenuous, Richard; you claimed that invisible volcanoes, unknown to science, were the source of global warming, rather than anthropogenic CO2.
Richard, you still believe in Volcanos being responsible for the extremely steep CO2 spike we are having?
http://blogs.scientificamerican.com/observations/files/2013/05/co2-800000-years.jpg
Do you really think that somehow, starting at the beginning of humanity burning fossil fuels somehow magically some massive new volcanic process started, one we had not seen for millions of years, that somehow is responsible for the CO2 spike?
Do you really think that at that same time, somehow some natural process would have mopped up the anthropogenic CO2 we know we released? And we know exactly how much we have blown into the atmosphere because we have excellent records over the fossil fuels being produced, sold and burned!
And we know also that we released through the burning of fossil fuels about twice the amount of CO2 we now find added to the atmosphere, the rest being to the most of it now dissolved in the oceans where we measure its concentration rise?
Do you further believe that somehow those pesky little volcanos have managed to somehow emit all this CO2 and somehow then removed the according amount of oxygen from the atmosphere too, just what you would get if you created that CO2 from burning Carbon fuels in the atmosphere… you realize perhaps that we measure these things.
Richard, your ramblings are shockingly full of complete nonsense. I have rarely come across a person who has the grandstanding of you with so extremely little actual capability and knowledge to back it up.
Why do you have a long comment about volcanoes when Richard C hasn’t even brought it up in this thread?
PS, I am not involved in a peer review
RichardC thinks he is impressing us with the long and disjointed posts. They are nothing but word salad, especially when he cites Tisdale and Ball.
Richard C: Please, henceforward confine your nonsense to Treadgold’s place. Referencing Tim Ball as some kind of credible source is beyond the pale.
I’ve just checked your comment about Ball over there. Here’s an extract:
Now, consider for a moment the relative credibility of “some bloke on the internet” who gets all his information from climate denialist propaganda, as compared with some of the world’s leading climate scientists. Has this kiwifruit-packing “bloke” found something that every real, working, publishing scientist has missed?
No.
Thanks Gareth.
The rubbish was starting to really pile up.
>”Has this kiwifruit-packing “bloke” found something that every real, working, publishing scientist has missed?”
Yes, corroborated by UAH March 2016 report:
UAH February 2016 LT anomaly map
http://nsstc.uah.edu/climate/2016/february/FEBRUARY_2016_map.png
UAH March 2016 LT anomaly map
http://nsstc.uah.edu/climate/2016/March/MARCH_2016_map.png
The Dunning-Kruger is strong in this one.
Richard: nothing that you have written means what you think it means. Please confine your drivel to RT’s place. At least there everybody will be on the same page as you.
One of the saddest current effects of the recent warming spike is the bleaching of some of our most precious coral reefs:
http://www.theguardian.com/environment/2016/apr/11/mass-coral-bleaching-now-affecting-half-of-australias-great-barrier-reef
I witnessed first hand the transformation of pristine reefs in the Pacific Islands in 1998. I dived on many reefs in 1995 and 1996 and returned in 2000 and later years. The difference was remarkable and very sad. In places where there was the fantastic plethora of life that makes up the coral reefs I often found dead reefs where what used to be corals was now a rubble overgrown with a slimy green algae cover.
Another rather concerning news is coming in from cloud modellers:
https://www.sciencedaily.com/releases/2016/04/160407221445.htm
It seems that clouds in a warming world have a lesser dampening effect on warming as suggested so far and we are likely facing a higher climate sensitivity than thought:
For some good news
Wow, after reading the court’s conclusion, including the signature line of the judge, one can not fail to hope that this, while not the last, may be one of the early proverbial “nails for the Coffin” that perhaps eventually confines the banter of the AGW gang of deniers to the graveyard to be buried together with some of their gerontic icons….
The ruling is an interesting read: http://ourchildrenstrust.org/sites/default/files/16.04.08.OrderDenyingMTD.pdf
If “using” fossil fuels is violating their rights to life, liberty and property, then presumably these 8-18 year olds will be happy to give up all products and services that use or are derived from fossil fuels, such as public transport, household appliances, computers and phones.
Or maybe the 8 year olds haven’t had that explained to them properly. Is it legal to use children to pursue political objectives in the courts?
Ah, one of your favourite “arguments”. And just as much specious nonsense as the last time you deployed it.
You really should try harder.
They are claiming in a US court of law that “using and extracting” fossil fuels is violating their rights.
They are also claiming that this is causing “catastrophic” climate change, right now.
The standards in a court are somewhat higher than Twitter and the blogosphere, so these 8-18 year olds will need some pretty good representation. I wonder who is paying for it. I presume it’s not coming out of their paper round money.
Given that the last time atmospheric CO2 was around 400ppm sea level was 20 metres higher than today, I’d say that youngsters (and future generations) have a lot to be concerned about.
As for funding: it’s interesting to note that the American Petroleum Institute intervened in the case…
No Andy, once again you twist the evidence. The complainant alleges that the U.S. government has known for half a century that greenhouse gases from fossil fuels cause global warming and climate change and yet has done not nearly enough about it. In fact, as the complainant alleges, the government has actively subsidised and promoted the expansion of fossil fuel extraction and the companies that are in the business of doing so.
It is obvious from the government’s own records that there is no doubt that this part of the claim is plainly true.
And further, there is no doubt left in the mind of any right minded person that raising CO2 levels to 400ppm and above will cause very significant and painful consequences for the next generation as stated in the claim.
From Page 2 of the pdf you posted
To me that is a very sloppy piece of writing written by an amateur that will be dismissed quickly in a court of law.
For starters, “has been causing” catastrophic climate change is highly contentious. Do they mean that the catastrophic climate change is occurring right now, or that it has the potential to be in the future?
Just as an exercise, I will attempt to rewrite that paragraph:
“Plaintiffs are suing the United States and various government officials and agencies because, they assert, the government has known for decades that carbon dioxide (C02) has the potential to cause deleterious climate change. This is an externality in that the bodies causing the emissions are not necessarily the same as those that would experience the potential negative impacts of the emissions, and as such is the economic justification for regulation. The plaintiffs argue that the government and regulatory bodies have failed to take necessary action to curtail these externalities via regulation of fossil fuel emissions, given their knowledge of the issue over the previous decades”
Note that I don’t necessarily endorse this viewpoint as my own. I’m just showing how I might reword it.
Andy: The PDF here is the summing up of the case by the judge. Not the claim written by the plaintiffs.
And just because a bunch of nut cases without a proper understanding of the science or a bunch of deep-pocked vested interests in selling carbon fuels contend the evidence for CO2 caused rapid climate change does not mean that the evidence is “contentious” any more as the Flat-Earth society makes it contentious that the Earth is a spherical….
You keep misunderstanding your personal (wilful or ignorant) confusion and lack of understanding over what is happening to our climate for there being a genuine doubt founded on scientific evidence.
And further, there is no doubt left in the mind of any right minded person that raising CO2 levels to 400ppm and above will cause very significant and painful consequences for the next generation as stated in the claim
No doubt at all? I probably could find many climate scientists who publish in the peer reviewed literature and are cited by the IPCC who do not claim that CO2 levels above 400ppm are “dangerous”
Maybe, since all “right-minded” people think this to be the case, you can point me to the peer-reviewed papers that assert this.
Since yours is the assertion, you might support it with evidence.
No climate scientist I have ever talked to would call 400 ppm “safe”.
The 400ppm “dangerous” limit is not mentioned in any of the IPCC reports, as far as I can see.
Anyway, my point is not to argue about that, but the nature of the language in the court report.
If you make the assertion, in a court, that the current levels of CO2 are “dangerous” and causing catastrophic climate change, right now, then you are exposing yourself to some quite severe cross examination.
Only by lawyers arguing legal niceties, not by scientists evaluating risk.
Only by lawyers arguing legal niceties, not by scientists evaluating risk.
This is a discussion about a court case. Lawyers argue about things in court cases. Generally, in matters of the environment, the NZ law looks to the RMA
In this case, the argument appears to be around US constitutional rights, not the veracity or otherwise of scientific claims
If the rest of us continue with business as usual, it is almost certain that we will be violating their right to life, liberty, and property, as well as their right to public trust resources. I know you don’t get that – but the last year must surely be giving you cause to doubt.
8 – 18 year olds and younger are the generation upon whom the effects of continued business as usual will impact the most – and even more so on their children, and their children’s children. So it is entirely appropriate that they should be bringing this action. I’m sure they understand the consequences of continued business as usual even more than you.
[Specious argument snipped. Please try harder. GR]
MUST……..NOT………..FEED…………….TROLL………………!!!!
On the contrary, Andy, the “severe cross-examination” should be of those industry titans who were warned of the catastrophic impact of rising GHG emissions 60 years ago, yet deiberately chose to supress that knowledge:
http://www.huffingtonpost.com/entry/oil-cover-up-climate_us_570e98bbe4b0ffa5937df6ce
I had no idea that the existence of catastrophic climate change was known before I was born and there
has been a global conspiracy to cover it up
It does seem a little implausible given that we are exposed to climate change stories in the media almost every day
[Pointless trolling snipped. GR]
“I had no idea…..” The consequences of haunting denial web sites etc, where such info is suppressed.
“It seems implausible……” Unfortunately too many of the media reprint stories originating from that conspiracy, intended to promote doubt and confusion. You do it yourself regularly.
Unfortunately too many of the media reprint stories originating from that conspiracy, intended to promote doubt and confusion. You do it yourself regularly
For example?
Are you able to cite a single part of this “conspiracy” that I apparently cite regularly?
Well, you do have an extensive track record for picking nits and blythly ignoring the big picture.
Wow, the conspiracy to defraud the public and to undermine trust in our scientific institutions must rank as one of the high crimes committed against the human endeavor by any standard. I hope that those responsible will one day be charged and tried.
There is an introductory video on the CIEL website that is well worth watching:
https://www.smokeandfumes.org/#/
[Pointless trolling snipped. GR]
This cartoon summarises the above discussion rather well.
http://www.stuartmcmillen.com/comics_en/hendrix-uncle/
LOL, Simon, that certainly applies to the likes of Richard C.
I suspect, however, that the likes of Bryan Leyland and Andy Scrase are are better compared to Milli Vanilli, the “pop stars” who were paid to lip-synch to someone else’s vocals.
https://en.wikipedia.org/wiki/Milli_Vanilli
Just took another look at our Fox Glacier. Oh, dear. I saw it first in 1994. Then again in 1999 and 2008. Since then it as retreated very significantly up the valley. For a stretch of what I guess to be over 1km it has retreated from its valley since 2008. Where the ice once was is now a trough of empty rock. The old staircase that used to lead onto the ice is still hanging, now perhaps 100 off the valley flow, far from where the ice now is. The volume of the ice loss that saw between 1994 and today is staggering.
Yes, same with Tasman Glacier. I climbed there extensively in the late 60s, early 70s. Have avoided going there in recent times, particularly after a massive multi million tonne calving occurred I think about 2011 which was described as a `tourist attraction` by media.
Glaciologist, Trevor Chin described it as the `cannery in the mine` event and stated that at the current rate of warming all NZ glaciers would be gone within 30 years.
So one can assume all high country snow cover would also not exist. Correct me please if I misunderstand but don`t the Canterbury aquifers and rivers somewhat depend on snow melt over summer. So much for irrigation and growth in diary John. Better look at adaptation to what grows in a dessert.
But of course you will have retired to play golf with the Obama in Hawaii by then.
Cheers mate. (NOT)
Actually wrt to the loss of the southern Glaciers, during the book launch “Living In a Warming World”, I asked Jim Salinger if he could comment on this precise question. What would be the effect on the Southern lakes and on the Cantabrian aquifers?
The thing is the perceived wisdom at the time is that although the quantity of snowfall might decrease the total precipitation would remain much the same, so the effect could be much less than feared. Of course that did not take into account the draw down of 40 Billion litres for bottled water!
“…draw down of 40 billion litres for bottled water.” Which is the allocation, use it or lose it, for one smallish farm like the hundreds on the Canterbury Plains. Not just dairy, the cropping and seed growing farms need a lot of irrigation water too.
My thought was that precipitation falling as rain rather than snow has far less opportunity to soak down into the aquifers, reducing their supplies and increasing the chances of floods.
I don’t think you can assume that high country snow cover will not exist if there are no glaciers
Scotland has no glaciers but there has been plenty of snow cover in recent years
You’ll find, if you think about it, that glaciers require thick, permanent snow cover that can develop into ice. Not common in Scotland.
Glaciers require snow, but snow does not require glaciers
The conditions that lead to disappearing glaciers also lead to reduced snow. Higher temperatures in the mountaintops. Precipitation that might have lingered as snow will drain quickly off the mountains with higher river flows and less storage of water.
The reason Scotland is short on glaciers is the lack of altitude and a snowline that can survive the summer temperatures.
Andy the point is: Glaciers are evidence of a temperature regime in which snow cover is maintained through summer and successive winters create permanent ice – in other words a glacier.
The fact that our glaciers have been rapidly disappearing since the early nineties is a testament to a significant change in the temperature regime, resulting a more ice loss in summer than could be recovered in the winters. You live in the south island, you certainly will be able to have first-hand evidence yourself if you wanted to.
I can only add that the sight (or the lack of the same) of the Mueller and Hooker glaciers was another eye opener. I saw the area in 1994 and the difference is breath taking!
From next month I’ll have the privilege of being in line of sight of several glaciers from my house. I’ll stick up a webcam if you want.
I am fairly aware that glaciers are advancing or retreating depending on two main factors, (a) snowfall in the accumulation zone and (b) melting in the ablation zone
Glacier dynamics are determined by the relative impact of both these factors. Fox and Franz Josef glaciers show rapid changes because of their relative steepness and exposure to NW snowfalls.
Wikipedia has this to say about Franz
https://en.wikipedia.org/wiki/Franz_Josef_Glacier
Generally speaking, if the world is warming, the glaciers will retreat, but if the warming triggers increased snowfall through increased NWers, for example, then the glaciers will advance, as we have seen recently with the West Coast glaciers.
The Tasman Glacier is retreating rapidly, but I’m fairly sure that is in part due to the large terminal lake accelerating the melt at the snout
All correct! Living in glacier land is working wonders… 😉
Andy, it’s funny that your copy and paste job from Wikipedia stopped just a bit short of:
Following things you cite is fun Andy.
The citation [11] in the Wikipedia article is referencing this NIWA report:
http://www.niwa.co.nz/news/new-zealand-glaciers-shrinking
From that:
To add to that: The NIWA report was from 2007. Since then the rapid retreat of the glaciers has continued.
Thomas, I’m glad that you find my citations amusing.
Are there any parts that you disagree with?
Oh, Andy… no, I do not disagree with Niwa or the Wikipedia entry. What is amusing to me and quite likely to the rest of the readers is your selective and deceptive quoting, carefully omitting to take any note of and denying the “Gorilla in the room….”
Q.E.D.
I take a little exception to your accusations of “selective and deceptive quoting” Thomas. If you read my original comment, please describe how I am being deceptive.
Of course, I could cut and paste entire Wikipedia articles into comments, just to be on the safe side. I don’t really think this would be welcomed, however
Andy, it is a deception to omit the conclusion of a source and selectively quote statements from the middle that speak to aspects that you like to believe in if the conclusion of the source is clearly contradicting your belief! Your post seems to suggest that the sources you cite support your belief that glacier behaviour is simply explained by natural variability while the source you cite clearly conclude that global warming is to blame for the observed mass loss of NZ glaciers (and if you read more widely) glaciers all over the world. https://en.wikipedia.org/wiki/Retreat_of_glaciers_since_1850
Ice behavior is one of the most striking observable natural indicators of global warming. Of cause, merchants of doubt like yourself hate the same and resort to tactics like the one you displayed so obviously here, to keep doubt alive in the minds of the gullible.
My quote was to emphasis the current rapid ice loss on Fox and Franz was preceded by a rapid ice gain, which you failed to report on in your original comment.
As I said in my comment,
The staff at DoC Mt Cook made a similar comment on a school camp I attended a few years ago, by the way. It is hardly controversial
Your implication is that somehow the increased flow of the Southern Alps glaciers negates climate change, but in fact they are special cases. Depending on the current state of global weather patterns our glaciers can be either advancing or retreating rapidly responding to the drum-beat of increasing CO2 pollution. If the patterns swing to lower precipitation, they retreat, if the norwester bring heavier dumps of snow in the tops, the flows increase rapidly due to the steepness of their beds.
Globally, glaciers are waaay more often than not in full retreat and that is abnormal.
Globally, glaciers are waaay more often than not in full retreat and that is abnormal.
Glaciers have been retreating since the last ice age. Is that abnormal in itself (irrespective of rate)?
Your implication is that somehow the increased flow of the Southern Alps glaciers negates climate change
Can you define what you mean by “negative climate change”?
“Glaciers have been retreating since the last ice age. Is that abnormal in itself (irrespective of rate)?”
Glaciers retreated following the last ice age but by the 19th century were comparatively stable, with the average global temperature creeping very slowly downward. Then, geologically very rapidly, they started retreating around the world during the 20th century, just about the time civilization started dumping vast quantities of GHGs into the atmosphere.
This NIWA page from 2008 tells a slightly different story
…
The most recent maximum extent of glaciers was at the end of the last cool period for our region. This was the Little Ice Age, or LIA, a period of glacier expansion that reached a maximum in the Southern Alps in the 17th and 19th centuries. Then there was some warming from about 1910 to the mid 1970s, and especially in the 1950s, which caused a massive wastage of glaciers. In 1977 the second phase started, coincidentally just as we began our programme of annual surveys. Despite continued regional warming, this phase has been a time of alternating gains and losses, resulting in a near zero ice-mass change of the Southern Alps glaciers over the last three decades.
(Emphasis added and typos fixed)
https://www.niwa.co.nz/publications/wa/vol16-no3-september-2008/glacier-response-to-climate-change
This doesn’t seem to line up with the previous statement from NIWA quoted by Thomas
Yes, Andy, from the 1940ies to the end of the 1970is global temperatures actually went down slightly as you will know. The glaciers responded accordingly.
The article you cite sais: “Between 1976 and 2005 the volume decreased more than 10%, from 54.60 km3 to 48.74 km3. More than 92% of this loss is from 12 of the largest glaciers.”
But since then everything has changed dramatically and, Andy, why don’t you go down and see for yourself what happened since 2007….!
If you don’t want to do that, here are some images for you compiled by the NZ Herald last year. They show the dramatic retreat over the last 8 years:
http://www.nzherald.co.nz/nz/news/article.cfm?c_id=1&objectid=11390803
The images in this article show the Fox glaciers retreat between 2007 and 2015.
The situation today is indeed dramatically different from only 8 years ago.
The article cites Salinger and others with an estimate of 34% mass loss of NZ alp’s glaciers over the last 15 years.
and, Andy, why don’t you go down and see for yourself what happened since 2007….!
My concern is the discrepancy between NIWA reports up to this point
You are laughable Andy. There is no discrepancy between the 2007 NIWA report
http://www.niwa.co.nz/news/new-zealand-glaciers-shrinking
and the findings from 2015.
In fact, in 2007 NIWA commented on what they expected then:
It would seem that Salinger was spot on, when you look at the 2015 images and reports.
Andy, your attempts to create doubt from thin air are as pathetic as usual.
I wasn’t looking for discrepancies between a 2015 report and the 2007 report. I was looking for an explanation of why the 2008 webpage from NIWA seems to report a different finding to the 2007 one quoted by Thomas.
I am fully aware of the recent decline in the Fox glacier, probably caused by a lack of snowfall on the neve
It affects not just the Fox Andy. The last decade was devastating for NZ’s glaciers. The Tasman is disappearing at an alarming rate and is set to be gone in the not to distant future.
https://www.google.co.nz/?ion=1&espv=2#q=Massey+University+glacier
Have fun with your “semantical” concerns about “differences” in 2007 and 2008 NIWA web statements Andy. As usual, semantics all that you have left in your silly quest to raise doubt about the impacts of AGW on our planet.
Thomas, you claim that
yet in NZ, there was a period of warming in the mid 20th C during a period predominated by northerly airflows, and the article I cite states
So you are claiming that glaciers increased in size, and NIWA claim that there was a massive decline.
Which is it?
Best not to feed the nitpicking nitwit troll, Thomas.
Yep, I will leave him to his puzzlement 😉
Thanks for your link to the Google search for the Massey research into Tasman Glacier
By using this search, I was able to find the article here
http://www.massey.ac.nz/massey/about-massey/news/article.cfm?mnarticle=tasman-glacier-retreat-extreme-23-04-2008
The article explains the mechanism
This is a good example of one of your beloved “positive feedbacks” or “tipping points”.
However, I dispute that the glacier will be all gone “in a few years”.
What will probably happen is that the lake extends several km up the Tasman Valley to the beginning of the moraine, where the glacier starts to steepen. Just up from here is where Alpine Guides finish their 8-10km ski run. When the lake reaches its furthest point on a predominantly flat terrain, then the glacier will life away from the lake and be separated by a moraine wall.
The head of the Tasman Glacier is over 2500m and there are many glaciers up there. Maybe they will all disappear at some point, but not by this mechanism.
Read “lift away”. for “life away”
In India temperatures are creating serious issues already. And it is still April, with temperatures already 4-5C hotter than normal. A daytime cooking ban is in effect now in parts of India to prevent further death….
http://www.theguardian.com/world/2016/apr/30/daytime-cooking-ban-in-india-as-heatwave-claims-300-lives
Welcome to the preview of the lives of our grand children.
The latest of the developments from the Ocean science front is bleak:
Not only are we causing a widespread demise of corals as well as rising acidity levels, now it seems that the warming oceans are driving the de-oxygenation of ocean waters ahead with potentially wide-reaching consequences.
http://www.scientificamerican.com/article/ocean-s-oxygen-starts-running-low/
What has happened in past episodes of warm periods caused by high CO2 concentrations is troubling to consider. De-oxygenated ocean waters are believed to have bee a source of highly toxic H2S, which is implicated as a possible cause in mass extinction events in the past.
https://en.wikipedia.org/wiki/Anoxic_event
And as Spring begins in the Northern Hemisphere ….
Wildfires force tens of thousands to evacuate Fort McMurray in Alberta