Antarctic ice going fast: Larsen C ice shelf primed for giant calving event

Analysis of rift propagation using Landsat data. Background image, in which the rift is visible, is from 4 December 2014. Inset graph shows the development of rift length with respect to the 2010 tip position, and rift width at the 2010 tip position, measured from 15 Landsat images (crosses). Circles and labels on the map, and dotted red lines on the graph, show the positions of notable stages of rift development.

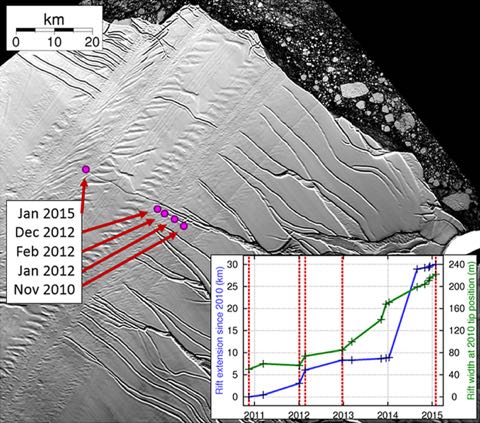
The Larsen C ice shelf on the east coast of the Antarctic peninsula is primed for a giant iceberg calving event, and could be heading for total collapse — similar to the fate of the Larsen B ice shelf in 2002, according to scientists monitoring the ice. A huge crack (above: hover over the picture for the full caption from the paper) is propagating northwards at an accelerating rate, and could give birth to ice islands of between 4,600 km2 and 6,400 km2 — equivalent to three or four Stewart Islands floating out to sea — according to an open access paper, Jansen et al, Newly developing rift in Larsen C Ice Shelf presents significant risk to stability ((The Cryosphere Discuss., 9, 861–872, 2015)) (full pdf), published last month.

From the paper’s conclusions:

It seems inevitable that this rift will lead to a major calving event which will remove between 9 and 12 % of the ice shelf area and leave the ice front at its most retreated observed position. More significantly, our model shows that the remaining ice may be unstable. The Larsen C Ice Shelf may be following the example of its previous neighbour, Larsen B, which collapsed in 2002 following similar events.

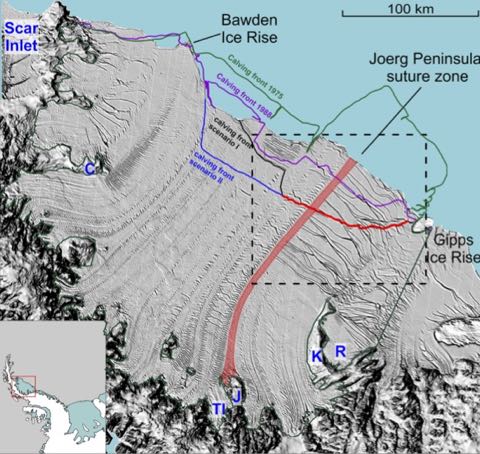
The Larsen C ice shelf has been thinning over at least the last decade, and has shown signs of surface melting. Jansen et al developed two calving scenarios — shown below — and analysed the results with a model of the ice shelf.

 Overview of the Larsen C Ice Shelf in late 2014 showing the contemporary location of the developing rift (red line), and a selection of previous and predicted future calving fronts. Background image is MODIS Aqua, 3 December 2014. Geographic features of interest are marked (R = Revelle Inlet, FI = Francis Island, TO = Tonkin Island, TI = Trail Inlet, SI = Solberg Inlet, K = Kenyon Peninsula) and the dashed box shows the extent of Fig. 2. The highlighted flow line indicates the location of the Joerg Peninsula suture zone.

For a good overview of the current state of our knowledge of Antarctic ice melt, see The big melt: Antarctica’s retreating ice may re-shape Earth from the Associated Press, which tipped me off to the Larsen C story. Larsen C is the most northerly of the remaining major Antarctic ice sheets, and the last remnant of an ice shelf that until 1995 stretched up to the tip of the east coast of the Antarctic Peninsula. After the collapses of Larsen A and B, the glaciers feeding the shelves were observed to speed up — increasing the overall ice sheet mass loss. While the loss of the ice shelf won’t itself cause any sea level rise — because it’s already floating — the resulting speed up will increase sea levels.

Blink and its gone – spectacular time-lapse of ice retreat at Fox Glacier

[vimeo 119312940 w=480]

This spectacular time-lapse video ((Created by Victoria University of Wellington with the support of Fox Glacier Guides, Department of Conservation, Snowgrass Solutions, University of Canterbury and the Marsden Fund.)) captures the dramatic retreat of the Fox Glacier in Westland over the last year — 300 metres between January 2015 and January this year. As the ice retreats, the hillside becomes unstable and collapses down into the valley. To get a sense of the scale, you can see people watching from a safe point on the bottom right.

The rapid retreat of both Fox and its neighbour Franz Josef has led to the abandonment of guided walks on the glacier tongues. The ice is now only accessible by helicopter on to the upper reaches.

The collapse of the walls of the valley at Fox (as well as rocks and sediment transported by the ice) has caused the valley floor to rise by a metre over the last two years, as measured by Massey University scientists (see also NZ Herald). They’ve also photographed the retreat over the last decade, but the most marked loss seems to be in the last few years.

NZ’s west coast glaciers are amongst the most dynamic in the world, fed by huge snowfalls in their nevées under Mt Cook — as much as 6 metres a year in the snowfield feeding the Franz-Josef, as Mauri Pelto notes here. At the moment, ice melt in the tongues of both glaciers is outpacing the ice input above, and so the glaciers are retreating fast, but a run of years with heavy snowfalls could reverse the process — at least temporarily.

Four Revolutions in the Earth Sciences

James Lawrence Powell is a former geology professor, college president and museum director. He is currently the executive director of the US National Physical Science Consortium. He is also an excellent communicator of science for the general reader. I reviewed two of his climate change-related books back in 2011 here and here. His latest book, Four Revolutions in the Earth Sciences: From Heresy to Truth, is wider in its scope, and places climate science alongside three other major scientific understandings which emerged in the course of the 20th century, profoundly affecting our knowledge of the planet.

Powell the geologist was familiar with the fact that great geological discoveries of the 20th century had had to struggle for decades to gain acceptance by the community of geologists. It was no easy ride for the propositions that the planet is billions of years old, that continents and sea floors move, and that meteorites crash into the earth. The opposition and the controversy his book narrates were often intense before the theories gained wide acceptance.

Powell had researched modern climate science, but was less familiar with its past history. He discovered that its early proponents had also suffered initial rejection of their theories and it was many decades before the correctness of their discoveries was acknowledged.

Continue reading “Four Revolutions in the Earth Sciences”

The wrinkled retainer returns with a Peer-reviewed Peer

There is much ado at Tannochbrae Manor, because the Laird has once again disproved global warming. One equation is all it takes! And an article in a new Chinese science journal with some friends, and lo!

Take away that inappropriate and misapplied equation, remove the unjustifiable tripling and the climate “crisis” vanishes.

You couldn’t make it up ((No, wait a minute. You can. He has. And I might be persuaded…)). Although the Laird is a past master of self-parody, his triumphant article at WND is really something else. But enough: there is much ado at Tannochbrae Manor, because Scrotum has returned!

It’s been nearly two years since the last of my Monckton tales, and fully six since Old Scrotum first trod the boards at Hot Topic, so it’s a great pleasure to see someone else picking up the characters and beating around the bush with a pheasant in the hand and a peasant in the pocket. Izen has summoned the wrinkled retainer from retirement in order to help him express his astonishment at the chutzpah of the good Lord in writing and promoting his latest opus, which is being widely greeted with yawns — and some preliminary debunking. There will be more.

There may even be more from Scrotum. I hear rumours that the Laird’s attempts at spoken Mandarin are not going down well…

Heat: 2014 breaks global temperature records, 2015 could be hotter

Climatecouncil2014graphic

Last year was the warmest year on record for the planet, analyses by NASA and NOAA show, and it’s possible that 2015 could be warmer still. 2014 was warmer than previous record holders 2005 and 2010, and comfortably ahead of 1998. 13 of the hottest 15 years on record have all occurred since 2000. Remarkably, 2014’s warmth was achieved without much assistance from an El Niño — which boosts global temperatures and is normally a factor in record setting years, as this graphic from Skeptical Science shows:

ENSO Temps static480

For more discussion of ENSO’s impact on temperatures, see Dana Nucitelli’s article at The Guardian, and Jim Hansen et al’s discussion here. Hansen warns that more warming could be on its way:

More warming is expected in coming years and decades as a result of Earth’s large energy imbalance, more energy coming in than going out, and with the help of even a mild El Niño 2015 may be significantly warmer than 2014.

The risk of further rapid rises in global temperatures could also be increased by early signs that the Pacific Decadal Oscillation (PDO) may be shifting to its positive phase, as the Peter Hannam at the SMH pointed out late last year:

“During a positive PDO phase, you’d expect temperatures to keep climbing again as they did in the 1980s and 1990s,” Dr (Shayne) McGregor (of UNSW) said, adding that as PDOs are measured by rolling 11-year averages, it will be a while before any shift becomes clear.

In New Zealand, NIWA reports that the nationwide average temperature for 2014 was 12.8°C, 0.2°C above the 1981–2010 annual average, but that June was tied for warmest in the long term record. The MetService blog provides a good overview of regional weather here.

For further analysis and discussion, there is a lot of good coverage and supporting information available on the web. Here’s my pick of some of the best.

News coverage: New York Times (above the fold on the front page, no less), BBC, Guardian, Stuff (taking the AP coverage). Time makes the obvious point: warming continues unabated, which should give the lie to climate crank nonsense about no recent warming ((…but I won’t be holding my breath…)).

Background analysis: the Climate Council in Australia (who created the graphic at the top of this post), a superb Bloomberg graphic, Climate Nexus, Climate Central (one and two), and for my favourite visual reminder of how warming has progressed, here’s NASA’s animation of global warming from 1880 to 2014:

[youtube=https://www.youtube.com/watch?v=WtPkFBbJLMg&w=480]

[Bowie]