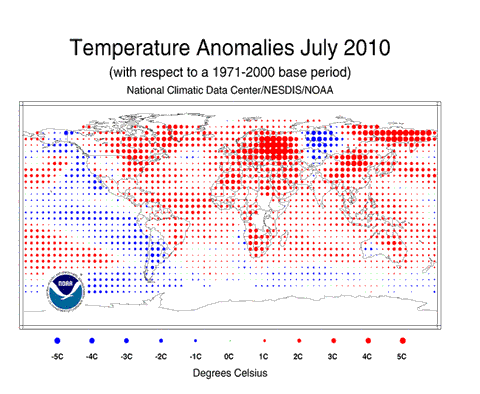
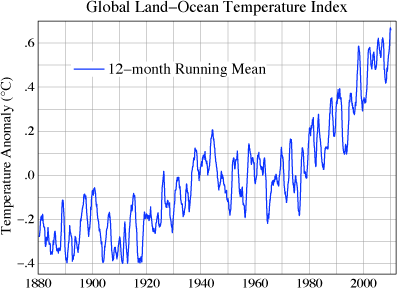
 “If it’s that warm, how come it’s so darned cold?” is the heading James Hansen has given to a recently finalised essay circulated to his email list. In more sober terms he subtitles it Regional Cold Anomalies within Near-Record Global Temperature.
The essay explains how the NASA Goddard Institute for Space Studies (GISS) goes about analyzing global temperature change, using electronic receipt of data from three sources: (1) weather data for several thousand meteorological stations, (2) satellite observations of sea surface temperature, and (3) Antarctic research station measurements. And for those who might suggest that there’s secret manipulation going on Hansen makes it clear that the data is available for others who want to use it:
“Although the three input data streams that we use are publicly available from the organizations that produce them, we began preserving the complete input data sets each month in April 2008. These data sets, which cover the full period of our analysis, 1880-present, are available to parties interested in performing their own analysis or checking our analysis. The computer program used in our analysis can be downloaded from the GISS web site.”
The results are that 2009 tied (with 1998, 2002, 2003, 2006 and 2007 – differences too close to matter) as the second warmest year in the 130 years of global instrumental temperature record. The warmest was 2005. Hansen discusses the variance of the GISS figures with the Hadley Centre (HadCRUT) which has 1998 as the warmest year, and which has been used so frequently to support claims that the globe since 1998 is now cooling. After careful comparison he concludes that the differences that have developed between the GISS and HadCRUT global temperatures are due primarily to the extension of the GISS analysis into regions that are excluded from the HadCRUT analysis. He expresses a reasonable degree of confidence in the GISS preference for 2005. Over the decade the conclusion is easier: the world has become warmer, not cooler.
What about that cold 2009 December? There was an unusual exchange of polar and mid-latitude air in the northern hemisphere, related to the most extreme Arctic Oscillation since the 1970s. His conclusion is that December 2009 was a highly anomalous month. High pressure in the polar region can be described as the “cause” of the extreme weather. There is no apparent basis for expecting frequent repeat occurrences of December 2009 conditions, though high winter variability including cold snaps will surely continue.
Further discussion of seasonal temperature anomalies leads to the observation that the change in the probability that the seasonal mean temperature at any given location will fall in the category that was defined as unusually warm during 1951-1980 has increased from 30 percent during that period to about 60 percent today. This will be illustrated in an upcoming publication.
The bottom line?
“The Earth has been in a period of rapid global warming for the past three decades. The assertion that the planet has entered a period of cooling in the past decade is without foundation. On the contrary, we find no significant deviation from the warming trend of the past three decades.”
I haven’t attempted to offer any of the detail with which Hansen builds his conclusions, but can report it as readily accessible to the lay person prepared to give it reasonably patient attention. The essay is another example of his skill in communicating serious science to non-scientists and of his laudable willingness to do so.
His preliminary remarks are worth separate attention. He notes that scientists reporting global warming have come under attack for a supposed conspiracy to manufacture evidence of global warming. Vicious personal messages are sent to the principal scientists almost daily.
“The spiral into an almost surrealistic situation with ad hominem attacks on scientists may have originated in part with vested interests who do not want society to address climate change. But there is more than that – including honest, wishful thinking that climate change is not really happening. But wishing does not alter facts.”
He stoutly supports the work of scientists:
“The scientific method practically defines integrity… All scientists make honest mistakes, but the scientific method is designed to correct them. The skeptical nature of the scientific method causes conclusions to be reexamined as new data appears. Cases of deliberate fudging of data, of scientific fraud, are so rare that these infrequent episodes live in infamy for decades and even centuries.”
He knows of no cases of fraud in analyses of global temperature measurements. In the face of unfounded accusations “our best approach is simply to continue to report our scientific results as clearly as possible.”
He thinks that most of the public continue to respect scientists for what they do and how they do it. I hope he’s right. Sometimes I think the forces of denial have taken on the aspect of a rampaging demonic power, against which the forces of quiet reason are for the time being ineffectual.
Like this:
Like Loading...
 James Hansen will be touring New Zealand next month, giving a public lecture entitled “Climate Change: a scientific, moral and legal issue” in Auckland, Palmerston North, Wellington, Dunedin, Gore and Christchurch (schedule below the fold). Coal and lignite will be a major focus of his visit, and he’ll be participating in a symposium on “the future of coal” in Wellington on May 17th. Solid Energy’s CEO Don Elder will also be there, which should guarantee an interesting divergence of opinion. Hansen will also visit Southland to see the site of Solid Energy’s proposed lignite developments. Hot Topic and The Climate Show hope to be able to catch up with Jim at some point on his tour. I want to ask him about the Eemian… 😉


 “If it’s that warm, how come it’s so darned cold?” is the heading James Hansen has given to a recently finalised