I felt the chill before the winter came

Being keen on accuracy in all things, I feel I should draw the attention of the readers of Hot Topic to a prediction failure. Back in August, in a post called Arctic Sea Ice Forecast: It’s going to be tough to stay cool, I made a number of predictions about how the climate crank echo chamber would respond to the record-breaking Arctic sea ice summer minimum that was then on its way. A number of those predictions came to pass, as this recent accounting demonstrates, but I made some longer term predictions that we can now examine.

Here’s what I wrote on August 12:

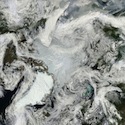
When the re-freeze starts, and the Arctic basin is covered in ice once more (early December), Anthony Watts will report on the record rate of ice formation, calling it a “stunning recovery“.

I wish to apologise to Mr Watts, because I got both the timing of his statement and his precise words wrong. Here’s what he said in a post dated October 18 – Sea Ice News Volume 3 Number 15 – Arctic refreeze fastest ever:

After all of the news about a minimum record ice extent last month, this is interesting. As we know when water loses its ice cover, it allows a lot of heat to radiate into space as LWIR. many predictied that as a result of the extra open ocean surface, we see a very fast refreeze in the Arctic. It appears they were right. In fact, this is the fastest monthly scale refreeze rate in the NSIDC satellite record going back to 1979 ((Copied and pasted from µWatts, so the typos are his.)). [My emphasis]

He couldn’t wait until December before commenting on the freeze-up, but perhaps he’s saving the phrase “stunning recovery” for later use — or leaving it for his friend Steven Goddard, who has been exploring novel metrics for the autumn freeze. Sorry, Anthony.

[Elvis Costello]

Sustainable Energy NZ #3 – When having a Hot Earth is Desirable – Crunching the numbers on Geothermal.

This is the third post in the Sustainable Energy without the Hot Air – A New Zealand Perspective series. Today we’ll be crunching the numbers on geothermal potential in New Zealand. For the background to the work and an explanation of the methodology, please visit this post. Also check out the last post on the potential of hydro power.

Unlike the UK, New Zealand has significant geothermal resources which currently contribute to national energy requirements. Geothermal energy has the advantage of being always available at full capacity, and unaffected by weather. Currently about 5.2kWh/d/p is available (3.6kWh/d/p of electricity is produced plus 1.6kWh/d/p in direct heating) but it is estimated that there is potential for a total of 12kWh/d/p at an admittedly higher price than gas generated electricity [dbpz7n]. Environmental and regulatory constraints further limit development. The Electricity Authority foresees generation rising by a further 4.4kWh/d/p by 2025 [9v5c9my] but little growth beyond that. Geothermal energy is low quality, producing lots of hot water for disposal. Ideally, better use of this hot water in co-located industry would improve overall efficiency.

Summary: There’s definitely potential here – but remember that even if we built every geothermal plant in the pipeline it’ll only ever make up about 8-9% of our overall energy supply.

Further Reading:

UCSD Professor Tom Murphy of Do The Math does the numbers on global geothermal potential.  

Arctic meltdown: two views and a bit of PIG

[youtube http://www.youtube.com/watch?v=G08xPmxR28U&w=480]

From NASA’s Earth Observatory Youtube channel: a great video showing the calving of this year’s Petermann Ice Island. Most impressive is the speed with which it passes down the Nares Strait. And to provide a little North-South symmetry, today’s EO Image of the Day shows the steady enlargement of a giant crack in the Pine Island Glacier in West Antarctica, which will calve the biggest piece of PIG in recent history, sometime soon.

For a somewhat different reaction to what’s going up North, try this video from Greenpeace’s Save The Arctic campaign. Great fun…

[youtube http://www.youtube.com/watch?v=ZOHKu2vFp34&w=480]

Brother, can you spare $3.10 for a tonne of carbon dioxide?

cup of coffee In which Mr February (aka Simon Johnson) looks at the uselessness of the report of the Finance and Expenditure Committee on the Climate Change Response (Emissions Trading and Other Matters) Amendment Bill, people begging on Lambton Quay in Wellington, and the fact that the spot price for a tonne of carbon dioxide is the same as for a flat white.

Have you heard the old Tin Pan Alley song “Brother can you spare a dime?” The experience of poverty and the Depression in America summed up in a popular song. The lyrics were written by Yip Harburg, and the music by Jay Gorney in 1931. The version by Al Jolson is very well known, but I like this version by Charlie Palloy and his Orchestra.

I usually start most weekdays getting off a bus on Lambton Quay. From the bus stop I walk along to work looking forward to the first coffee of the day. I usually note how many people are begging. There are almost always a few people begging on Lambton Quay. Who says NZ is not in a depression? Not Paul Krugman. ‘Brother can you spare a dime’ is alive and well.

Except it’s sad cardboard signs saying ‘Homeless and need help’. Also it’s at least $3 to $4 for a coffee, not a dime. Not for a long time.

The other price that’s less than the cost of a flat white is the spot price of carbon dioxide in NZ. Carbon trader OMF reports spot prices each day at CommTrade Carbon. Guess what? The last trade of a New Zealand Unit (a tonne of carbon dioxide) was $3.10.

Continue reading “Brother, can you spare $3.10 for a tonne of carbon dioxide?”

Sustainable Energy NZ #2 – How much dam energy is there anyway?!

Welcome to the second post in the Sustainable Energy without the Hot Air – A New Zealand Perspective series. Today we’ll be crunching the numbers on hydroelectricity potential in New Zealand. For the background to the work and an explanation of the methodology, please visit our last post here. Remember that we are looking for around 55 kWh/d/p from renewable sources to replace what we currently use today. So, with that, today’s post!:

At the moment, ~15kWh/d/p of New Zealand’s energy comes from hydroelectric generation. How much more is feasible? For the United Kingdom, MacKay simply does back-of-the-envelope calculations, but because of widespread hydro-electrical use in New Zealand, there are reports that allow us to make a more complete assessment of hydroelectric potential. [8k8vf25] and [9nvw27h]. Firstly, I discount any scheme that would be in a National park, or protected by a strong Water Conservation Order (e.g. Motu), or extremely remote. Some 34 schemes of >20MW capacity have already been identified as economically and technically feasible (e.g. Mokihinui River). These deliver a potential of 10kWh/d/p. on top of the 15.4kWh/d/p already commissioned. 26% of that is from North Bank Tunnel project in the Lower Waitaki and a further 22% comes from four possible schemes on the Clutha River.

Continue reading “Sustainable Energy NZ #2 – How much dam energy is there anyway?!”