
![]() The earlier sections of the Copenhagen congress synthesis report are, in this final section, summed up in forthright terms: “business-as-usual is deadâ€. Small marginal changes to the way society currently operates socio-economically and technologically won’t keep climate change within the 2 degree guardrail. Section 5 of the report affirmed that the tools are available for the transformation needed. Section 6 focuses on how societies can be engaged in making the transition to a more sustainable future. This has to be done on many scales, from individual to institutional and governmental, and at many levels, from changes in everyday behaviour to a reexamination of core values, beliefs and worldviews. It lies in the domain of the humanities and social sciences, which were represented at the congress.
The earlier sections of the Copenhagen congress synthesis report are, in this final section, summed up in forthright terms: “business-as-usual is deadâ€. Small marginal changes to the way society currently operates socio-economically and technologically won’t keep climate change within the 2 degree guardrail. Section 5 of the report affirmed that the tools are available for the transformation needed. Section 6 focuses on how societies can be engaged in making the transition to a more sustainable future. This has to be done on many scales, from individual to institutional and governmental, and at many levels, from changes in everyday behaviour to a reexamination of core values, beliefs and worldviews. It lies in the domain of the humanities and social sciences, which were represented at the congress.
Thin ice #2
New analysis of Icesat data by a NASA team headed by Ron Kwok shows that from 2004 to 2008 Arctic winter sea ice “thinned dramatically”. Icesat measures the “freeboard” of the sea ice, the amount above water level. The graph below shows the extent of the decline, which is most marked in multi-year ice (ice that survives more than one summer).

[Click image for bigger version]
In 2003, 62 percent of the Arctic’s total ice volume was stored in multi-year ice, with 38 percent stored in first-year seasonal ice. By 2008, 68 percent of the total ice volume was first-year ice, with 32 percent multi-year.
The information on ice thickness is critical to understanding what’s going on in the Arctic, as Kwok notes:
“Ice volume allows us to calculate annual ice production and gives us an inventory of the freshwater and total ice mass stored in Arctic sea ice,” said Kwok. “Even in years when the overall extent of sea ice remains stable or grows slightly, the thickness and volume of the ice cover is continuing to decline, making the ice more vulnerable to continued shrinkage. Our data will help scientists better understand how fast the volume of Arctic ice is decreasing and how soon we might see a nearly ice-free Arctic in the summer.”
NASA also provide some very nice visualisations of the data: animations of the changes in autumn and winter ice thickness as well as still images. Well worth a look. For more about NASA’s work on thickness, check this earlier post.
Also well worth checking out: The Standard posts a report a lecture about Andrill and the West Antarctic ice sheet by Prof Tim Naish. Earlier in the week, the Herald also reported on a lecture by Prof Peter Barrett that covered similar ground. I’m hoping to persuade the good professors to provide more detail here sometime soon…
The thin ice of a new day
 The National Snow and Ice Data Centre (NSIDC) has just published its July sea ice news update on the state of the Arctic and the progress of the melt season. Under the heading Melt season in high gear, it gives an overview of June events, and the conditions at the start of the period of most rapid melt. Most interesting is their comment that weather patterns over the month were similar to those of 2007, when the record minimum was set:
This contrast between high and low pressure is broadly similar to the atmospheric circulation pattern that set up in 2007. In 2007, that pattern contributed to a significantly accelerated decline in ice extent during July, and a record minimum low in September. Will the same acceleration in ice melt occur this year? If so, a new record low minimum extent becomes more likely. So far, an acceleration has not been observed.
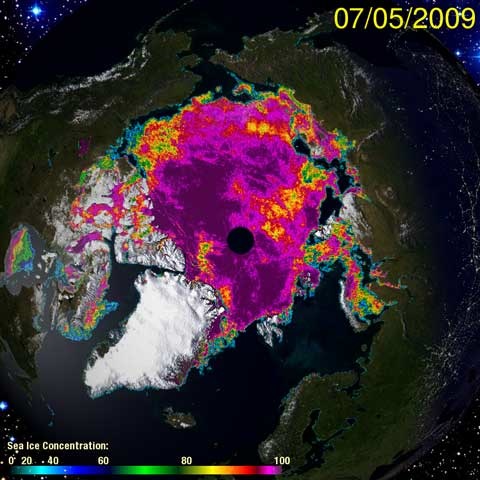
On the other hand, a peek at the IJIS graph shows that 2009 (red) has dipped below last year at the same time, and Cryosphere Today is showing large areas of ice break up (click on the thumbnail above for a larger version). CT’s metric (area, not extent) is also showing a steep decline. No sign of the fat lady yet…
The first cut is the deepest
 This week climate minister Nick Smith and international negotiator Tim Groser start their 2020 emissions target roadshow, ostensibly taking the pulse of the nation on the question of what target New Zealand should commit to in the run-up to Copenhagen in December. Much of the argument will undoubtedly centre around the costs of taking action. The government has already signalled it won’t commit to targets likely to damage the economy, but there is a bigger question to consider — what emissions cuts does the world have to consider in order to avoid the worst effects of climate change, and how should New Zealand play its part? Any cost to the NZ economy is only a small part of that overall equation, and (arguably) not the most important. I want to examine what “the science†is telling us about a global goal and how we get there, and what that means for New Zealand. The leaflet produced to accompany the consultation process is pretty feeble in this respect, so I make no apologies for going into some detail here.
TV3 on track this time
 I was quick to condemn TV3 news for its gratuitous introduction of denialist claims into its item last week on the Greenpeace ship Esmeralda’s Pacific climate impact tour. It’s a pleasant duty to be equally quick to report that their story tonight on Oxfam’s concerns at the suffering of northern Ugandans from the effects of climate change was told straightforwardly and without any nods in the direction of denial. Mike McRoberts was on the scene and provided a report sympathetic to the plight of the unfortunate people he was taken to see.Â
Oxfam’s just-released report was the subject of the item, and it was made clear that Mike McRoberts presence in Uganda was as a result of an Oxfam invitation. It was straight reporting, in which TV3 was not itself required to take up any position on climate change, though it was clear from the manner of the presentation that they took Oxfam seriously. And they went to the trouble to make the report available on their website.
 I hope it means that TV3 has given up the notion that because it is reporting an organisation that takes climate change seriously it needs to insert a caveat that some don’t.