
 Don Easterbrook was forthright in his attempt to rebut my discovery that he had used an edited version of a graph of Holocene temperatures originally prepared by Global Warming Art in his recent Heartland conference presentation. He accused me of telling a “dispicable” lie, amongst other things:
The charge by ‘the truffle grower’ that I used a graph “prepared by Global Warming Art” and that I “altered it to fraudulently bolster his case” is an outright, contemptible lie. I have the entire Greenland oxygen isotope data in my computer and use it extensively to plot data, so why would I use anything else? The data I use has never been altered in any way.
Unfortunately for Easterbrook, his own web site contains material that proves he is the one telling “outright, contemptible” lies, and defaming me in the process. Here’s why…
Diligent digging at Easterbrook’s web site by Hot Topic reader Glacier Guy unearthed the Powerpoint file for a presentation Easterbrook gave to the annual meeting of the Geological Society of America in Denver in October 2007 (go to Easterbrook’s Western Washington University page, download the pdf of the abstract to the talk entitled Geologic evidence of recurring climate cycles and their implications for the cause of global warming and climate changes in the coming century and you’ll find a link to the .ppt file there — but to save the effort, I’ve provided a direct link above). Here’s Easterbrook’s slide 17 from that talk. Readers who have been following cooling-gate will find it looks familiar:
Similar to the GWA original, is it not?:
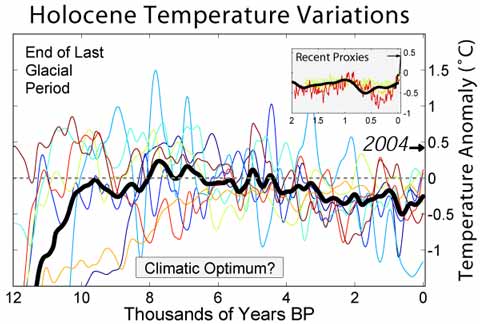
As is obvious, when preparing his 2007 presentation he couldn’t be bothered to get rid of all the temperature proxy “spaghetti” lines from Robert Rohde’s original. He just took out the inset showing “recent proxies”, drew a new baseline (based, by the look of it on an attempt to replicate the 1905 “present” he prefers to use), and labelled the Medieval Warm Period and the Little Ice Age.
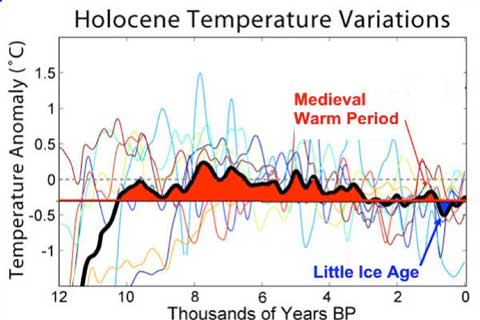
By the time of the Heartland conference, however, he’d done a little tidying up and helpfully labelled his new (and entirely fraudulent) baseline:
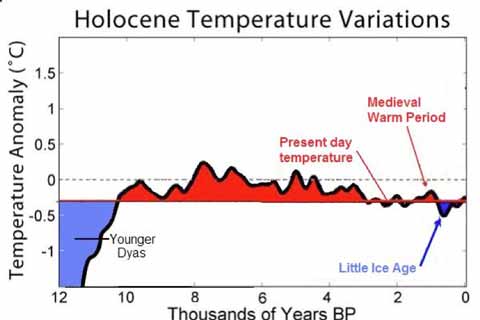
The genesis of Easterbrook’s slide at the Heartland conference is clear. He “borrowed” the Global Warming Art graph in 2007 (if not earlier), and made some crude alterations to it then. Over the years, he has refined the presentation somewhat, but compounded the fraud. That he was familiar with GWA as a source of graphical material is also confirmed by his 2007 presentation, because slide 18 is a direct lift of this GWA graph of recent temperature proxy reconstructions, edited by the removal of a data point labelled “2004”. Ring any bells?
It is quite clear from the evidence that Easterbrook has not only edited these graphics to change the information they contain, but done so in order to minimise the appearance of recent global warming and to support his own oddball contention that global cooling is about to begin. This is at the very least academic malpractice, particularly by such a distinguished professor emeritus. It might be interesting to discover what the Western Washington University thinks of his behaviour. It is also clear that his aggressive, failed attempt to rebut my original post is defamatory, as is the rush to republish his remarks by other web sites. It would be nice if Easterbrook issued a public apology to me and to Global Warming Art, but I will not be holding my breath while waiting for it to arrive. Meanwhile, the silence from the climate sceptic echo chamber about the scandal in their ranks is becoming deafening.
I suspect he'll be asking himself that…
I wonder what answer he'll give himself? :p
Hey, I just noticed – look at the blue line that bottoms out into the left top of the 'Climatic Optimum' box into the GWA original, just above the 8 in the time scale. Then look at it on the Easterbrook 2007 version…
All superfluous, of course, but still worth noting… and I couldn't resist leaving your associate Mr. Wishart a short note…
"Associate" is not, perhaps, the right word.
I did enjoy discovering that the whole operation is published by 'Howling at the Moon'!
Surely anyone can see that the missing part of the curve just *happens* to be where the box is in the other graph. It only *looks* as if it was erased along with the box. It's mere coincidence. Any claims to the contrary are pure ad hominem, conspiracy theory, and a dispicable attack on a respected scientist.
The sad thing is TS, that since denialism relies very heavily on a species of surreal ultra-relativism – a kind of pseudo post-modernism – I'm sure someone somewhere is making that case.
You also highlight the uniquely one-sided Political Korrectness they routinely enforce – it simply isn't fair to insist that those in possession of inferior, discredited or unsupported facts and/or arguments should be treated accordingly! Factism is the scourge of the modern era, it seems…
Not sure if it would be ad hominem really.
I have never claimed here or anywhere that the graphs weren't simular. Only that the changes that Easterbrook has made are justified given the use of the instrumental record to demonstrate present temperatures and the data point 2004 in the global warming art image.
Neither version is perfect of course.
'Similar'! Weasel-word of the day!
How come Ken Coffman, Easterbrook's friend, can call a spade a spade, but you're still cheerfully nuancing Spatulate Horticultural Implements?
And as for 'justified'; tell us about 1905 and it relationship to the modern era again, C3PO?!
I see you didn't get it. "Ad hominem" is a term routinely misused by the ignorant, and sometimes by those who should know better.
What do you mean "neither version is perfect"? One is a dishonest rip-off of the other! Are you totally devoid of scepticism and critical thinking?
One compares instrumental temps to proxies – not perfect. The other does not have the most recent years covered – not perfect.
We rest our cases. C3PO is a passive zealot.
The phrase "bag of hammers" comes to mind. No attempt to address the actual point at all.
Gareth nice work keeping the pressure on. Two more deceptive points I note 1) If you look at his most recent publication on his page-Climate Cycle Evidence- you will note pictures of Boulder and Easton Glacier taken from the ground attributed to John Scurlock who takes gorgeous aerial photographs not ground photographs. These ground photographs I took and he has redrawn, though correctly the terminus margins I have drawn in, and applied the retreat rates I have published for both glaciers. These two pictures are well travelled and published in many places and generally properly attributed, so I think he knows I took them. , NCGCP. . or maybe he took them from this page NCGCP retreat.. or maybe on Boulder Glacier here Glacier Perspectives He does not want to cite me thank goodness, as the paper the data is in talks about the current disequilibrium of North Cascade glaciers with the current warm climate. The second point is if you look at his journal pubs list you will note that none of the recent ones 2003-present are. They are abstracts for conferences which of course are not peer reviewed and printed as written without comment or edting by the meeting.
Thanks Mauri. More evidence that Easterbrook has a cavalier disregard for accuracy.
Here is what I just sent to the WWU President, Provost, Dept. Chair and several staff at each office:
Dear Academic Colleagues,
Are you aware that Dr. Don Easterbrook has intentionally misrepresented climatic temperature reconstructions at the Geological Society of America in Denver in October 2007 and also more recently at the Heartland Institute sponsored The Fourth International Conference on Climate Change on May 16-18, 2010?
His presentation fraud has been outed on several blogs and Dr. Easterbrook has been notified. Instead of correcting his presentation, he has chosen to dig in his heels. This flawed presentation and Dr. Easterbrook’s subsequent denial of this fraud is not helping the image of Western Washington University and its Geology Dept. For more information please see:
[split]
My recent post Offsetting the Fear of Flying
[cont.]
http://hot-topic.co.nz/cooling-gate-easterbrook-f… http://hot-topic.co.nz/cooling-gate-the-100-years… http://hot-topic.co.nz/cooling-gate-easterbrook-d… http://hot-topic.co.nz/whose-lie-is-it-anyway-eas… http://scienceblogs.com/deltoid/2010/05/don_easte…
Perhaps one of you can convince him to correct his presentation and issue a public apology in order to preserve the name of his former University?
Sincerely,
Scott A. Mandia, Professor of Physical Sciences, Asst. Chair
T-201 Smithtown Sciences Bldg., S.C.C.C.
533 College Rd., Selden, NY 11784
631-451-4104
mandias@sunysuffolk.edu http://www2.sunysuffolk.edu/mandias/
If you wish to do the same the contact info appears below:
WWW: Office of the President Contacts: http://www.wwu.edu/president/Staff.shtml
WWU: Office of the Provost Contacts: http://www.wwu.edu/provost/affairs/staff.shtml
WWU Geology Dept. Chair: http://geology.wwu.edu/dept/faculty/babcock.html
Thanks Scott. It'll be interesting to see what the University has to say…
I heard back from WWU President Bruce Shepard and he CC:ed Dr. Easterbrook. I view email exchanges as private so I will not post his reply here. However, I can summarize his concerns.
1) He is worried that there may not be enough intellectual controversy and that we may be achieving consensus with political attacks vs. intellectual debates which he believes will lead to academic rigidity and, ultimately, mediocrity.
2) He questioned why I did not contact Dr. Easterbrook.
3) He directed me to his latest post at http://www.wwu.edu/president/blog/posts/8.shtml and I concur with his sentiments as described in that post.
My recent post Offsetting the Fear of Flying
Wait, wait, wait… what? You tip this guy off to indisputable and blatant scientific fraud by one of his institution's academics and he comes back with 'I worry we may be achieving consensus with political attacks vs. intellectual debates'. Are u effin kidding me???
Perhaps it's just me to whom it hadn't occurred that manipulating data and graphics to deceive the broader public was an important part of 'intellectual debate'? And now I'm wondering, does this ass clown get the distinction between unpopular or weak academic work, and blatant fraud created with the intent to deceive on issues of profound implications on the viability of that civilization? With profound implications on the lives of people that will bear the brunt of global warming damages in the decades to come? Would'a thought a University President wouldn't require schooling on the distinction you know, but hey.
By all means though, lets not do anything hasty here that might embroil ourselves in confrontation and bring unwanted attention from the Drudge Report, least of all, you know, our jobs. Least of all worry over the academic integrity of the institution which is your charge, and academia more broadly. Far more important things are on the boil like writing inane blog posts.
How utterly depressing.
I agree. I do not think President Shepard is totally up to speed on what we are speaking about here however, as I posted later, the Geology Dept. faculty are discussing this and agree with Gareth. My hope is that President Shepard gets the correct message from them. My further hope is that the WWU Geology faculty issue a public statement about Dr. Easterbrook which supports Gareth's analysis. I think that if the Dept. as a group contacts the NY Times or other major news outlet, the story would get printed. Dr. Easterbrook has been a media darling and needs to be exposed.
My recent post Offsetting the Fear of Flying
My reply to him and to Dr. Easterbrook appears below:
Dear Colleagues,
In the words of the late Daniel Patrick Moynihan, "Everyone is entitled to his own opinion, but not his own facts."
Science progresses from intellectual conversation but that conversation must be based on fact and not willful deceit. I think your concern of mediocrity pales in comparison to the potential damage caused by dishonesty dressed up as science. Dr. Easterbrook was contacted by others and he did respond so I did not believe it was necessary to contact him. You have a loose canon on your ship and I alerted you. What you do now is certainly not up to me.
Dr. Easterbrook did reply and I will respond to him (and to all) in the next message. I do appreciate that you took time out of your day to reply to me when you could just have easily deleted the message.
My recent post Offsetting the Fear of Flying
Dr. Easterbrook also responded to me directly (and to all) because of the CC: from President Shepard. He simply attached the same .pdf file linked in Gareth’s opening sentence which, of course, does not address the concerns we are discussing. My reply to Dr. Easterbrook and to all appears in the link below:
http://www2.sunysuffolk.edu/mandias/global_warmin…
My recent post Offsetting the Fear of Flying
What is the end game here Scott? Are you trying to put pressure on Dr Easterbrook through his employer? Do you think this sends a good message to any scientists who disagree with anthropogenic climate change that if they ever present their views at any conferences this is the reception they will get? The message will be, “Ah yes it is fine to say what you want in favour of emissions reductions, make claims about polar bears and hurricanes and teach whatever you like during the day, but if you dare speak against us we will go straight to your employer with our biased and silly qualms”. I note the similar sentiment given to William De Lange on this blog a few weeks ago. I find it very disgusting the nasty lengths you lot will go to in order to intimidate anyone who disagrees with you.
Also note the graph is entirely accurate on its representation of proxy data, it only omits the instrumental record. Many would agree with this omission on scientific grounds. Figure 6.10(c) from the IPCC AR4 WG1 report (link below) shows the two do not correlate well.
http://www.ipcc.ch/publications_and_data/ar4/wg1/…
What's nasty, C3, is your apparent willingness to equate the freedom to debate with the freedom to lie. Easterbrook took someone else's graph and changed it to reflect his own views. That is dishonest. When he plots Greenland temperature data, he pretends that 1905 is equivalent to today, and that Greenland can stand in for the world. That is dishonest.
You seem to imply that I object because he disagrees with me. I object because he's being dishonest. And he is hypocritical enough to accuse working scientists of the very thing he's guilty of.
Easterbrook is perfectly free to build a scientific case to support his hypothesis, but doing it by misrepresenting the evidence will only earn him ridicule and scorn.
You change what I say.
You debate his here because you disagree – fine.
Scott M emails his employer. That is a bit far. I doubt Scott M would have done the same thing if it was not a global warming issue.
On the graphs. I don't see what is wrong with using the global warming art image and changing it to remove the instrumental data.
I haven'b been following every second of the disagreement and not sure where he has plotted greenland temp data and said it was the world. Looking at other proxies his line for today is a better comparison than that offered by GWA.
No you haven't, have you?
Where have you been, C3PO, while CRU and other AGW scientists endured a witch-hunt and endless calls for their sacking, if not imprisonment? You're aware that Virginia's AG is currently trying to secure all Michael Mann's university e-mails while he pursues him for fraud?
Where were you when Glenn Beck lamented that there 'weren't enough knives' for 'dishonoured' climate scientists to kill themselves with?
And, for that matter, where are you right now while Steve Wrathall blithely wishes the residents of the Maldives drowned because they're insufficiently 'freedom loving' for his taste?
Your claim to the 'reasonableness' of stating that 1905's temperature is a fair marker of today's is simply risible.
And the huge and highly-selective gaps in your field of vision are only become more apparent …
unfortunately I stuffed up the closing bracket at the end of the 'all' before 'Michael Mann' in the 3rd para there! Everything after that isn't supposed to be in italics!
We have been through this over and over, but it doesn't seem to be getting through. Once more, with feeling…
The line marked "0°C" in the GWA graph is the mid-20th century average from the instrumental record. Easterbrook's "present day temperature" is 0.25°C less than this average.
Are you seriously contending that it has cooled by 0.25°C since the mid-20th century?
Or are you suggesting that a reasonable definition of "present day" is the late 19th century?
No, I am saying that using the instrumental data to calculate an average current temperature and compare to variation in the instrumental record is fine. However if your goal is to compare current temperatures to those of greater than 150 years ago you need an apples with apples comparison. This is what Easterbrook’s goal was and this is what he has done.
In my view it is MBH and co that have committed scientific inaccuracy by using a proxy for part of the comparison, splicing on the instrumental record, and then declaring there is a good chance 1998 was the warmest year in the last 1000.
If you look at the below graphs from the IPCC AR4 report you will notice that proxy reconstructions do not correlate well with instrumental records for the late 20th century. The warming is aligned until about 1930 and then many proxies decline, some rise, and the instrumental records rises most sharply of all.
[cont]
[from above]
There are then three possible conclusions. Either:
a) The proxies are not accurate at high temperatures, and therefore cannot be expected to show a medieval warm period.
b) The instrumental record is flawed and should not be used for comparison.
c) Both records are flawed.
Both records cannot be correct and should not be spliced together. Mann new of the decline but chose to hide it. Easterbrook is simply comparing a uniform record and removed the inaccuracy from the comparison.
http://www.ipcc.ch/publications_and_data/ar4/wg1/…
http://www.ipcc.ch/publications_and_data/ar4/wg1/…
…and claiming the point at which he chooses to terminate the graph he's filched uncredited from someone else (and now vehemently denies – completely implausibly – that he has done so) is the modern 'global warming' temperature!
The rest is just stuff we've been over before, but it least it's been made very clear which camp you choose to believe is authoritative.
It's a waste of time arguing with you, C3PO; just as my cat would be only to happy to be fed a delicious meal but doesn't want any of the food I might actually choose to give him, despite frequent claims to the contrary you simply cannot be convinced as being unconvinced is your initial premise.
You may chose to take sides but I am not in any campt.
To my knowledge the Greenland data set ends in 1905. You are right that comparing 1905 temps to historical temps does not say anything about modern warming compared to historical warming. If you are saying that Easterbrook should have used a more recent proxy to determine present temperatures then I agree. But you seem to be saying he should have used the instrumental record presented on the GWA graph – which I do not agree is useful for comparison.
The point, C3, is a simple one. Watch Easterbrook's talk. He describes the \”1905 line\” thus: \”This the modern day temperature. From 10,000 to 3,000 years ago it was actually warmer than now.\” No caveats, no finagling with proxies, he represents 105 years ago as now, and therefore \”hides the incline\”.
So look at the purpose that Easterbrook used the graph for. Does that strike you as an honest use of the dataset? Does it show what he claims it does?
No, no, C3Po didn't say the graphs were 'similar' — C3Po said he "never claimed here or anywhere that the graphs weren't simular" — that's a Portugese word. I'm sure it makes sense to him, somehow.
Dam i so stupid. Clearly mai inability to spell proves all mai comments falss. Weal dunn Hank on correcting me their.
When an academic presents work that is both incompetent and dishonest, it discredits his employer. Are you suggesting that this is fine?
What a disgusting hypocrite you are. It's OK to attack genuine scientists, but not crackpots like Easterbrook?
Entirely accurate? That would be because it is a copy of an accurate graph. It is the alterations that are dishonest and deceitful. Can anyone really be this obtuse?
The message it sends is that some of us will no longer put up with deceit. We have ignored the lies and misrepresentation for too long thinking that the general public would see through the pseudo-science of the denialosphere.
Climategate, in the long run, will do more to hurt the Watts, Moranos, Inhofes, Cuccinellis, etc. than it did to climate scientists in the short run. It woke up the climate scientists and now they are fighting back outside of their ivory towers.
Easterbrook will have to think twice before committing fraud next time if he knows that he will be publicly outed. Gareth, keep up the pressure.
My recent post Offsetting the Fear of Flying
Meanwhile the name of Don Easterbook lives on in the annals of denialist fame. A letter in the Waikato Times tonight, directed against me, speaks of "such illustrious scientists as Professor Emeritus Don Easterbrook". Mind you it takes a few days for letters to the Times to reach publication, so perhaps since it was written Easterbrook has been disowned? Not that it would matter to the writer of the letter, who knows of 28 other scientists who have made contributions to the IPCC and have resigned because their beliefs are not consistent with non-peer reviews, distortions and exaggerated statements. He's also seen an expose of NIWA on a Canadian science blog. And he knows of a British investigative reporter who has discovered that the "mainstream" consists of an incestuous group of less than 100 scientists who promote and peer review their own work. To say nothing of the 31000 scientists who signed the petition. As one is toppled another thousand rush to fill the gap.
I dug through my email this morning look for dbunny and not Easterbrook and found one from 2007. I have supervised two of Easterbrook's students in the 1990's, though I never met Don. Joel Harper was one of them, who is an excellent glaciologist today. Anyway in looking through his presentations I see both pictures I have taken and data I have published uncited. The emails show that Don was well aware of both the pictures sources and citations for the data, but felt it imprudent to cite my work, which would shine a different light on the reason for glacier change in the North Cascade region . Below is the entire email, the top part is my reply, the bottom is inquiry. He did reply thanking me for the response.
To 😀 on Bunny [dbunny14@yahoo.com]
Don: Good to hear from you. It was a treat visiting and teaching Joel about glaciers in visiting the Mount Baker glaciers in 1990. I have continued to measure the mass balance of two mount Baker glaciers, surface elevations on three and terminus positions on all of them. I have published the results in three key articles.
Pelto, M.S. 2006. The current disequilibrium of North Cascade Glaciers. Hydrologic Processes, 20, 769-779.
Pelto, M.S. and P.L.Hartzell, 2004: Change in longitudinal profile on three North Cascades glaciers during the last 100 years. Hydrologic Processes 18, 1139-1146.
Pelto, M.S. and C. Hedlund, 2001: The terminus behavior and response time of North Cascade glaciers. J. Glaciol. 47, 497-506
The website has the information updated to the present.
You will have to give me more information about the conference. May is a tough time with the end of the semester coming then. But I would be happy to work on something with you either way.
Mauri
—–Original Message—–
From: Don Bunny [mailto:dbunny14@yahoo.com]
Sent: Mon 1/15/2007 4:34 PM
To: Pelto, Mauri S
Cc:
Subject: Mt Baker glaciers
Hi Mauri,
While in the process of compiling photos of Mt. Baker glaciers to extend the 1943-1990 data that Joel Harper and I put together some years ago, I stumbled upon your website and was pleasantly surprised to see how much work you have done. Obviously, you have already done what I was in the midst of doing!
I've grew up tromping around Mt. Baker (since about 1940) and began geologic work there in ~1957, focusing mostly on Pleistocene and Holocene glacial fluctuations and tephra/lahar chronology. Baker glaciers were in sharp retreat as I was growing up, then began to advance when I started working there. This was apparent on air photos and one of my grad students (Joel Harper) and I were able to document changes from 1943 to 1990 on most of the glaciers, plus sporadic notes dating back to ~1900. After many years of coring tress on moraines, I'm presently preparing a manuscript on LIA fluctuations and modern changes. Rather than 'reinventing the wheel' I'd like to cite your work on glacier margins 1990-2006. Is this data published or can I cite your webpage?
This spring (May), the Cordilleran section of GSA will meet in Bellingham and I'm hosting a symposium on Glaciation of Washington, including Holocene glacier fluctuations up to 2006. I'd like to invite you to present a paper in the symposium (or alternatively, join with me in presenting the fluctuations of Mt. Baker glaciers during the past century).
With all best wishes,
Don J. Easterbrook
Thanks, Mauri. It looks as though there are a lot of "inconvenient truths" about Easterbrook's recent work.
By the way, if anyone hasn't gotten there and read up on the site, I recommend it: http://www.globalwarmingart.com
I've sent thanks and small contributions several times over quite a few years; it's quite a resource generously made available. And if you do want to use his images, each one has info attached specifying how you may use it and how to acknowledge where you got it.
A word, to the wise, is sufficient.
Are Global Warming Art and Wikipedia aware of this issue? Since Easterbrook's graphics do not acknowledge the source, they appear contrary to the policies of both.
I have emailed GWA, but RR has not yet responded.
I'd like to think that WWU would censure Easterbrook for his clear disregard for scientific ethics, but Academic justice moves slowly at best, and because of the rules of academic freedom, have a high bar for any significant punishment or reprimant. I am aware of even more eggregious fraud than Easterbrook's, and even those cases didn't result in any reprimands of the faculty in question.
For what it's worth, I know of no rigorous, publishing paleoclimate geologists or climate scientists who give Easterbrook's ideas any credence. As I've said previously, none of his ideas on climate change will ever survive rigorous peer review because of the poor science and misrepresentations at least. Sadly, that won't stop his presenting talks at scientific conferences, because the abstracts aren't reviewed for content. Too bad the broader media don't understand that distinction.
By the way, Gareth, maybe you should make a 3-frame blink that shows the evolution of Easterbrooks putative "Greenland climate record," from the original GWA version, to his tracing of it and changing the zero line (but still with the background spagetti) and finally to his Heartland 2010 figure. And maybe some of the other graphs that he has copied and manipulated (nearly always without attribution). Sort of a "Greatest Hits" wall.
And I would also like to throw support to Mauri's post about Easterbrook's penchant for presenting other people's work without attribution, or even claiming it as his own. He's done it time and again with both his student's work, as well as other scientists. Citing others work, even in talks, is a fundamental tenant of the scientific method. The pay sucks…getting credit for our work is one of the few benefits we get!
Thanks Glacier Guy for the support. I just wanted to point out the work involved in getting the pictures and measuring the actual retreat of Boulder Glacier . In 1988 a mini-lahar forced us to rapidly flee the terminus area, my camera did not make it, no pics from that year. Did mark the terminus position well. In 1993 one of our four team members was in tears the hike in was so brutal, with the downed trees, heat and bugs on the unmaintained trail. The 1998 picture it snow and rained all day, of course we were wet from the brush before even reaching the glacier. In 2003 the conditions were nice and there were no complaints. No quick download to be had in this fieldwork.
I have received communication from the UWA Geology Dept. faculty and they appear to agree with Gareth and not with Easterbrook.
Scott A. Mandia, Professor of Physical Sciences
Selden, NY
Global Warming: Man or Myth?
My Global Warming Blog
Twitter: AGW_Prof
"Global Warming Fact of the Day" Facebook Group
My recent post Offsetting the Fear of Flying
[continuing from very indented thread]
C3, you have to bear in mind that there are two versions of Easterbrook's graph – the original slide 9 that Gareth first posted about, and the "rebuttal" version that is a hastily re-purposed slide 4 made to look as if it was the slide 9 graph.
Let's address the rebuttal version first. This is the graph that is taken from the single Greenland ice core. In no way does this represent a global temperature reconstruction, as it is a record of the temperatures at a single location, and a very cold location at that. You can see this quite clearly from slide 4, which includes the vertical scale. Easterbrook has the "present day" line at about -32.5°C, and it is clear that he derives this value simply by drawing a horizontal line from the last data point, which is 1905.
So we can ask a few questions about this graph:
Is it fair to compare the current global temperature record against this graph? No, because it is not a global reconstruction.
Is it fair to compare the local instrumental record against this graph? Absolutely, because that is how the ice core proxy was converted into °C in the first place. You can see this from the station record that Gareth posted earlier. If the 20th century average temperature for this station is -30°C, and the anomaly for 1905 is -2.5°C, then the 1905 temperature here was… -32.5°C, just as Easterbrook drew.
Is Easterbrook's "present day" line on this graph a fair representation of today's temperatures for central Greenland? Absolutely not – as discussed above, his line is 2.5°C below the actual present day central Greenland temperatures.
So Easterbrook's conclusion that "it has been warmer than today for most of the last 10,000 years" cannot be supported by the rebuttal graph.
[cont]
Secondly, there is the slide 9 graph, which it is very clear now is an edited form of the GWA graph.
First off, note that this is an anomaly graph. 4 of the 8 proxies used in this reconstruction are from ice cores, and so are going to represent quite low absolute temperatures. The other proxies are sediment cores and pollen distribution, so would represent much higher absolute temperatures. The reconstruction average (the thick black line that Easterbrook used) is not calculated from the average of the absolute temperatures, but from the average of the anomalies. Each proxy is defined as anomalies from its own baseline, i.e. the average of the proxy itself over the period 100-6000 ybp. This means that all of the proxies are now defined in terms of anomalies that relate to a common baseline, so they can then be averaged to produce the thick black line.
Now, Rohde then had to try and relate these anomalies to present day temperatures. The 0°C line at that point was arbitrary – he had to adjust it so that it aligned with instrumental records. The instrumental record only goes back 150 years give or take, so that wouldn't be long enough to provide good enough alignment. So he took three of the high-frequency, short-term proxies from here, and used those to align the 0°C line.
The 0°C anomaly from those short-term proxies is aligned to the mid-20th century average from the instrumental record, because that's how those proxies are constructed. Take tree-ring proxies, for example. The most recent part of those proxies comes from living trees that go back a couple of hundred years. Only trees that demonstrate a relationship to the local instrumental temperature record are selected to construct those proxies, so by definition a tree-ring proxy is comparable to the instrumental record. The fact that some of the trees used have diverged away from temperatures in the last 30-40 years does not alter the fact that they were temperature-dependent in the preceding 100+ years.
[cont]
So, we can ask some questions about the slide 9 graph:
Is it fair to compare the current global temperature record against this graph? Absolutely, because the 0°C anomaly in this graph is aligned with the 0°C anomaly from the instrumental record.
Is Easterbrook's "present day" line on this graph a fair representation of today's global temperatures? Absolutely not. The average anomaly from the period 1971-2000 is 0.23°C above that 0°C line, whereas Easterbrook's "present day" line is 0.25°C below that line. The most recent 30-year period for which that line would be valid is 1891-1920.
Is the graph itself a fair representation of the last 10,000 years? No. Rohde himself explicitly warns against treating this as an accurate representation of global Holocene temperature. It is merely representative of the temperature variations to be seen in the various proxies. In particular, Easterbrook's current version of this graph, where he has erased the actual proxy lines (cf his 2007 version), does not indicate the uncertainty ranges. You can see from the original that the "true" temperature could quite easily have been warmer or cooler than the reconstructed average.
So Easterbrook's conclusion that "it has been warmer than today for most of the last 10,000 years" cannot be supported by the slide 9 graph either. His representation of "present day" temperature on that graph is most certainly incorrect.