
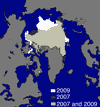
 The National Snow and Ice Data Centre announced today that this year’s Arctic sea ice minimum extent was likely to have been reached on September 12. It’s the third lowest minimum in the record, behind 2007 and 2008. The image at left shows this year in white, compared with 2007 in darker colours. From the report:
On September 12, 2009 sea ice extent dropped to 5.10 million square kilometers (1.97 million square miles). This appears to have been the lowest point of the year, as sea ice has now begun its annual cycle of growth in response to autumn cooling. The 2009 minimum is the third-lowest recorded since 1979, 580,000 square kilometers (220,000 square miles) above 2008 and 970,000 square kilometers (370,000 square miles) above the record low in 2007. The 2009 minimum is 1.61 million square kilometers (620,000 square miles) below the 1979 to 2000 average minimum and 1.28 million square kilometers (490,000 square miles) below the thirty-year 1979 to 2008 average minimum.
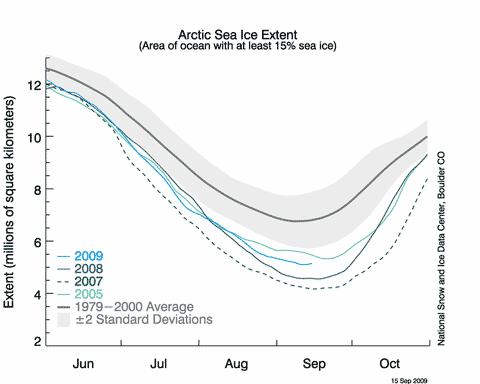
This NSIDC graph gives a very good idea of what’s been happening this year. 2009 has never looked much like beating 2007, but until mid-August it was giving 2008 a run for its money. However, a relatively cool summer and winds during August that dispersed the ice held the minimum extent above last year.
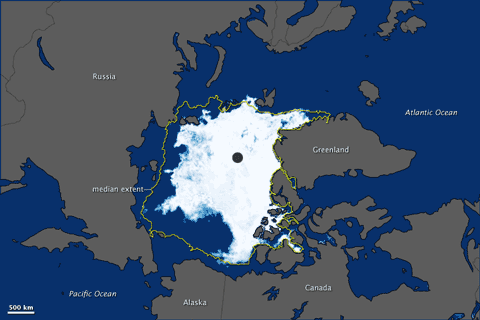
[Update 19/9] NASA’s Earth Observatory posts this graphic of the ice distribution on 12/9:
The usual suspects will no doubt trumpet this as a “recovery”, but the NSIDC team don’t think so:
While the ice extent this year is higher than the last two years, scientists do not consider this to be a recovery. Despite conditions less favorable to ice loss, the 2009 minimum extent is still 24% below the 1979-2000 average, and 20% below the thirty-year 1979-2008 average minimum. In addition, the Arctic is still dominated by younger, thinner ice, which is more vulnerable to seasonal melt. The long-term decline in summer extent is expected to continue in future years.
To give you an idea of what the sea ice looks like at the moment, I downloaded this image from NASA’s MODIS Rapid Response System site, and cropped it down to show the sea ice edge in the Beaufort Sea to the northwest of the Canadian archipelago:
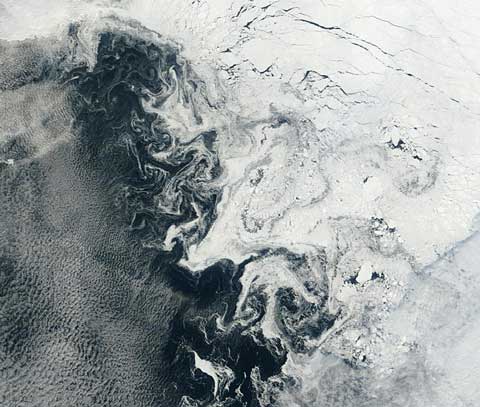
A commenter at RealClimate has described this sort of ice as frappuccino, and you can see what he meant. Working out the figures for ice extent and area looks to be non-trivial — but it’s also clear that away from the edge (if you can work out where that is) the ice is highly fractured and mobile. If you scan through the satellite images it’s clear that large swathes of the Arctic are in this sort of condition.
It’s still possible that the extent line could dip down lower (it did in 2006, for example) but the autumn freeze-up is also going to be interesting to watch — as will the various post mortems from teams working in the field. I’ll provide more coverage as the northern autumn progresses, and watch the Hot Topic Twitter feed for interesting links as I find them.
And finally: 2009 demonstrates once again that I’m a mug punter when it comes to betting on sea ice. I’m on the losing side of my wagers with Malcolm and Stoat, but I doubt that either of them will gloat. I hope not, anyway… 😉 At this stage it’s far too early to call the odds on 2010, but if we get a warm Arctic winter and spring (and the current El Niño continues to boost global temperatures), then 2007’s record could fall. The key question is how much (if any) thicker sea ice has reformed over this cool summer, and for an answer we’ll have to wait for researchers to do their sums.
Hmm. Knock wood, it looks like I’m likely to win my bet with Connolley. Posted my update before seeing your post here.
I’ll be going in to it at more length at my place. But, to the extent a more or less correct prediction (I said 4.92 million km^2, 0.47 million km^2 standard error) says correct prediction method, it also says that this year is nothing like a ‘recovery’. It’s actually pretty close to my guess, less than 1 s.d. over, while the previous two years were 2-3 s.d. below — outrageous events coming from singular circumstances.
I don’t know, or care, about record individual days. As you show, and I mentioned at my place, one good storm could rewrite the extent figures dramatically in the next few days — compacting all that frothy ice in to the main body of the ice pack. But the month average figures are still remarkably below climatology (however you choose to define climatology).
I tend to view the sea ice as a reservoir of cold — a buffer against sudden change, because there’s a lot of heat required to over come the enthalpy of fusion. Once that big buffer’s gone, it takes a lot of cooling to put it back, a lot of ice growth over winter. As the reduction in ice volume noted by Ron Kwok et al at JPL (they should have the winter 2009 numbers soon) shows, the reservoir’s been leaking.