The Climate Show #14: volcanoes, black carbon and crocks from Christy

A busy news week sees Glenn and Gareth discussing volcanoes in Chile and Africa, busy pumping ash into the atmosphere and disrupting flights in South America, Australia, New Zealand and the Middle East, an extreme spring in the USA, drought in Europe and a warm autumn in NZ, a new UN report on black carbon and how a reduction could cut future warming, Aussie scientists fighting back against climate denial, and forecasts for the summer ice minimum in the Arctic. John Cook from Skeptical Science deals with their new series on John Christy’s climate crocks, and introduces a great new graphic front end for the SkS climate literature database, plus we cover price reductions on solar panels, LEDs on streetlights in San Francisco and MIT’s Cambridge crude.

Watch The Climate Show on our Youtube channel, subscribe to the podcast via iTunes, or listen direct/download here:

The Climate Show

Follow The Climate Show at The Climate Show web site, and on Facebook and Twitter.

Continue reading “The Climate Show #14: volcanoes, black carbon and crocks from Christy”

This year’s model

Take MIT’s global ocean model, assimilate data from NASA’s fleet of satellites, and run the whole thing through two of the world’s most powerful supercomputers on a much more detailed grid than used before, and you get this stunning animation of ocean currents from 1994 to 2002. It makes fascinating viewing: look for the complex whorls of currents to the southwest of NZ, or the loops of the Gulf Stream (red/white is fastest moving water).

This sort of detailed ocean modelling is important for capturing the interactions between atmosphere and ocean: useful for improving weather forecasting on short and medium term timescales, as well as improving climate projections on regional scales. NASA JPL press release here.

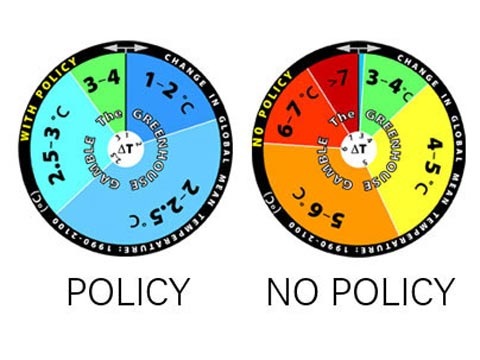
Spinning wheel…

MITroulettebig.jpg

Feeling lucky? Spin these roulette wheels and see where the future lies: on the left, if the world takes decisive action to reduce emissions over the next 100 years, and on the right if we don’t. If we do: most likely an increase of 2 – 2.5ºC. If we don’t: most likely is 5 – 6ºC. Produced by the Joint Program on the Science and Policy of Global Change at MIT, the wheels are a novel way to express the uncertainties associated with projections of future climate and the way they interact with policy decisions. The message for policy makers is clear, according to study co-author Ronald Prinn:

“There’s no way the world can or should take these risks,” Prinn says. And the odds indicated by this modeling may actually understate the problem, because the model does not fully incorporate other positive feedbacks that can occur, for example, if increased temperatures caused a large-scale melting of permafrost in arctic regions and subsequent release of large quantities of methane, a very potent greenhouse gas. Including that feedback “is just going to make it worse,” Prinn says.

For a reminder of just what six degrees means, I recommend Mark Lynas. George Monbiot suggests that climate cranks will object to model projections like these:

Climate change deniers hate these models. Why, they say, should we base current policy on scenarios and computer programmes rather than observable facts? But that’s the trouble with the future: you can’t observe it. If you reject the world’s most sophisticated models as a means of forecasting likely climate trends, you must suggest an alternative. What do they propose? Gut feelings? Seaweed? Chicken entrails?

Tea leaves, obviously…

[Blood, Sweat & Tears]