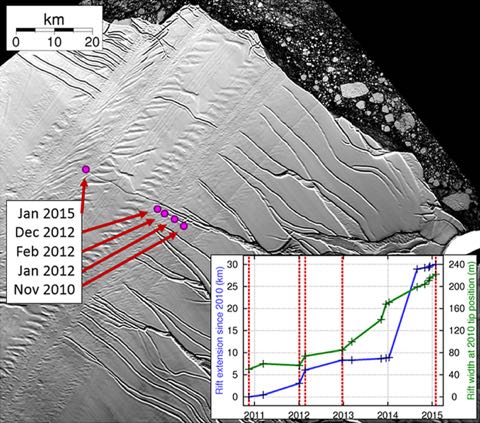
The Larsen C ice shelf on the east coast of the Antarctic peninsula is primed for a giant iceberg calving event, and could be heading for total collapse — similar to the fate of the Larsen B ice shelf in 2002, according to scientists monitoring the ice. A huge crack (above: hover over the picture for the full caption from the paper) is propagating northwards at an accelerating rate, and could give birth to ice islands of between 4,600 km2 and 6,400 km2 — equivalent to three or four Stewart Islands floating out to sea — according to an open access paper, Jansen et al, Newly developing rift in Larsen C Ice Shelf presents significant risk to stability ((The Cryosphere Discuss., 9, 861–872, 2015)) (full pdf), published last month.
From the paper’s conclusions:
It seems inevitable that this rift will lead to a major calving event which will remove between 9 and 12 % of the ice shelf area and leave the ice front at its most retreated observed position. More significantly, our model shows that the remaining ice may be unstable. The Larsen C Ice Shelf may be following the example of its previous neighbour, Larsen B, which collapsed in 2002 following similar events.
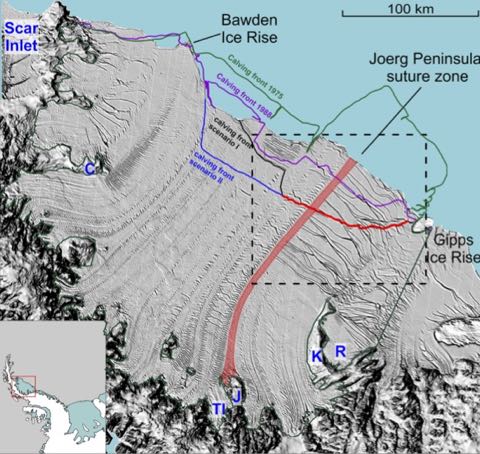
The Larsen C ice shelf has been thinning over at least the last decade, and has shown signs of surface melting. Jansen et al developed two calving scenarios — shown below — and analysed the results with a model of the ice shelf.
For a good overview of the current state of our knowledge of Antarctic ice melt, see The big melt: Antarctica’s retreating ice may re-shape Earth from the Associated Press, which tipped me off to the Larsen C story. Larsen C is the most northerly of the remaining major Antarctic ice sheets, and the last remnant of an ice shelf that until 1995 stretched up to the tip of the east coast of the Antarctic Peninsula. After the collapses of Larsen A and B, the glaciers feeding the shelves were observed to speed up — increasing the overall ice sheet mass loss. While the loss of the ice shelf won’t itself cause any sea level rise — because it’s already floating — the resulting speed up will increase sea levels.


You must be logged in to post a comment.