 Interesting times in the Arctic, as spring turns into summer and the sea ice melts towards its summer minimum. Will this year’s minimum be a new record, or will the ice bounce back towards the long term (but still downward) trend? The first scientific forecasts of the season are expected soon from the Sea Ice Outlook project coordinated by ARCUS, the first yacht has set sail for an attempt to get through the Northwest Passage, and the usual suspects are insisting that the ice is continuing to recover. So what are the odds of a new record this year, and how is the ice really doing at the moment? The picture’s mixed…
First stop: More Grumbine Science, where Bob Grumbine has posted his forecast for the year. He begins with an excellent overview of the difference between ice area and extent, and explains why extent is the more consistent measure. His expectation?
The prediction is: 4.92 million km^2, with a standard deviation to it of 0.47 million km^2. 2008 showed 4.67 million km^2, and 2007 showed 4.30 million km^2 for the month’s average.
So, slightly more than last year, but not a bounce back to the trend. And his model (which will feature in the SIO project) gives us another date to play with:
I’m not saying that the sea ice is ‘recovering’. Actually, if my method (which, notice, I haven’t told you what it is) is right, then I also expect the Arctic ice to be going to zero sometime after 2022, which is on the early end of estimates.
When the SIO’s first round of forecasts are released, we’ll see where Bob’s forecast fits into the pack, but for the time being his call makes my double or quits bet with William “Stoat” Connolley look fairly expensive. And 2022 is certainly on “the early end” of forecasts – only Maslowski’s 2013 beats it, and he’s been fairly quiet recently.
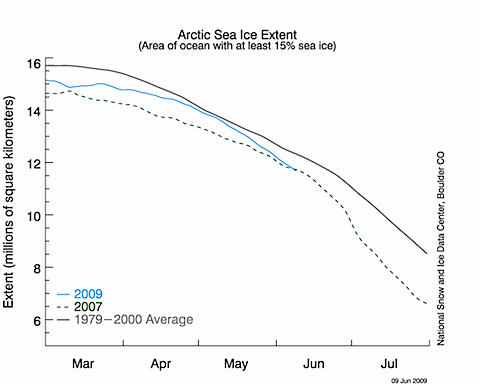
Next stop: the National Snow and Ice Data Centre and its updated daily time series of ice extent (also on this regularly updated news page). Here’s what the chart looks like at the time of writing (11/6/09 NZ):

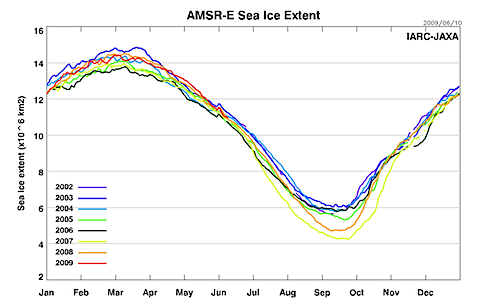
Back at the end of April, we can see that the extent got pretty close to the 1979-2000 average, prompting all sorts of crowing from the cranks that the ice was “back to normal” or “recovering”. Since then, the last 30 days have seen very fast loss of ice – certainly the fastest at this time of year in the last six years. I checked the data (I used IJIS figures, they can be easily accessed here): as of June 9th, the preceding 30 days had seen a melt of a shade over 1.69m km2. By way of comparison: the same figure in 2008 was 1.49m km2, 2007 1.26m km2, 2006 1.1m km2, 2005 1.55m km2, 2004 0.9m km2 and 2003 1.06. In other words, the current melt is rapid, and the overall extent is now down at the levels that preceded the last couple of record minima, as the IJIS graph shows:

2009 (in red) is now back in the middle of the pack, after being above the rest through late April and early May. However, there’s a caveat to consider. At this time of year, there’s very little correlation between the current ice extent and the eventual minimum — you don’t begin to get reasonable predictability until the end of June. You can see this in the graph. Look at 2006 — it was below every other year right through until the beginning of July, and then the melt slowed markedly and the eventual minimum was above 2005’s (then) record. That’s why the first set of Sea Ice Outlook projections will be interesting: they are looking for models that will give them that predictability.
In the meantime, have a look at the ice maps at Cryosphere Today and the University of Bremen. These give a spatial representation of the amount of ice around in various regions: note in particular the open sea in Baffin Bay (between Greenland and Canada) which stretched from Nares Strait up towards the pole, right through Lancaster Sound to Barrow Strait near Resolute. The Seasonal Ice Outlook [PDF] prepared by the North American Ice Service (a US/Canada collaboration), goes into a lot more detail:
…these areas typically exhibit these lower ice concentrations, but much later during the spring or early summer. This suggests that a few portions of the Eastern Arctic are already showing signs of an early breakup by 3 to 4 weeks. (p14)
This is good news for sailors attempting the Northwest Passage from the east, but the Outlook has bad news about the southern route that most attempt (through Franklin Strait and Victoria Strait and round the south of Victoria Island:
… the unusual amount of old ice described earlier in Franklin Strait and M’Clintock Channel […] will most certainly prevent the clearing of the Northwest Passage for a fourth consecutive year and affect transit through the Victoria Strait region during late August and early September period.
That’s bad news for the Silent Sound and its Open Passage Expedition (proposed route here), as they note on their blog, but September’s a long way off. And perhaps they’ll be able to get round to the north of Victoria Island — the route that heavy shipping would expect to take when the passage is opening regularly.
So what about my bets on a new record? Do I feel lucky? 😉 Well, it ain’t over ’til the fat lady’s sung, and Stoat won’t be dining out on my £60 for a while yet… If pressed, I’d say the odds are still 50/50. [Standard disclaimer: I hope I lose, for all our sakes, if not that of my wallet.]
