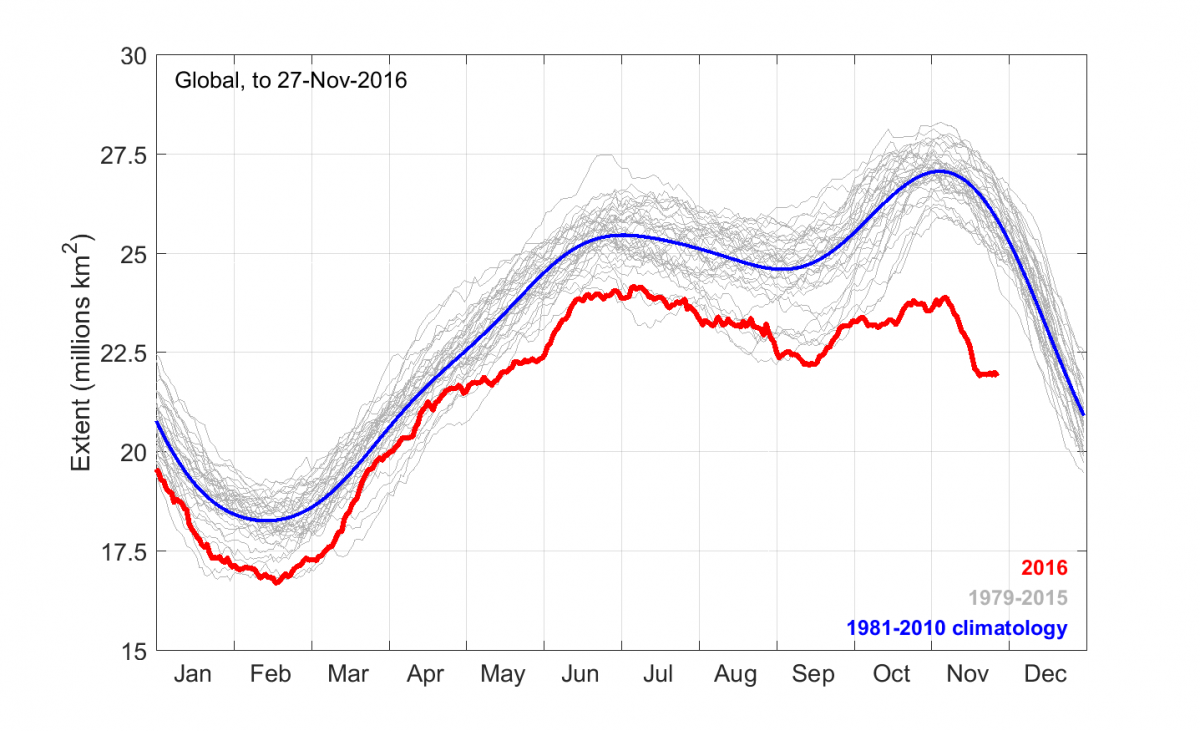
For the past couple of months, global sea ice extent (Arctic plus Antarctic) has been at record low levels. The way the northern and southern seasonal cycles add up, the maximum in global sea ice extent occurs on average in early November, at around 27 million km2. This year, the global extent curve has been relatively flat since June. In past years, climate change “deniers” have pointed to the global extent curve as a way of claiming that climate change is not a problem, as the relatively high Antarctic extent was partly offsetting the Arctic loss, making it look as though nothing much was changing. Strangely enough, we’ve heard nothing from the usual “deniers” this year! Through most of November, there has been around 4 million km2 less sea ice than normal globally (peaking at 4.5 million on 20 November), an area roughly the size of Greenland missing near each pole. What’s going on?
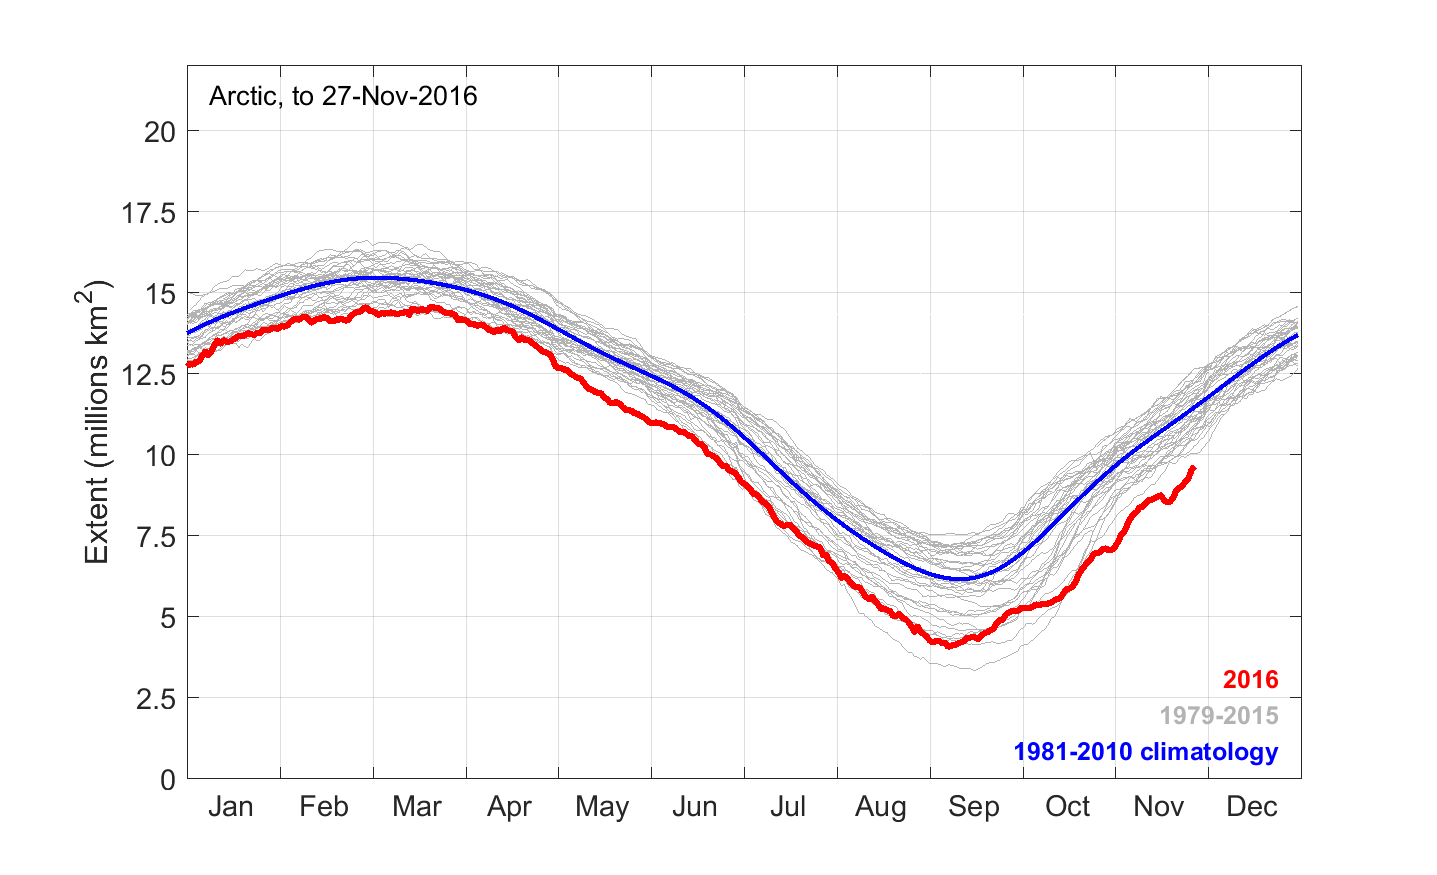
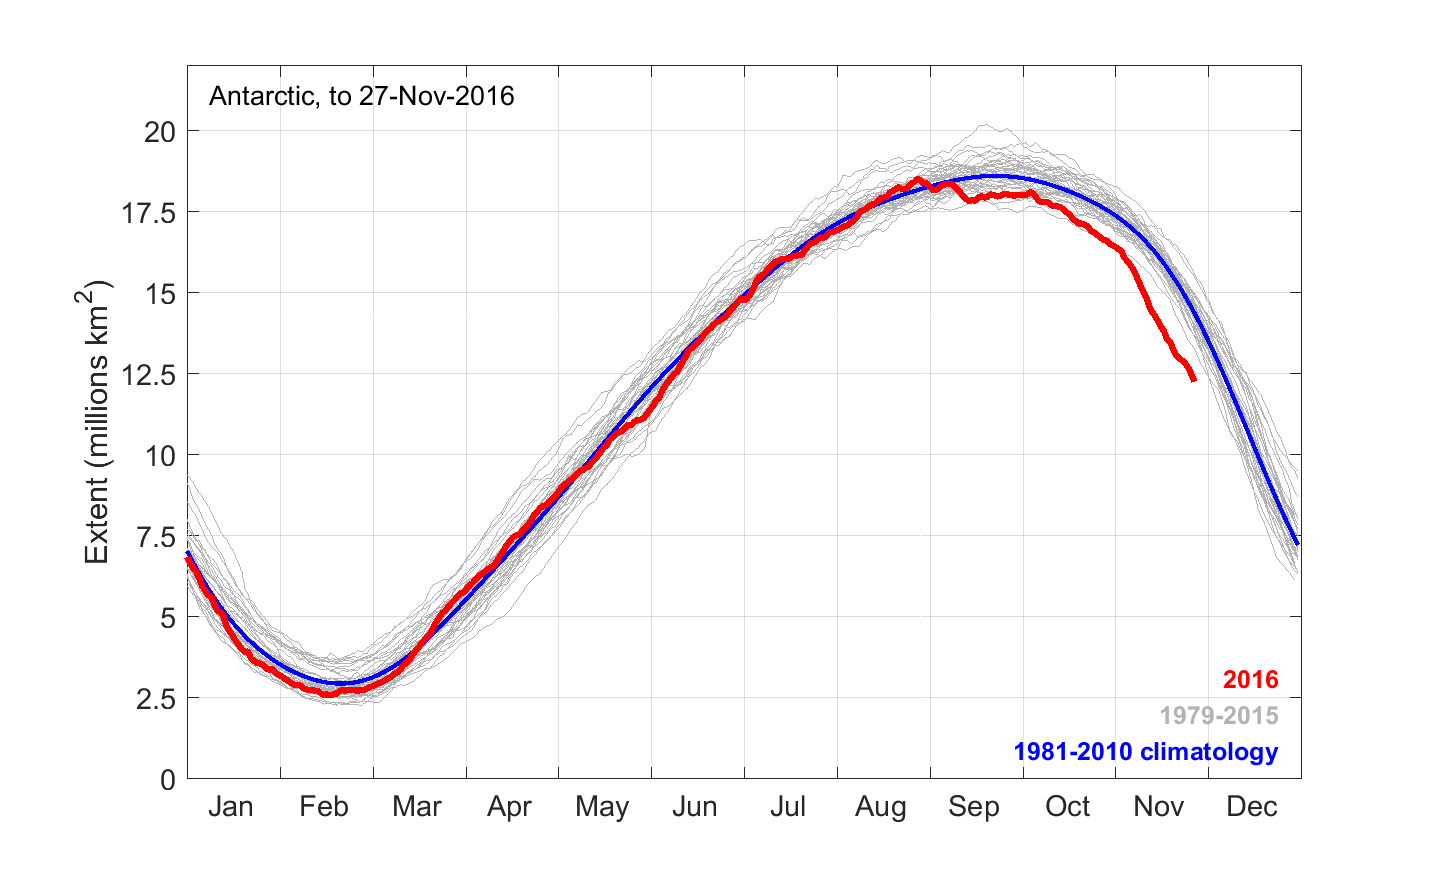
Global, Arctic and Antarctic sea ice extent. The data are from the US National Snow and Ice Data Center (NSIDC) – obtainable from http://nsidc.org/data/seaice_index/archives.html. Years from 1979 to 2015 are plotted in grey. The 1981-2010 average is shown in blue, and the 2016 curve is in red. Areal extent is shown in millions of square kilometres.
Trends in sea ice extent over the past few decades have been driven differently in the two hemispheres. The dramatic decrease in Arctic sea ice extent is all about temperature and the changing radiation budget while the small increase in Antarctic extent is all about the winds overlying the ice. The same is true this year.
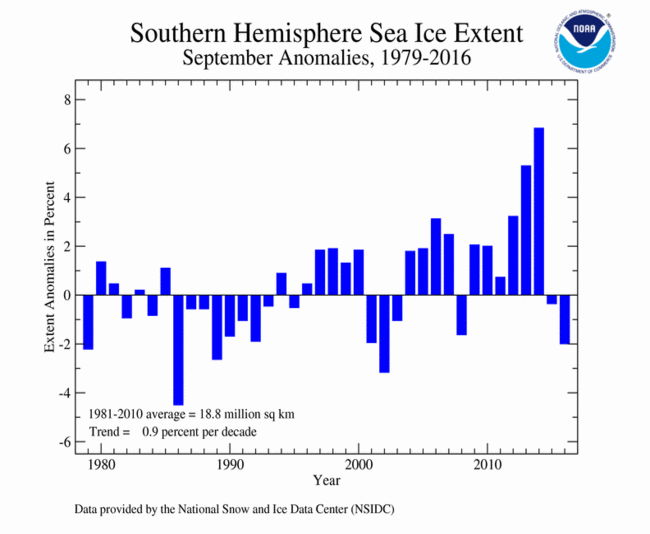
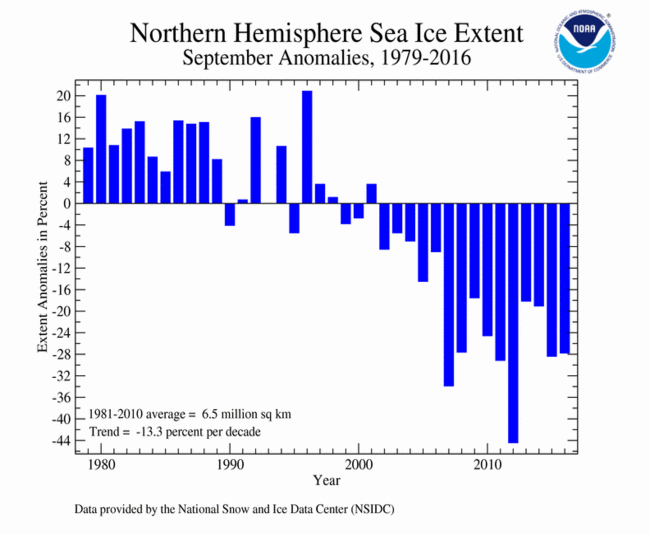
Interannual changes in September sea ice extent in both hemispheres (data from NSIDC via NOAA (National Oceanographic and Atmospheric Administration)). In the Arctic, extent has decreased ~40% since the early 1980s. In the Antarctic, extent increased ~5% through to 2014 but has since dropped back to near or below normal.
The big news has been the extreme warmth over the Arctic, up to 20°C above normal in places. The Arctic Ocean (where it’s not covered in ice) is much warmer than normal, and Arctic sea ice growth has been slow this northern autumn. Sea ice extent even decreased briefly earlier this month, at a time where the ice is normally growing steadily after the sun has gone down for the winter.
The Arctic warmth comes from a combination of factors. Low sea ice extent over the summer helped warm the surface layer of the Arctic Ocean, something that is relatively easy to do as the Arctic Ocean is stable and stratified, so extra surface heating (from sunlight and infrared radiation from the atmosphere) tends to stay near the surface, warming it quickly. Once the ocean surface warms, that extra heat lingers for months. In the atmosphere, a large persistent high-pressure system is sitting over the eastern Arctic, with low pressures over the north Pacific. That combination has drawn warm air through Bering Strait and northwards over the far north Atlantic, resulting in air temperatures well above normal over most of the Arctic. At the same time, cold air has spread into central Eurasia, bringing very cold conditions to places like Kazakhstan (schools in the capital, Astana, were closed for four days this month as temperatures fell as low as -32°C).
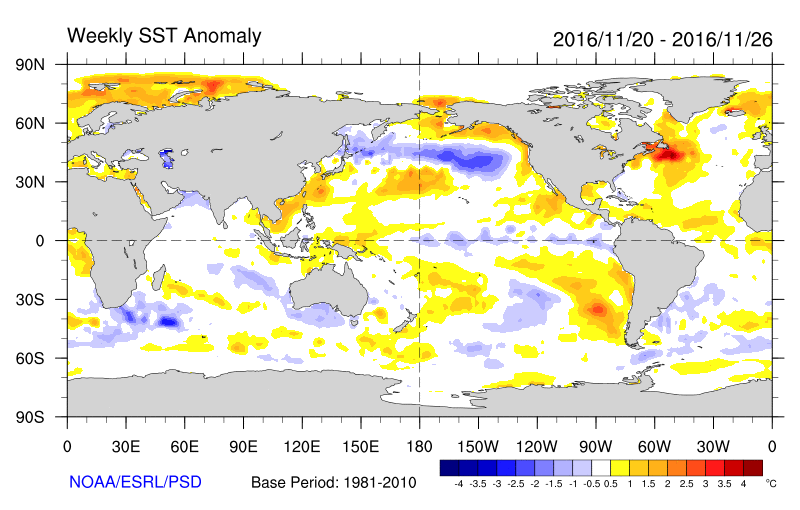
Weekly average sea surface temperature anomalies (differences from normal) globally to 26 November 2016, from the NOAA Earth Systems Research Laboratory. Arctic SSTs are 23°C above average while over the southern oceans, sea surface temperatures are close to normal overall.
Over the southern oceans, sea surface temperatures are near average and air temperatures are a mixed bag – warm in places but near normal over most regions. Here, as with recent trends, the winds are the big player, rather than temperatures. There has been a strong negative SAM (Southern Annular Mode) pattern lately (weak westerlies over the southern oceans and relatively high pressures over Antarctica), combined with a marked “zonal wave three” pattern, especially prominent during October but still visible in November. This involves three regions of anomalous high pressure around the hemisphere, with lower pressures in between. The regions of reduced sea ice line up well with the high pressure regions and their western flanks where the winds come mostly from the north, while the regions of normal or expanded sea ice line up with the low pressure regions and their western flanks where the winds are mostly from the south.
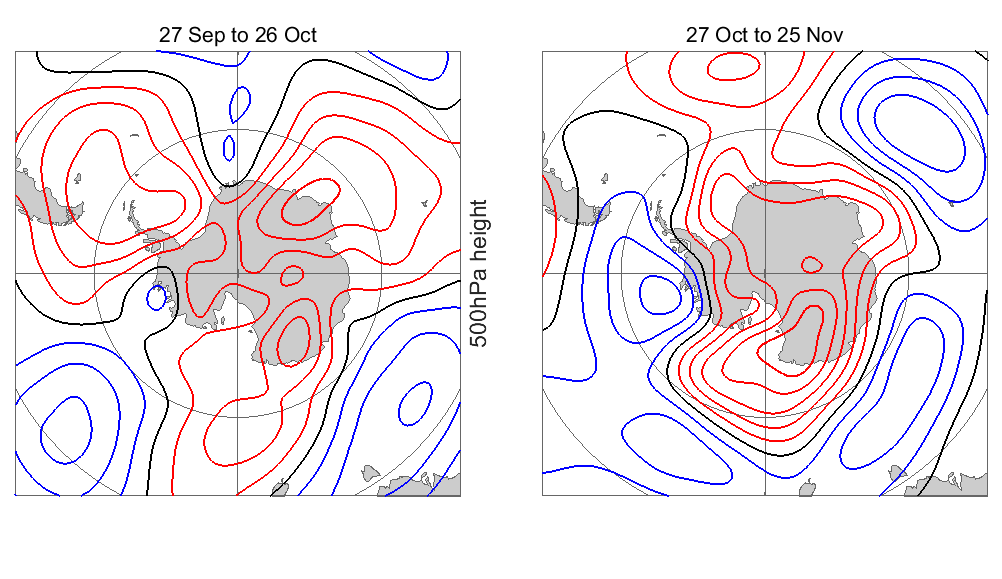
Anomalies in the 500hPa height field (analogous to surface pressure but at a level in the atmosphere above the Antarctic Plateau) for two 30-day periods, 27-Sep to 26-Oct and 27-Oct to 25-Nov 2016. Red contours show above normal heights, blue below normal and black is the zero-anomaly line. The contour interval is 25m. The “zonal wave 3” pattern is clearly visible in the October plot while during November the negative SAM pattern has been more prominent, still with a zonal wave 3 component. Data from NOAA.
Sea ice melt over the southern oceans will continue through to February. It remains to be seen whether the current early melt (total extent now is about 10 days ahead of where it would normally be) will result in a below-normal minimum or whether the melt rate will slow down over the summer months. In the Arctic, even if temperatures stay above normal, air temperatures will still be well below freezing and sea ice growth will continue through the northern autumn and winter. It’s possible that the warm ocean surface will mean that the forming ice will be thinner than normal, leading to more rapid melt next spring and an even bigger loss next year.
Since Arctic change is associated largely with warming and the feedback between ice loss and greater uptake of radiation by the ocean and land surface (the “ice-albedo feedback”), the strong downward trend in Arctic sea ice extent looks bound to continue until all the summer sea ice is lost. Meanwhile, Antarctic sea ice is more or less at the mercy of the winds and may well vary up and down for many years to come, before the overall warming trend limits the ability of ocean water to freeze.
The year 2016 is bound to come in as the warmest year on record globally, at least 1.2°C above pre-industrial temperatures. Natural variability in the form of the big El Niño of 2015/16 added to the background warming trend from greenhouse gas increase, contributing to the record lows in sea ice extent later in the year.
The climate system may well “bounce back” and produce a few cooler years, but greenhouse gas concentrations are now so high that it would take a massive volcanic eruption in the tropics to take temperatures back to even what they were in the 1980s. Getting back to pre-industrial levels is now virtually impossible without a significant reduction in the atmospheric burden of carbon dioxide and other greenhouse gases.

Tamino has a post that estimates the probability of such an occurrence at 1 in 100 billion, i.e. 6.9 standard deviations from the mean. Sea ice extent is unlikely to be a normal distribution due to feedback effects, but nevertheless the probability of such an event occurring in the absence of global warming is mind-blowing.
Indeed. Though the non-stationary nature of the climate right now throws those kind of calculations into doubt. But, super-rare in today’s climate!
With all this heat and lack of ice growth is there any news on an increase in methane release in the East Siberian and Labtev seas?
Another question. The 10% reduction in ice formation would surly mean that there is a 10% reduction in the amount of salt that drives the thermohaline deep water circulation. How long would it take for this to become apparent? Is it hydraulic and have immediate effect or would it be cushioned and take many years?
Haven’t heard anything new lately about methane release, but being monitored closely. The salt extrusion effect is pretty much immediate so it would alter the density structure in the upper ocean, presumably making the water column more stable (fresher) near the surface. The action is taking too far north to have much effect on the thermohaline circulation though, I think.
From what I’ve read, fresh water from Greenland ice melt is more likely to have an impact on the thermohaline circulation, because it’s freshening the ocean closer to the main sinking regions. IIRC there are some hints of a slowdown in the data…
The article makes the point that much of this arctic warmth stays near the surface, at least for a period of time. Could this partly explain the fact that the surface is warming faster than the middle of the atmosphere as measured by satellite?
The upper part of the atmosphere is cool only because the greenhouse gasses stop the heat escaping. All very predictable but used by deniers to say that the climate is not warming.
I just goes to show that you have to use propaganda carefully. The climate change deniers have shot themselves in the foot with their “global sea ice extent” message. But global warming proponents have to be careful not to overplay this one either, sea ice extent is highly variable and can turn very quickly.
Personally I treat the Arctic and Antarctic as separate systems. One is an ocean, the other is a continent. I guess if you wanted to track global sea ice extent, it might make more sense to align the data points by shifting them 6 months to allow for the antiphasing of the seasons. This would also get rid of the double-peak in the curve.
For this reason I argue that “carbon neutral” is not a prefered strategy as the system is not in equilibrium and “carbon neutral”, if genuine, puts carbon back into the atmosphere thus maintaining the status quo which is not in equilibrium. It is of course better than carbon positive but some widely accepted “carbon neutral” strategies have proved anything but. Carbon negative is the best strategy but where inapplicable, carbon zero is the only really useful substitute.
The full horror of the Trump agenda against the future of the planet is becoming clear.
Here is a link to leaked memo by Thomas Pyle, the President of the American Energy Alliance, a Koch Brother’s funded fossil fuel lobby organization:
https://assets.documentcloud.org/documents/3232519/Pyle-What-to-Expect-From-the-Trump-Administration.pdf
The letter lays out how the fossil fuel industry and the Koch Brother’s in particular, are now planning a complete assault on the little progress the USA has made towards reason and climate action.
More on Pile here:
http://www.sourcewatch.org/index.php/American_Energy_Alliance
http://americanenergyalliance.org/about/staff/
The Koch Brother’s and their network of conspirators is surely one of the most criminal organizations with regards to crimes against the future of this planet that there ever was.