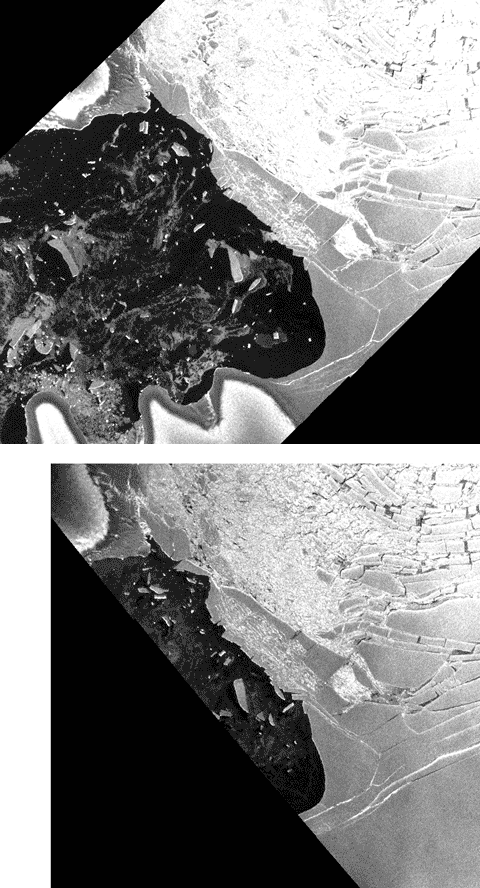
This somewhat crude(*), but effective animation of the two most recent ESA images of the Wilkins Ice Shelf break up shows clearly that with the “pin” gone, large areas of ice are beginning to move. The most recent image (April 8th) is the smaller, overlaid on one captured on April 5th. Focus on what was the narrowest part of the ice “bridge” to Charcot Island, and you can see a large berg rotating counterclockwise, while the mass of shattered ice at the original break up site and three big bergs to the east appear to be moving slowly north. To the NE of the base of the “bridge”, cracks are getting wider, while there’s also substantial northward movement in the big bergs to the north and east left by earlier collapses. It’s not clear from this pair of images what’s going on in the biggest cracks running SW/NE below the base of the “bridge”, but that will be the region to watch for the next big breaks.
[* What do you expect? GR fecit…]

A journalist I met in Bonn was talking with David Vaughn of the British Antarctic Survey.
One minute, he said, the ice bridge was just beginning to crack. The next day it had broken, and the whole ice sheet had shattered.
Images at the NSIDC are easier to understand.