
 The first set of ARCUS/SEARCH projections for the September Arctic sea ice minimum have been released, and amid all the mundane statistical, heuristical, and modelistical musing there’s a remarkable effort — and I really do mean remarkable — by one Charles Wilson. Here’s the graphic showing all of the submitted forecasts. See if you can spot Mr Wilson’s offering:
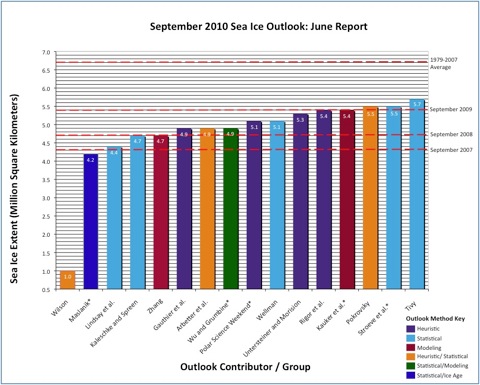
Yes, that’s him on the left. He appears to have no affiliation to any academic institution, but he is not afraid to make a very definite projection. Download the full set of forecasts [pdf], and take a look. He expects a massive melt, leaving the Arctic Ocean more or less ice-free by September. That’s pretty scary, but here’s what he thinks this may bring for the northern hemisphere. Ocean current disruptions will bring 300mph winds to the northern hemisphere:
= Destruction of nearly ALL aboveground structures North of 10 Degrees Latitude = 99% Deaths in USA, Europe, etc. within 2 years. … In the Worst Case:
Immediate Action can create Clouds with: Airplane contrails, seawater mists, or high- altitude sulfur (e.g. heightening Smokestacks at Norilsk).
But it needs to be done in the next few Weeks – – – months before we can be sure an Early Melt WILL happen.
In a comment at µWatts he expands his point a little:
If the Great Melt Off happens = Warm Currents turn around = 300 mph Winds come February or so..
Currently I give it 15%
… times 6 Billion dead.
Now that’s what I call alarmist.
There’s further coverage of the projections at Skeptical Science, and Neven’s excellent new Arctic Sea Ice blog, but to me the Proper Scientists look to have been pretty conservative. The June report is based on May numbers, so the rapid melting of recent weeks hasn’t yet been accounted for. It’ll be interesting to see how things change in the next report, due in July (I think). Put me down somewhere between Maslanik and Gauthier et al…
For a one-stop review of all the latest numbers/graphs and pictures, the aforementioned Neven has assembled a great selection here. Worth a daily visit for the next six to eight weeks, at least… Today’s notable change: the PIOMAS team have updated their ice volume graph, and it continues to drop further below trend. Perhaps Mr Wislon, who sets great store by the PIOMAS numbers, is on to something. But I hope not.
Everyone agrees that the Polar Team is careful. Let’s see what happens in the next Outlook, if 2010 keeps going like it has so far.
Great stuff to write about mystery prognosticator Charles Wilson. I have been looking all over for him, but haven’t found him yet. I’d love to have him on my blog for a small interview, so if anyone knows where I can contact him…
CW comments at µWatts (see link in post) so you could leave him a message there, I suppose. I imagine that because he describes a specific mechanism for the ice loss, they let his thoughts through… though you might wonder at the wisdom of so doing.
Yes, I saw them. I even distinctly remembered seeing them there. His comments were so ‘out there’ that the pseudo-skeptics hardly reacted, thinking probably he was one of them. 😉
I hardly ever post at WUWT since Watts decided to reveal to everyone the place where I lived at the time. I have (coincidentally) moved since then and post under a completely new pseudonym, but very rarely. It’s not much use. Besides, some people over there are doing a better job than I could ever do.
Re: µWatts. I enjoy Goddard making a fool of himself, and admire the incredible patience of posters like R Gates and Anu…
That PIOMAS drop is certainly impressive. The way they’re extending the graph bit by bit is amusing.
Does anybody happen to know what they estimate the total remaining ice volume to be?
I wonder if any of the current techniques show the 2007 crash using prior data only, and if so do any of those show subsequent similar drops.
Can’t answer the second question, but you can infer something from the average volume curve here. Eyeball suggests late June average to be about 20,000km3, current anomaly -10,500km3, so 9,500km3 left. Average Sept min looks to be about 13,000km3. Anomaly at 2007 minimum was about -7,500km3, ie 6,500km3 remaining. If 2010 anomaly stays at current levels, then there will be about 2,500km3 left in September. If what’s left is the remnant thick multiyear ice at (say) 2m thick, then you get 1,250km2 of cover. Which is roughly what Wislon is saying, except for the winds, obviously. Got any idea where he might be getting that from?
Winds like that would only be possible with a hypercane, which in turn is hypothesized to be possible only under a near-Venusian runaway. But that’s a bit obscure, so probably he’s just making it up.
OTOH: As soon as there are large enough areas of open water for long enough, it seems not implausible that a few well-timed storms could break up the remaining pack.
Also, as I compare the Bremen maps for June 24 2007 and 2010, the former still had a pretty intact central pack while the latter is riddled with areas of 70-85% concentration, notably just north of the Canadian Archipelago and getting quite close to the NP. Usually I’d be willing to chalk up that sort of thing to the wind, but that seems less reasonable since the remaining areas with intact cover are so sparse.
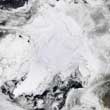
One of the NOAA webcams stationed at the North Pole seems to be showing a first melt pond.
So if you’re correct about those totals, the folks who run the PIOMAS model must not think the anomaly will hold through the minimum at anything like its current level. Interesting.
Neven, at that low angle can we be sure it’s not a lead?
Steve at #12: I suspect they did their model forecast using early May numbers, when the anomaly was -8000km3, and perhaps expected it to hold at about that level, as it had done (more or less) since 2007. If the current drop is caused by assimilating up-to-date ice conditions, then their July forecast is going to be interesting… in the Rowan & Martin sense.
(I couldn’t find a clip of “verry interrresting”, so here’s Goldie Hawn explaining time zones).
This should do, although it’s not the stripped-down version.
Thanks! Sellars makes up for it.
Meanwhile, pocket calculators at the ready…
Sept 2007 average minimum extent: 4.3 m km2
PIOMAS 2007 min volume (est): 6,500 km3
= average thickness of 1.5 m
Assume that thickness applies at 2010 minimum, and PIOMAS anomaly holds at present level, giving 2,500 km3 left in September, suggests about 1.6 m km2 Sept average minimum.
One of the teams (Kaleschke & Spreen, Hamburg & JPL) keep an updated projection available via ftp (report pdf link in the post, and scroll to their entry). Their June (based on May numbers) projection was for 4.7 m km2. Their latest projection, based on more recent numbers (23/6), is for 4.3m km2 – and we’re now at the point where the error range for their technique tightens sharply.
Steve, you had me doubting there for a minute, but I really think it’s water lying on top of ice. Otherwise the ice would have to be just a few centimetres thick for us to be able to see a lead at such a low angle, and I don’t think/hope the ice is that thin over there.
But it could be a lead.
Tighten sharply meaning…?
Based on your calculation, tf the anomaly stays this low the next set of projections should be very interesting indeed. Er, except for the low-balling amateur, I suppose, but then maybe he can provide the stupid. I guess that’ll remain the case even if he ends up being right for the wrong reasons. .
BTW, I understand from a physics grad student I know that T-shirts saying “Now, Dmitri…” are quite the popular item among the kool kidz (these being defined as physics grad students and post-docs in California).
(It’s Sellers; Sellars is the opera one.)
Typing too fast. My all-time favourite is his Strangelove version of the Beatles’ She Loves You (George Martin was Sellers’ producer before he happened on The Fabs) — “you’re not the hurting kind” “I am!”…
Sorry, error bars becoming smaller, correlation improving, etc.
“She says she luffs you.” “Ja?” “Ja, ja!” – ah, yes, truly a classic!
Always makes me laugh…
Having just gone to the live version of the North Pole web-cam, be it a puddle or a lead it appears to be getting bigger, or, at least, more clearly visible.
Interesting. The temps off the Alaska North Slope just now reached 45F, still below freezing overnight. Believe they have only exceeded freezing for a couple of weeks.
Joe Bastardi (weather person) has predicted low ice cover for September. Steve Goddard at WUWT is posting observations but not forecasts.
Lake ice takes a long time to melt even with temps well into the 50F+ range and ice-out does not occur until late May and perhaps as late as July depending on elevation. Sea ice in the Arctic is thicker due to less snow cover and earlier onset of cold and later arrival of warm.
If Arctic sea ice is indeed melting, where is the heat coming from? I assume the that the Alaska temps are reasonably representative for the land masses in Ak, Siberia, Greenland and Canada surrounding most of the Arctic Ocean, especially since many of those areas are farther north. Areas such as Hudson Bay, Bering Sea and others are expected to melt or to have wave action and current destroy the ice.
Anyway, I’ve seen warm summers where the ice remained close and tight enough to prevent ship passage and cool summers where ships passed easily. I sincerely doubt that ambient air temperature explains much of the Arctic ice behavior. Have a look at water temp and sources of heat, wind and current. The first could actually cause melt, the latter two would result more in consolidation and jumbling than melt.
FWIW, in November it is common to experience wind along the NW Washington coast in excess of 100mph. The local building code is wind load to 125mph. I’ve had that last for many hours, and many days for the power to return.
Terry, IIRC it’s well-understood that air temps aren’t a major factor. Indeed, the surface air layer can’t get much above freezing so long as there’s ice beneath it.
Clouds, currents, winds, ocean temps and black carbon deposition are all important. Note that even if air temps remain below freezing, ice will still melt very nicely if it gets enough insolation.
Just watched the Goldie clip. The writers could have done wonders with New Zealand time, but the American audience of the time was probably too insular for that. Of course the writers got it wrong anyway since the U.S. proper has more than four time zones.
Or consider Australia in summer (right to left): EST [Tas, Vic, ACT, NSW] + EST-1 [QLD], CST [SA], CST-1 [NT], then WST in WA, which is an additional -1 relative to the usual -2 for Tas Vic ACT NSW and -1.5 for SA because they decided last year they prefer their curtains unfaded.
All rather pointless, but I’m not entirely sure a Grand Unified Theorem may not lurk in that lot somewhere!
I agree with Neven that looks to be a melt pond, does not have the correct color for a lead. The last week or so has led to the rapid ice loss in the Nares Strait off of Petermann Glacier in Greenland . This is an awfully early exposure of this very thin terminus.
Thanks, Mauri. I didn’t think a lead would necessarily look dark at that low angle, but apparently so.
In other news, today’s Bremen sea ice map makes it look as if the largest remaining area of intact pack is being forced into the Fram Strait. The wind chart seemed to support that view, although of course I’m no expert.
OT: In a few minutes the Atlantic hurricane season will be off and running with the designation of the first tropical storm. Unfortunately, not only is it a Cape Verde storm (rare for June), the record amount of convective energy available in the Caribbean made it into a huge storm even while still a tropical depression (a pattern typical for the big WestPac and Indian Ocean typhoons that form in hot regions of the open ocean). On the one hand that’s good news since it may not have enough time to become powerful as well, big storms being slower to develop, but it’s a very bad sign for the season ahead. As BP skedaddles, leaving the oil to spew at its full rate for a week or more, a second potential Cape Verde storm is strengthening in the west Atlantic (albeit far enough north to be a potential threat only for Bermuda and shipping).
Update: Looks like Alex won’t get its name tonight, but expect it soon.
Most current projections have Alex headed into the Mexican coast, although a jog north after it crosses the Yucatan isn’t out of the question.
In addition to Alex’s amazing size, the size and cyclonic organization of this African wave is something not seen every day. Another very bad harbinger.
Today’s Bremen sea ice graphic shows a continuation of the trends, with a lot more yellow (~75% concentration) in the main basin and now substantial green (~50%) in the northern Canadian Archipelago. This situation looks unprecedented to my non-expert eyes. As I understand things, this sort of day-to-day change can’t be melting as such, but does indicate that the ice is thin enough to be very mobile. Exciting to watch in a grass-growing sort of way, but not good.
Speaking of the Arctic, this new Pliocene result using better-located proxies means that estimates of regional sensitivity will have to be revised upwards.
We are pushing our luck.
Just spotted this March State of the Arctic conference presentation from Maslowski (who interestingly now counts Ron Kwok and Jay Zwally among his collaborators). He’s sticking to his guns re 2016 +/- 3 years.
Meanwhile, over at billionth-Watts (time for a demotion, I say), even some of Steven Goddard’s fans are starting to notice his desperation.
NanoWatts?. Picowatts?.
Forget the billionth, I say we skip him straight to pico!
Final two sentences from the Pliocene paper Steve links to:
Another Rowan & Martin moment…
On the Maslowski: I covered that a while ago here. The Stoat wasn’t impressed… 😉
And… I’m sticking to µWatts, because I don’t want to have to learn another key combination for a funny letter… Ï€, no that’s not it… œ∑†¥ø. You see?
PS: Steve, you might find this interesting: Answer to what ended the last ice age may be blowing in the winds, paper says.
I just get a Photobucket ‘Bandwidth Exceeded’ warning on the African wave image – and there’s nothing worse than frustrated curiosity!
Aha, I’d forgotten that. I wonder if the present ice concentration trends will change his mind? (Probably not…) BTW, the site seems to imply that they’ll have video of the presentations posted soon. They have some video now, but it’s just of the main sessions.
Re the ice age paper, that leaves a final explanation of the Mid-Pleistocene Transition as the only major remaining ice age climate mystery.
Re Watts, interestingly micro is the sole numerical prefix that is expressed as a Greek letter. Pico has the same meaning as micro (“small”), but nano comes from Greek/Latin for “dwarf.” I like it! nWatts it is, although others may hold a different view.
Bill, I’ll see if I can find a more permanent link. Basically it just looks like a good-sized, slightly diffuse Cat. 1 hurricane.
.
Bill, here’s a current loop. The structure is less obvious since it’s IR, but it’s still apparent.
Like you Gareth I’m scratching my head a bit about the latest figures on the PIOMAS Arctic sea ice graph, it shows sea ice as being about 3000 Km3 less than the same time last year, the text gives last years September minimum as estimated at 5800 Km3 so unless there’s a dramatic reversal in the trend, on those numbers ice volume this September should be about half of last years. And if that’s the case how come the experts are still picking a 4m+ Km2 minimum??
Andrew: As I said earlier, I suspect that when the PIOMAS guys were preparing their projection — mid-May? — the recent big drop hadn’t really started. The next set of projections should be due out in July, and ought to take into account the recent rapid melting visible on all measures. I’d be very surprised if there wasn’t a substantial downward revision by some teams – the PIOMAS numbers imply something under 2m km2.
Yes, that was My Prediction.
I was writing an Update – – here’s an Exerpt (then I’ll explain Why we get the Winds):
– – The El Nino of this year was the entire basis of my Prediction – –
> that is, that the EXTREME year of 2007 would be repeated – – and even
More strongly. In proportion to the El Nino rating – – and from a basis of Less Ice than 2006.
As such, note NOT ONLY has Ice-Loss rapidly caught up with the 2007 pace & gone into record Low Territory in All extent, Area, & Volume indexes …
> – – but that the Open water Polynnya …
> .. are at the same 3 PLACES.as in 2007.
The Fall in Indexes could be just Luck. This is like a Fingerprint.
To compare Satellite Ice Maps use:
http://www.ijis.iarc.uaf.edu/cgi-bin/seaice-monitor.cgi?lang=e&mode=img&size=L&date=set&y=2007&m=6&d=26
to quote Cox: “wee, wee, wee, wee, BOING ! WEEP ! WOP !
… and then it stayed down”
– – whew ! Pegging the Meter Up AND Down was interpreted as High Winds AND a Hurricane EYE 22 days = Thousands of miles across. Thus the Graphic in the Movie the Day After Tomorrow – – storms reaching from Arctic Circle to the Tropic. The Movie showed a Storm Surge proportional to 300 mph but …
>> Then the Movie “forgot” about the Winds. Would have made impossible a Romantic Rescue.
So they substituted an Impossibly fast Ice Age.
> Yes they made a DIsaster Movie about this & had to tone it DOWN ! ! !
Nothing moves for no reason, so Ocean Currents must have an ENERGY difference at their Root. Currents move TO the Arctic to carry HEAT from areas further South where it is in excess.
… but the Pole can be sunnier than even the Equator for about 3 months, due to its 24-hour Days (the “Midnight Sun” ). See: http://earthobservatory.nasa.gov/Features/EnergyBalance/page3.php or http://www.eoearth.org/image/Insolation_graph.gif
… so IF it is Warmer up North, the Current will turn BACK SOUTH at 3-4 mph.
Then Comes the 6-month polar Night WITHOUT A WARM CURRENT TO SLOW THE TEMPERATURE PLUNGE. We may even get Air freezing out — certainly the Mammoths saw that but I think the Air blobs may well have been a Comet. What WILL happen is the Winds will try to carry the Loadr.
As the Oceans weigh 1900 times the Atmosphere but only a tenth are involved in the Currents; and Coriolis, plus basin Geography, double their path length, so Winds should run 1900/10/2 (/ = divided by) = just under 100 times the Ocean Currents’ speed or 300 mph … until the pokey 3 knot current gete to the pole which will be Months.
— Don’t you love it when the Numbers work out, you have a RECORD of the phenomena, & People say “Oh, that couldn’t be ? ”
— However, it is Rare.
Now afterwards I think the Pole stayed Open (in summer) AFTER the Ice Age because the HEATING from an Open Polar Sea is about right (3% of the Earth’s surface x 500 degrees F x 55% of average yearly Sun (with a Globally normal Absorbance of 60%, the change in Sun absorbance from reflective Snow to “Deep Blue Sea” is about as if we just added surface area) = 8 degrees F … Greenland had a 19oF temp rise, but the Southern Hemisphere changed a LOT less & only over 3000 years. So near 8 degrees ( F ) Globally … comes out to 12 in the Northern Hemisphere – – which is what Happened.
I know of no other Theory which produces the Proper Amount of Heating, without a general “Amplification” effect added in, which seems Bogus to me.
The Arctic Probably melts off on a Schedule because we get in between Jupiter & the Sun & get Zapped. That is a 102,000 year Cycle where Milankovitch’s 108,000 is requiring events dead in between actual Ice Age Starts & Stops for the 6th & 7th Ice Ages back. The 700,000 year long Vostok Core just simply disproved it, and the Jupiter People keep thinking this Proves their Dust Theory (which makes too small a change in temps, cannot be abrupt, & recent data says the change in Interplanetary Dustwas only by 4% from normal .
Remember Comet Shoemakeer-Levy:
… we’ve actually watched a “Zap” happen!
1 of the fragments triggered the Jupiter-Io “flux tube” & the Auroras indicated a brightness = a Month’s worth of SUN @ Jupiter – – as opposed to the Impacts themselves totalling about a week’s worth in equivalent Energy …
Now the Caveat is that Beach Formation on Northern Greenland shows the Polar Sea was Open in summer for thousands of years from at least 7000 to 6000 BP totally, & in part perhaps to 5000 B.P. Earlier beaches would be underwater as Ice Age levels were 180 feet below today’s.
… Accordingly there IS an Ocean Current pattern that does NOT produce SuperStorms. Are we closer to that ? – – or to the Ice Age pattern ?
… which, LIKE NOW, has a CLOSED POLAR SEA rather than an Open one.
… This is one of the Coin flips that gave the 1-in-8. Another is Clouds (2007 had a Lack of them, and on general Principles: ANY abrupt (BIG) change – – since the Abrupt Climate Change Task Force found when things SHOULD happen … they often didn’t. They were non-specific but I take it as 50-50 especially as AFTER their book came out – – we found 2 Craters: a 1 km impactor = 2200 foot Tidal Wave @ N.Z. & 850 at Australia — which SHOULD have forced an Abrupt Change but didn’t, and one 27 times smaller, ie .33 km, at the end of the Pyramid Age which dried things out so bad roughly 10-to-50 degrees North that at least Most humans died. Pakistan lost 2 of its 3 Rivers, The Nile failed and “everyone was eating their own Children” according to the Pyramid texts. Well. OK that could be legend but it shows up in a document from the Kharga Oasis: an inquest as to whether to send to the Pharoah for aid for all the refugees they got. The refugees told them DON’T ! (sorry source for this would be a note in my files form 20 years ago)
The idea that this could happen to US, terrifies me.
Remember that Movie, was at the request of SUBMARINE Captains.
The Abrupt… group was to have DEBUNKED that, but found Abrupt Events did happen – now & then (reccommendation #4 also foretold Katrina: they lambasted Insurance Companies for calling 20-year events a “500-year” Storm so they could write more Policies for the same reserves. Two years later Katrina (a 600-year storm)& Rita (an 800) hit New Orleans 36 years after the Previous Biggie. 36/20 = about 2, so they were indeed due 2. All this serves to verify their conclusions.