
 Unusual things are happening to Antarctic sea ice extent. We are about a month away from the traditional time of maximum extent (around 20 September), and each year for the last six years, total sea ice extent around the Antarctic has been above normal. The last three years have been record-breaking, with 2014 seeing the 20 million square kilometre threshold exceeded for the first time since satellite records began in 1979 (Figure 1). But this year, sea ice growth stalled in early August and is currently going nowhere. For the first winter since 2008, total Antarctic sea ice extent is below normal (Figure 2).
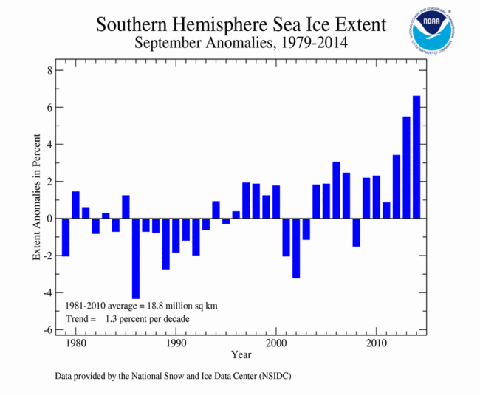 Figure 1: September Antarctic sea ice extent, percent difference from the 1981-2010 normal.
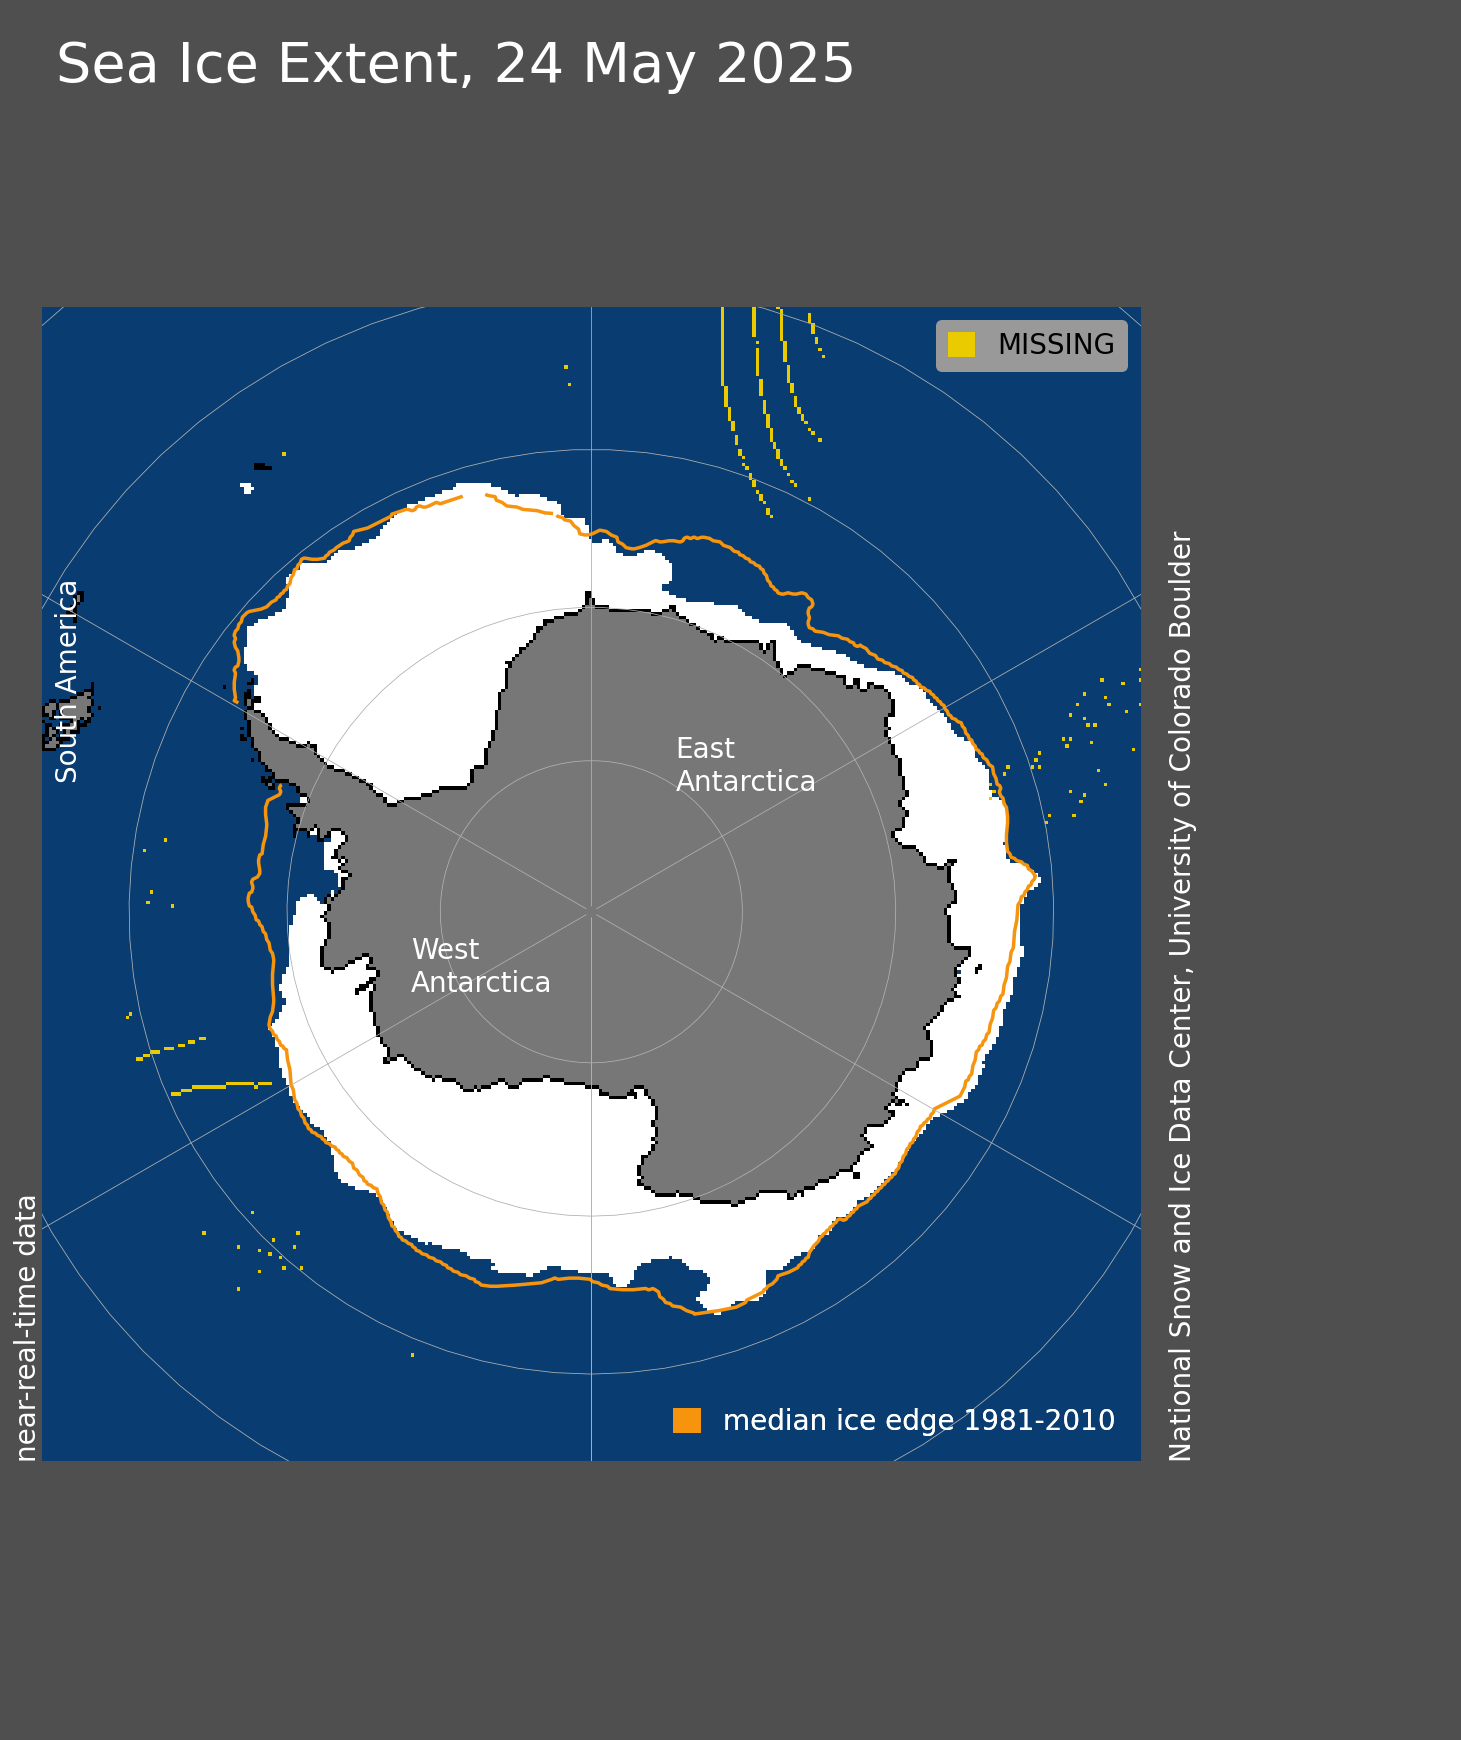 Figure 2: Antarctic sea ice extent in 2015 (blue line). The dashed line shows 2014 extent, the gray line the 1981-2010 average extent and the shading represents the two standard deviation spread about the average.
What’s more, the pattern of sea ice change this winter is the opposite of the trend pattern we’ve seen over the past few decades towards more ice around the Ross Sea and less ice near the Antarctic Peninsula1. This year, near the Antarctic Peninsula, we have more ice than normal, and less than normal north of the Ross Sea and across parts of the Indian Ocean (Figure 3). A real turn-around.
 Figure3: Antarctic sea ice coverage for 16 August 2015 (white). The thin solid line shows the 1981-2010 average sea ice edge for this date.
What’s going on? As we’ve found with past trends and seasonal variability2, it’s the winds that are driving the pattern of sea ice departures from normal. What’s different this year is that we have an El Niño in the tropical Pacific, and El Niño events drive changes in the winds all the way to the Antarctic coast, causing strong cold southerlies near the Peninsula (where we are seeing more ice than normal) and warm northerlies over the Ross Sea (where we’re seeing less ice than normal). A classic El Niño response pattern is developing outside the Tropics3, with a big high over the central south Pacific (Figure 4). This brings the anomalous northerlies to the west and the anomalous southerlies to the east.
 Figure 4: Southern Hemisphere circulation difference from normal, averaged over 1-14 August 2015. Red contours show higher than normal pressures, blue show lower than normal, and black is zero difference from normal. The arrows show the sense of the wind differences from normal, warm northerlies towards the Ross Sea region, cold southerlies closer to the Antarctic Peninsula. Data obtained from the NCEP/NCAR reanalysis.
Since the late 1970s, we’ve seen a period of strong El Niño activity in the 1980s and 90s (when total sea ice extent was often below normal), followed by a period of much more La Niña activity since the late 1990s (when total sea ice extent was often above normal, Figure 1). That variation is the signature of the Pacific Decadal Oscillation (PDO), which has been in its negative, La Niña-favouring state since around 2000. The 20-30 year swings in the PDO are likely to be a large part of the reason we’ve seen the upward trend in sea ice.
Now, we’re into a strong El Niño, and some climate scientists are saying that the PDO is switching back to its positive, El Niño-friendly state. If that’s true, and we’re in for more El Niño activity over the next decade or two, it is very likely the end of the upward trend in sea ice extent – just a fluke of 30 years’ natural variations in the climate system, much like the rapidly evaporating “hiatus”4.
- Turner, J., J. C. Comiso, G. J. Marshall, T. A. Lachlan-Cope, T. Bracegirdle, T. Maksym, M. P. Meredith, Z. Wang, and A. Orr, 2009: Non-annular atmospheric circulation change induced by stratospheric ozone depletion and its role in the recent increase of Antarctic sea ice extent. Geophys. Res. Lett., 36, L08502, doi:08510.01029/02009GL037524. [↩]
- Holland, P. R., and R. Kwok, 2012: Wind-driven trends in Antarctic sea-ice drift. Nature Geoscience, 5, doi: 10.1038/ngeo1627, 872-875 [↩]
- Renwick, J. A., 2002: Southern Hemisphere circulation and relations with sea ice and sea surface temperature. J. Climate, 15, 3058-3068 [↩]
- http://onlinelibrary.wiley.com/doi/10.1002/2013EF000165/abstract [↩]
My understanding is that the increase in Antarctic sea ice is due to the increase in winds that blow the ice further out and the melting land ice is providing plenty of fresh water to freeze. This small change is of major importance to the deniers who want to counteract the huge loss of Arctic sea ice. Not good news for them and also the Arctic is having another bad year.
Indeed Bob. The Antarctic sea ice trend was a pretty weak argument at the best of times, but now melting away.
Yes winds can affect sea ice, as they have done in the Arctic too
http://www.theguardian.com/environment/2010/mar/22/wind-sea-ice-loss-arctic
Interesting.
Also the Pacific Decadal Oscillation (PDO) has changed phase again.
One swallow does not make a spring of course, it will take several years for a trend change to be verified.
What amazed me was the gravitational pull of a land mass can draw in and raise sea levels. https://www.facebook.com/bob.bingham.16
Interesting. I too had no idea that winds affect the ice. Thank you for sharing and for educating me on this topic!