Coal, climate change, and the New Zealand economy: winners, losers, and long-term users

Cross-posted from Coal Action Network Aotearoa

As the country reeled with the news last week that Solid Energy had gone into administration with a $300m debt, another event was happening in the Pacific that puts the debate in a context that it too seldom receives in New Zealand.

Sign on Kiribati's island of Tarawa. Photo: flickr
Sign on Kiribati’s island of Tarawa. Photo: flickr

On Thursday, Kiribati Prime Minister Anote Tong wrote to world leaders calling for a moratorium on new coalmines.

“Kiribati, as a nation faced with a very uncertain future, is calling for a global moratorium on new coal mines. lt would be one positive step towards our collective global action against climate change and it is my sincere hope that you and your people would add your positive support in this endeavour,” he wrote.

“The construction of each new coal mine undermines the spirit and intent of any agreement we may reach, particularly in the upcoming COP 21 in Paris, whilst stopping new coal mine constructions NOW will make any agreement reached in Paris truly historical.”

UK Economist Sir Nicholas Stern agreed: “The use of coal is simply bad economics, unless one refuses to count as a cost the damages and deaths now and in the future from air pollution and climate change,” he told Reuters (Stern’s full statement here).

In June, Pope Francis said in his encyclical that the use of “highly polluting fossil fuels needs to be progressively replaced without delay.”

Continue reading “Coal, climate change, and the New Zealand economy: winners, losers, and long-term users”

Postcards from La La Land: the Cnut conundrum

New Zealand’s merry little band of climate deniers are turning out to be a right bunch of Cnuts. Sea level rise and its implications for Christchurch and the wider world have been making news in recent weeks — as have new projections of rapid sea level rise over the remainder of this century. So what does a good climate denier do? To stay faithful to their core belief — that climate change isn’t happening, or isn’t going to be bad — they have to argue against policies designed to deal with its impacts, as well as those intended to cut carbon emissions. Sea level rise? Like Cnut, they line themselves up against the waves.

I’ve blogged many times on the challenge sea level rise poses for post-quake Christchurch. The 2011 quakes caused large parts of the city to drop by up to half a metre — effectively delivering decades of sea level rise in a matter of minutes. For some areas of the city tidal and run-off flooding are now commonplace.

The current debate on sea level issues has been prompted by the city council’s long term planning process — which recommends ((Based on a revised report (pdf) developed from consultants Tonkin & Taylor’s 2014 work.)) that development should be restricted in areas where future sea level rise is expected to cause problems. Not surprisingly, this has some owners of coastal properties concerned that they will lose out. The council has also looked at the idea of building a tidal barrier across the Avon-Heathcote estuary to protect the city.

Local politics and property owner self-interest is bumping into the harsh realities of climate change, leading to a wide variety of responses — including “it isn’t happening”.

Continue reading “Postcards from La La Land: the Cnut conundrum”

The encroaching sea: new NZ sea level rise maps

This guest post is by Jonathan Musther, who has just published an amazing series of highly detailed maps projecting future sea level rise scenarios onto the New Zealand coastline. If you live within cooee of the sea, you need to explore his maps. Below he explains why he embarked on the project.

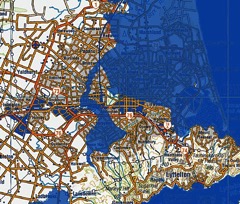
10mSLR-Christchurch480

The effect of 10m sea level rise on Christchurch: say goodbye to St Albans, prepare to paddle in the CBD. Full map here.

For humans, sea-level rise will almost certainly be the most directly observable effect of climate change, and specifically of global warming. As the climate changes, many of the effects will be subtle, or if not subtle, they will at least be very complex. Summers may be warmer, or cooler; we may experience more rain at some times of year, and less at others; tropical storms may increase and they may be sustained further from the equator, but all of these changes are complex, and not necessarily obvious against the background complexity of any climate system. In contrast, there is something obvious and unstoppable about sea-level rise, there is no question that it will send anyone in its path running for the hills.

For some time I have been involved in searching for land appropriate for specific uses such as arable farming, water catchment, and off-grid living. When searching for land in this way, there are many, many criteria to consider, and of course one of these is potential future sea-level. Using GIS (Geographical Information System) software, and elevation models of the New Zealand landscape, it is possible to visualise sea-level rise, and select sites accordingly. Naturally, the next question is what sea-level rise to consider. It is possible to place an upper-limit on sea-level rise – after all, there’s only a finite amount of ice that could melt – but beyond that, we’re limited to informed guesswork.
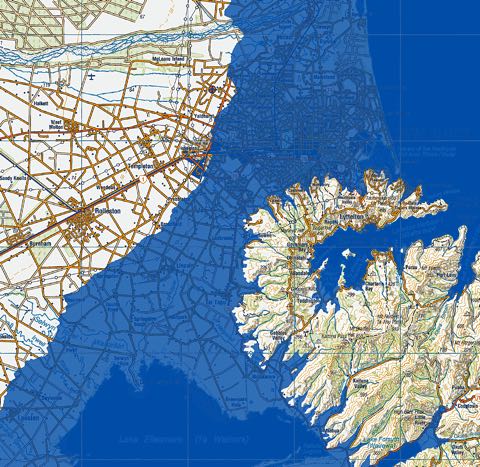
25mSLR-Christchurch480

25m sea level rise: a sunken city and Banks Island. Full map here.

What is the maximum possible sea-level rise? It depends who you ask. Many sources place the maximum potential sea-level rise at around 60-64 metres, but these figures are rarely referenced, and don’t concur with the latest research. Other sources place the figure at around 80-81.5 metres, and while this appears to be well referenced and researched, it is based on work that is somewhat out of date. The best estimates I’ve been able to locate, based on recent measurements (and lots of them) are around 70 metres, but quite what the margin of error is remains uncertain. Of course, when considering future sea-level, we must remember that here in the South Pacific, we will likely experience increased numbers of more powerful tropical storms, with associated storm surges.
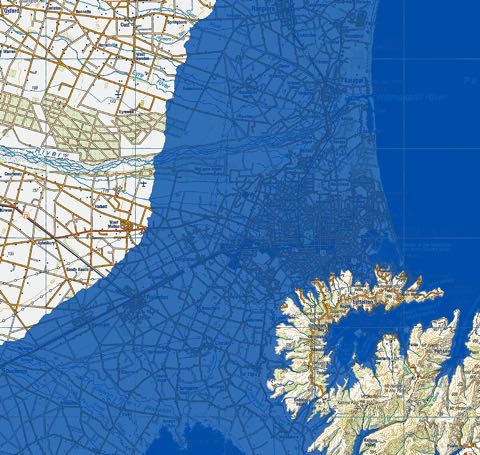
80mSLR-Christchurch480

At 80m, West Melton is a seaside township. Full map here.

The maps I created showing sea-level rise for the whole of New Zealand depict rises of 10, 25 and 80 metres. I have certainly received criticism for not focussing on more modest sea-level rises (e.g. 1 or 2 metres), but there are some good reasons for this: firstly, the resolution of the elevation models of New Zealand do not allow accurate predictions of such small rises. Secondly, larger sea-level rises pose a huge threat, and are therefore worth considering. I made a point of avoiding time frame predictions when producing the sea-level rise maps, partly because the time frame is largely irrelevant (if 80% of our homes are flooded, it’s bad news, no matter when) and partly because the range of expert estimates is huge. Study after study shows that we have underestimated ice-sheet instability, and it is almost universally accepted that large sea-level rise will be a consequence. Unfortunately, most studies place this sea-level rise at some unspecified time in the future – when, we’re not sure, but it’s far enough away that we needn’t worry…

So is a 10 or 25 metre sea-level rise likely? Unfortunately, the broad answer is yes. The Greenland, West and East Antarctic ice sheets are showing growing instability, and many researchers agree that they may have past a ‘point of no return’. Remember, the Greenland ice sheet alone, if completely melted, would lead to approximately a 7 m rise in global sea-level. Of course, we return to the issue of when this is likely to happen, and on that, the jury is out.

I firmly believe that to be good scientists, we must investigate the possibility of large sea-level rise, and its consequences. The time frame is unclear, the absolute rise is also unclear, but there really is something unstoppable about rising oceans. We are now well outside the sphere of collective human experience and expertise, and we should be very careful to prepare, as best we can, for a range of scenarios.

Totten hots up, ice shelves melting: it’s grim down south

AntarcticaCryosat2Much news in recent weeks from Antarctica, and none of it good. An Argentinian base on the tip of the Antarctic Peninsula recently reported a new high temperature record for the continent — 17.5ºC. A team of scientists has discovered that East Antarctica’s Totten Glacier — which drains a catchment that contains enough ice to raise sea levels by 3.5 metres — is vulnerable to melting caused by warm ocean water lapping underneath the ice and reaching inland ((Greenbaum JS et al, (2015), Ocean access to a cavity beneath Totten Glacier in East Antarctica, Nature Geoscience, doi:10.1038/ngeo2388)). Another group has stitched together satellite data on ice shelf thickness gathered from 1994 to 2012 and found that the ice shelves — mostly stable at the beginning of the period, are now losing mass fast ((Paolo, F.S. et al, (2015), Volume loss from Antarctic ice shelves is accelerating, Science, doi/10.1126/science.aaa0940)). From the abstract:
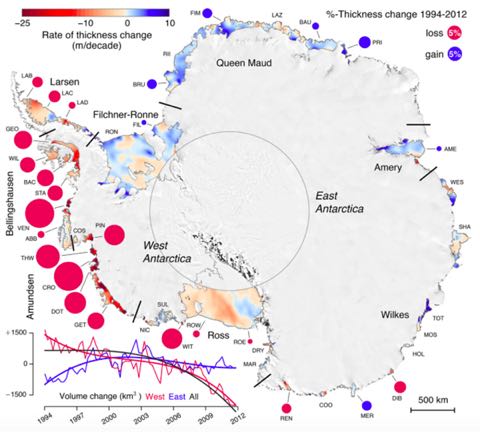
Overall, average ice-shelf volume change accelerated from negligible loss at 25 ± 64 km3 per year for 1994-2003 to rapid loss of 310 ± 74 km3 per year for 2003-2012. West Antarctic losses increased by 70% in the last decade, and earlier volume gain by East Antarctic ice shelves ceased. In the Amundsen and Bellingshausen regions, some ice shelves have lost up to 18% of their thickness in less than two decades.

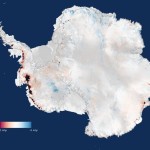
The Amundsen region is home to the Pine Island Glacier, notorious for its current rapid loss of mass, and probably already past the point of no return for long term total melt. The map below shows the big picture: large red dots are ice shelves losing mass. Blue dots are shelves gaining mass.

Antarcticiceshelves

Ice shelves are important features of the Antarctic cryosphere. They buttress the ice piled up on the land, slowing down the flow of ice into the ocean. As the shelves lose mass, the flow of ice from the centre of the continent can speed up, adding to sea level rise. There’s a very good overview of the process — and the findings of the Paulo et al paper — in this excellent Carbon Brief analysis.

The study of the Totten Glacier — one of the fastest thinning glaciers in East Antarctica — is the first to look at the detail of the sea floor and ice thickness in the area. The study finds that there are “tunnels” under the ice leading into a deep trough inland that cold convey warm water inland — the same process that has destabilised the Pine Island Glacier in West Antarctica. As the authors suggest, rather drily, “coastal processes in this area could have global consequences”.

These signs of rapid changes around the coasts of Antarctica, together with hints that large parts of the huge East Antarctic ice sheet are at risk of following West Antarctica into the sea, suggest that even if sea levels only rise by a metre by the end of this century as the IPCC projected last year, the longer term picture will be a great deal wetter than that. After all, there is the equivalent of 60 metres of sea level rise locked up in East Antarctica.

For a very good overview of the state of our understanding of what’s going on in Antarctica, I recommend a listen to VUW’s Professor Tim Naish being interviewed by Radio New Zealand National’s Kim Hill last Saturday. Naish even covers what’s happening to the sea ice down there, but a longer term study of the sea ice is getting under way, led by another VUW prof — Jim Renwick.

Antarctic ice going fast: Larsen C ice shelf primed for giant calving event

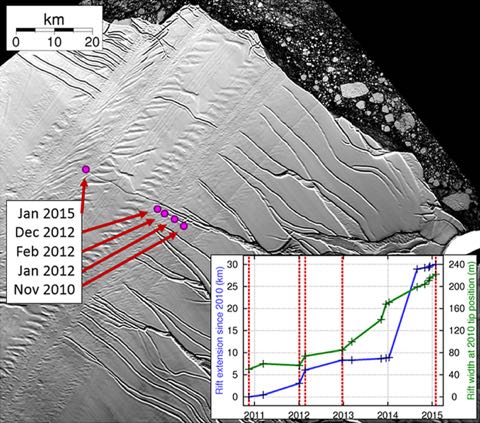
Analysis of rift propagation using Landsat data. Background image, in which the rift is visible, is from 4 December 2014. Inset graph shows the development of rift length with respect to the 2010 tip position, and rift width at the 2010 tip position, measured from 15 Landsat images (crosses). Circles and labels on the map, and dotted red lines on the graph, show the positions of notable stages of rift development.

The Larsen C ice shelf on the east coast of the Antarctic peninsula is primed for a giant iceberg calving event, and could be heading for total collapse — similar to the fate of the Larsen B ice shelf in 2002, according to scientists monitoring the ice. A huge crack (above: hover over the picture for the full caption from the paper) is propagating northwards at an accelerating rate, and could give birth to ice islands of between 4,600 km2 and 6,400 km2 — equivalent to three or four Stewart Islands floating out to sea — according to an open access paper, Jansen et al, Newly developing rift in Larsen C Ice Shelf presents significant risk to stability ((The Cryosphere Discuss., 9, 861–872, 2015)) (full pdf), published last month.

From the paper’s conclusions:

It seems inevitable that this rift will lead to a major calving event which will remove between 9 and 12 % of the ice shelf area and leave the ice front at its most retreated observed position. More significantly, our model shows that the remaining ice may be unstable. The Larsen C Ice Shelf may be following the example of its previous neighbour, Larsen B, which collapsed in 2002 following similar events.

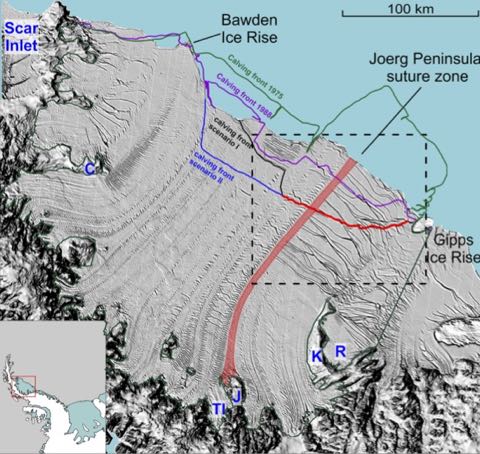
The Larsen C ice shelf has been thinning over at least the last decade, and has shown signs of surface melting. Jansen et al developed two calving scenarios — shown below — and analysed the results with a model of the ice shelf.

 Overview of the Larsen C Ice Shelf in late 2014 showing the contemporary location of the developing rift (red line), and a selection of previous and predicted future calving fronts. Background image is MODIS Aqua, 3 December 2014. Geographic features of interest are marked (R = Revelle Inlet, FI = Francis Island, TO = Tonkin Island, TI = Trail Inlet, SI = Solberg Inlet, K = Kenyon Peninsula) and the dashed box shows the extent of Fig. 2. The highlighted flow line indicates the location of the Joerg Peninsula suture zone.

For a good overview of the current state of our knowledge of Antarctic ice melt, see The big melt: Antarctica’s retreating ice may re-shape Earth from the Associated Press, which tipped me off to the Larsen C story. Larsen C is the most northerly of the remaining major Antarctic ice sheets, and the last remnant of an ice shelf that until 1995 stretched up to the tip of the east coast of the Antarctic Peninsula. After the collapses of Larsen A and B, the glaciers feeding the shelves were observed to speed up — increasing the overall ice sheet mass loss. While the loss of the ice shelf won’t itself cause any sea level rise — because it’s already floating — the resulting speed up will increase sea levels.