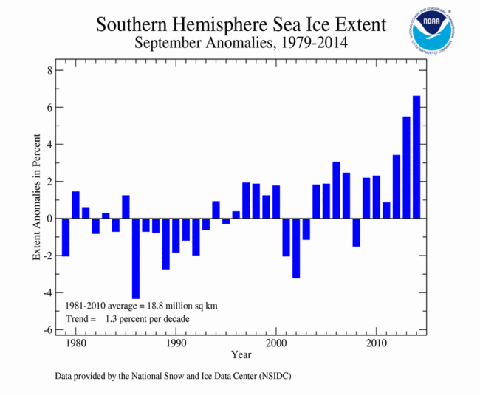
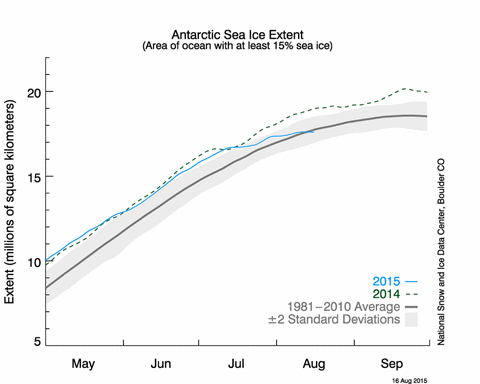
 Unusual things are happening to Antarctic sea ice extent. We are about a month away from the traditional time of maximum extent (around 20 September), and each year for the last six years, total sea ice extent around the Antarctic has been above normal. The last three years have been record-breaking, with 2014 seeing the 20 million square kilometre threshold exceeded for the first time since satellite records began in 1979 (Figure 1). But this year, sea ice growth stalled in early August and is currently going nowhere. For the first winter since 2008, total Antarctic sea ice extent is below normal (Figure 2).
 Figure 1: September Antarctic sea ice extent, percent difference from the 1981-2010 normal.
 Figure 2: Antarctic sea ice extent in 2015 (blue line). The dashed line shows 2014 extent, the gray line the 1981-2010 average extent and the shading represents the two standard deviation spread about the average.
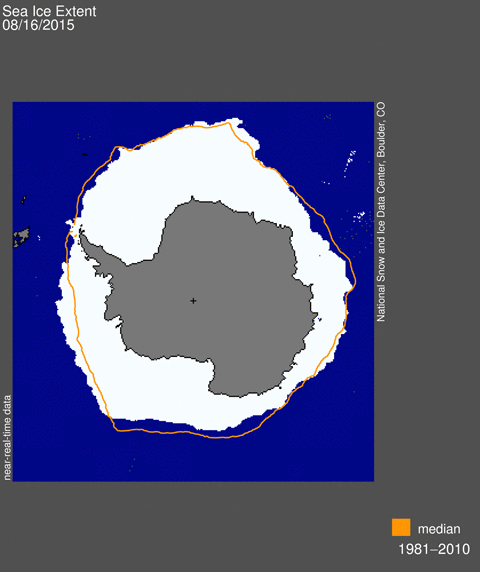
What’s more, the pattern of sea ice change this winter is the opposite of the trend pattern we’ve seen over the past few decades towards more ice around the Ross Sea and less ice near the Antarctic Peninsula ((Turner, J., J. C. Comiso, G. J. Marshall, T. A. Lachlan-Cope, T. Bracegirdle, T. Maksym, M. P. Meredith, Z. Wang, and A. Orr, 2009: Non-annular atmospheric circulation change induced by stratospheric ozone depletion and its role in the recent increase of Antarctic sea ice extent. Geophys. Res. Lett., 36, L08502, doi:08510.01029/02009GL037524.)). This year, near the Antarctic Peninsula, we have more ice than normal, and less than normal north of the Ross Sea and across parts of the Indian Ocean (Figure 3). A real turn-around.
 Figure3: Antarctic sea ice coverage for 16 August 2015 (white). The thin solid line shows the 1981-2010 average sea ice edge for this date.

You must be logged in to post a comment.