Too hot (and here comes the surge)

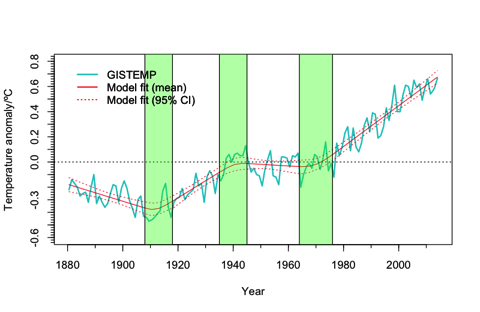
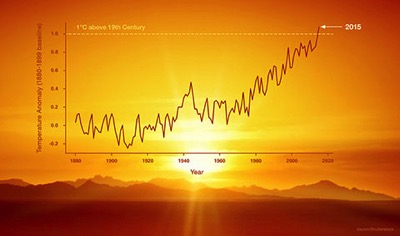
GISS20152015 was the hottest year since records began in all of the major global temperature datasets, and by a huge margin. The world is now more than 1ºC warmer than pre-industrial temperatures — pushed there by rapidly rising levels of greenhouse gases in the atmosphere, and helped a little by the current very strong El Niño. And because El Niño’s major impacts on global temperatures happen as an event declines, we can expect 2016 to be even warmer.

Carbon Brief has an excellent analysis of the new record here. See also NASA and NOAA’s joint announcement, the NASA press release, and Hansen et al’s overview (pdf). Here’s the latter on the outlook for the rest of the decade:

We can also say with confidence, because of Earth’s energy imbalance (energy absorbed from sunlight exceeding heat radiated to space), that the present decade will be warmer than last decade. Already the first half of the present decade is almost 0.1°C warmer than last decade. Strong La Niñas commonly follow strong El Niños, so it is likely that 2017 and perhaps 2018 will be quite cool relative to 2015-2016, but the decade as a whole should be considerably warmer than the prior decade.

Kevin Trenberth provides an interesting overview at The Conversation, detailing some of the weather extremes delivered by the current El Niño, and notes:

What we have seen this past year will likely be routine in about 15 years, although regionally the details will vary considerably. Indeed, we have had a glimpse of the future under global warming.

You wouldn’t want to bet against it continuing… Continue reading “Too hot (and here comes the surge)”

Heat: 2014 breaks global temperature records, 2015 could be hotter

Climatecouncil2014graphic

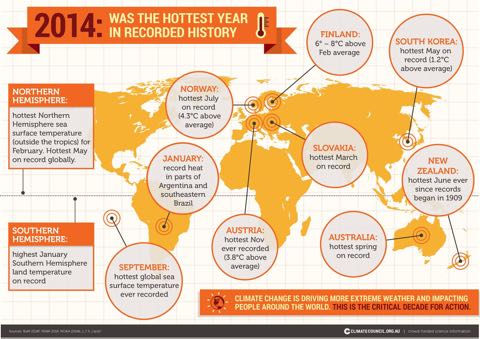
Last year was the warmest year on record for the planet, analyses by NASA and NOAA show, and it’s possible that 2015 could be warmer still. 2014 was warmer than previous record holders 2005 and 2010, and comfortably ahead of 1998. 13 of the hottest 15 years on record have all occurred since 2000. Remarkably, 2014’s warmth was achieved without much assistance from an El Niño — which boosts global temperatures and is normally a factor in record setting years, as this graphic from Skeptical Science shows:

ENSO Temps static480

For more discussion of ENSO’s impact on temperatures, see Dana Nucitelli’s article at The Guardian, and Jim Hansen et al’s discussion here. Hansen warns that more warming could be on its way:

More warming is expected in coming years and decades as a result of Earth’s large energy imbalance, more energy coming in than going out, and with the help of even a mild El Niño 2015 may be significantly warmer than 2014.

The risk of further rapid rises in global temperatures could also be increased by early signs that the Pacific Decadal Oscillation (PDO) may be shifting to its positive phase, as the Peter Hannam at the SMH pointed out late last year:

“During a positive PDO phase, you’d expect temperatures to keep climbing again as they did in the 1980s and 1990s,” Dr (Shayne) McGregor (of UNSW) said, adding that as PDOs are measured by rolling 11-year averages, it will be a while before any shift becomes clear.

In New Zealand, NIWA reports that the nationwide average temperature for 2014 was 12.8°C, 0.2°C above the 1981–2010 annual average, but that June was tied for warmest in the long term record. The MetService blog provides a good overview of regional weather here.

For further analysis and discussion, there is a lot of good coverage and supporting information available on the web. Here’s my pick of some of the best.

News coverage: New York Times (above the fold on the front page, no less), BBC, Guardian, Stuff (taking the AP coverage). Time makes the obvious point: warming continues unabated, which should give the lie to climate crank nonsense about no recent warming ((…but I won’t be holding my breath…)).

Background analysis: the Climate Council in Australia (who created the graphic at the top of this post), a superb Bloomberg graphic, Climate Nexus, Climate Central (one and two), and for my favourite visual reminder of how warming has progressed, here’s NASA’s animation of global warming from 1880 to 2014:

[Bowie]

Is earth’s temperature about to soar? (No pause, no hiatus, only warming)

This is a guest post by the statistician who blogs as Tamino, cross-posted from his Open Mind blog with his permission. It’s important reading…

A recent blog post on RealClimate by Stefan Rahmstorf shows that when it comes to recent claims of a “pause” or “hiatus,” or even a slowdown in global surface temperature, there just isn’t any reliable evidence to back up those claims.

TempCP3

Yet for years one of the favourite claims of those who deny the danger of global warming has been “No global warming since [insert start time here] !!!” They base the statement on the observed data of earth’s surface temperature or its atmospheric temperature. Then they claim that such a “pause” or “hiatus” in temperature increase disproves, in one fell swoop, everything about man-made climate change.

They seem a bit worried lately because it is very likely that the data from NOAA (National Oceanic and Atmospheric Administration) will record this year as the hottest on record; we won’t know, of course, until 2014 is complete. A single year, even if the hottest on record, has only a little to do with the validity of such claims, but a lot to do with how hard it is to sell the idea. Perhaps they dread the prospect that if the most recent year is the hottest on record — in any data set — it will put a damper on their claims of a “pause” in global warming. If they can’t claim that any more, it deprives them of one of their most persuasive talking points (whether true or not). Still the claims persist; they’ve even begun preparing to ward off genuine skepticism spurred by the hottest year on record.

I seem to be one of very few who has said all along, repeatedly and consistently, that I’m not convinced there has been what is sometimes called a “pause” or “hiatus,” or even a slowdown in the warming trend of global temperature — let alone in global warming.

Continue reading “Is earth’s temperature about to soar? (No pause, no hiatus, only warming)”

2011: a hot cold year

2011GISSgraph480

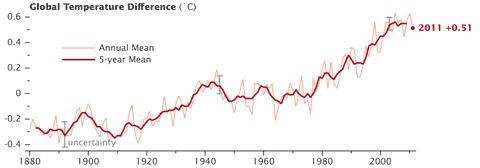
The NASA numbers are in, and 2011 was the ninth warmest year since 1880 — 0.51ºC above the 1951-80 global mean. Nine of the ten warmest years in the long term record have occurred in this century. According to the analysis released by James Hansen and his team at GISS, a combination of low solar activity and the continuing cool phase (La Niña) of the El Niño Southern Oscillation kept global temperatures down — but as this map from the Earth Observatory shows, many parts of the world still managed to experience a very warm year, especially over the Arctic and Russia:

2011GISSglobe480

NOAA’s overview of last year puts 2011 in eleventh place in their long term series, and confirms that the USA experienced a record 14 extreme weather events that caused more than $1 billion in damage — up two from their previous estimate.

Continue reading “2011: a hot cold year”

Shapes of things (2012 and all that)

‘Tis the silly season, time for journalists with little real news to report to reflect on the year past and make predictions for the year to come. I don’t normally play that game because there are too many interesting things to write about on the climate beat, but this year I’m going to make an exception. Glenn “Climate Show” Williams persuaded me to have a chat with him on his summer Radio Live show — and yes, we did cover the last year, and the prospects for 2012. The audio’s available to stream for the next week from the Radio Live site (select Dec 28th, then the 1-15pm segment — my bit starts after about 5 minutes). You may regard this post as an expanded version of my comments there (and a bit of recap on the last Climate Show of the year).

So: 2011 was the year of extremes, beyond any shadow of doubt. Wherever you looked around the world, there were record-breaking floods, heatwaves and hugely damaging extreme weather events. The USA alone had 14 separate extreme weather events with billion dollar plus damage bills (NOAA puts it at 12 with 2 more to finalise, the World Meteorological Organisation plumps for 14). The year broke no records for global average temperature — 2011 will probably end up as the 10th or 11th warmest year in the long term record — but it will be the warmest ever La Niña year. Here’s a WMO graph to illustrate the point:

Continue reading “Shapes of things (2012 and all that)”