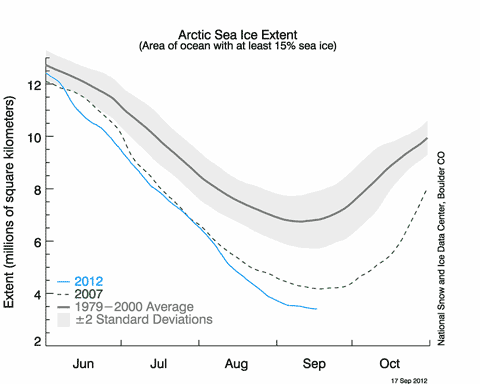
 In early August I posted my predictions for the “sceptical” response to the record sea ice minimum. Time to call myself to account. I had planned to do my own analysis, but John Mason at Skeptical Science has done such an excellent job of ploughing through the mountains of bullshit that I asked his permission to repost his comprehensive scorecard here…
The truth is incontrovertible. Panic may resent it, ignorance may deride it, malice may distort it, but there it is. Winston Churchill, 1916.
Late summer has long been known in media circles as the Silly Season, when any old story, embellished a bit here and a bit there, is trundled out to fill column space normally occupied by the graver matters of politics and business.
In the world of climate science, late summer is of course rather more important, marking the peak of the annual sea-ice melting season of the Northern Hemisphere, and this year has been extraordinary, with the canary in the coal mine tweeting louder than ever that something is seriously amiss with the climate.
With Arctic sea-ice having reached a record low extent, area and volume, several weeks ahead of the usual end-of-melt date, the Blogosphere has been ablaze with lengthy discussions of this event and its potential and worrisome ramifications. There have also been mass-outbreaks of denial accompanied by varying degrees of silliness, as one might expect when faced with an event like a record Arctic melt-out. Many commentators could see the meltdown approaching, both in the Arctic and around parts of the Blogosphere, with Gareth Renowden over at Hot Topic speculating in early August as follows:
“When Arctic sea ice area sets a new record low in the next couple of weeks, the usual suspects will say: “You can’t trust area, sea ice extent is the only valid metric“.
When Arctic sea ice extent sets a new record low in September, the following arguments will be run in parallel:
1) There will be a frantic search for a definition of extent in which a new record was not set
2) There will be a complaint that the satellite record has been blighted by the failure of a sensor and the calibrations needed to get a new sensor in operation have corrupted the record
3) It will be claimed that it was all caused by the major Arctic storm that hit in August, and thus can’t be attributed to global warming
4) It’s cyclical — it’s all happened before, in the 1930s, and is therefore nothing unusual
5) That it’s irrelevant, because it’s not global and not happening where anyone lives so can’t possibly matter.
When the sea ice extent and area anomalies blow out to record levels in early October because of the delayed freeze-up, there will be silence.
When the re-freeze starts, and the Arctic basin is covered in ice once more (early December), Anthony Watts will report on the record rate of ice formation, calling it a “stunning recovery“.”
They go on in strange paradox, decided only to be undecided, resolved to be irresolute, adamant for drift, solid for fluidity, all-powerful to be impotent. Winston Churchill, 1936.
How closely did Gareth’s predictions above conform to the reality on the media airwaves? In this post-minimum-declared Blogosphere round-up, we take a light-hearted look.
Continue reading “Record Arctic Sea-ice minimum 2012 declared – it’s the Silly Season!”


