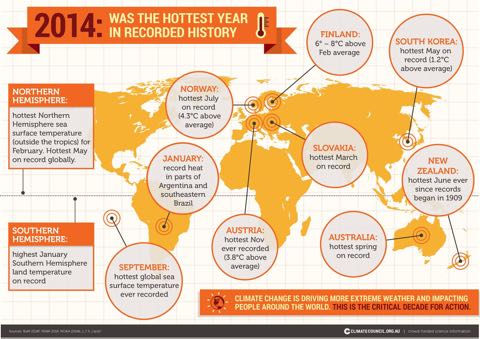
Heat: 2014 breaks global temperature records, 2015 could be hotter

Climatecouncil2014graphic

Last year was the warmest year on record for the planet, analyses by NASA and NOAA show, and it’s possible that 2015 could be warmer still. 2014 was warmer than previous record holders 2005 and 2010, and comfortably ahead of 1998. 13 of the hottest 15 years on record have all occurred since 2000. Remarkably, 2014’s warmth was achieved without much assistance from an El Niño — which boosts global temperatures and is normally a factor in record setting years, as this graphic from Skeptical Science shows:

ENSO Temps static480

For more discussion of ENSO’s impact on temperatures, see Dana Nucitelli’s article at The Guardian, and Jim Hansen et al’s discussion here. Hansen warns that more warming could be on its way:

More warming is expected in coming years and decades as a result of Earth’s large energy imbalance, more energy coming in than going out, and with the help of even a mild El Niño 2015 may be significantly warmer than 2014.

The risk of further rapid rises in global temperatures could also be increased by early signs that the Pacific Decadal Oscillation (PDO) may be shifting to its positive phase, as the Peter Hannam at the SMH pointed out late last year:

“During a positive PDO phase, you’d expect temperatures to keep climbing again as they did in the 1980s and 1990s,” Dr (Shayne) McGregor (of UNSW) said, adding that as PDOs are measured by rolling 11-year averages, it will be a while before any shift becomes clear.

In New Zealand, NIWA reports that the nationwide average temperature for 2014 was 12.8°C, 0.2°C above the 1981–2010 annual average, but that June was tied for warmest in the long term record. The MetService blog provides a good overview of regional weather here.

For further analysis and discussion, there is a lot of good coverage and supporting information available on the web. Here’s my pick of some of the best.

News coverage: New York Times (above the fold on the front page, no less), BBC, Guardian, Stuff (taking the AP coverage). Time makes the obvious point: warming continues unabated, which should give the lie to climate crank nonsense about no recent warming ((…but I won’t be holding my breath…)).

Background analysis: the Climate Council in Australia (who created the graphic at the top of this post), a superb Bloomberg graphic, Climate Nexus, Climate Central (one and two), and for my favourite visual reminder of how warming has progressed, here’s NASA’s animation of global warming from 1880 to 2014:

[Bowie]

High and dry

EOTasmanhigh

From NASA’s Earth Observatory: yesterday’s Image Of The Day (RSS feed) was this stunning picture of an intense high pressure system over the Great Australian Bight to the southwest of Tasmania, acquired by the MODIS sensor on the Aqua satellite on June 5th. In high pressure systems, dry descending air suppresses cloud formation, in this case punching an impressive “hole” through a layer of stratocumulus clouds. Central pressure at the time was 1040 hectoPascals. According to the NZ MetService 7 day forecast, over the next week the system will move east and set up camp to the southwest of the South Island.

Also from the Aqua satellite last week, a good picture of the midweek snowstorm that hit the South Island. Thursday morning chez nous was as pretty as several pictures.

Time of the season

Climate change involves more than straightfoward warming, it also affects the patterns of weather and the seasons, as John Parker discovers in an excellent feature — What’s happened to the seasons? — in the Spring issue of The Economist’s Intelligent Lifemagazine. Parker’s done his homework, and his article is the best overview of recent changes in seasonal weather around the world, and the knock on impacts on agriculture and ecosystems that I’ve read. Here’s a sample:

Some seasons have vanished altogether. In Kashmir there used to be a brief rainy season between winter and spring, called tsonth -— three or four weeks of torrential downpours, bright sunshine and snow on the ground. But, says Rais Akhtar of the University of Kashmir, the state has not seen a tsonth for ten years. The first rainy season seems to have dried up in Uganda. In Ntchenachena, in northern Malawi, villagers used to describe four episodes of rain, each with their proper name and association with particular farming events. Since 2001, they say, the pattern can no longer be discerned.

Parker points to increasing unpredictability in “traditional” seasons posing a challenge to agriculture as well as dislocations in ecosystem linkages. We may even have seen an example of that in the last year in New Zealand. 2009 was a remarkable switchback between hot and cold weather. May was very cold, but August was the warmest in the 155 year record. And temperatures then flatlined through until the end of October, which was the coldest for 64 years. Check out the NIWA summary of the year, or MetService Weather Ambassador Bob McDavitt’s round up at Sciblogs. Perhaps global warming really is turning out to be global weirding.

[Zombies (I used to play for the same cricket team as Colin Blunstone, but never at the same time, unfortunately)]

Bless the weather

bob-150x144.gif As if to demonstrate to its peers what the art of good science communication is all about, MetService has just launched a blog. Bob McDavitt (left – great pic!) has posted an excellent article about autumn colour, describing the process that creates the yellows and reds that make our countryside reliably spectacular at this time of year. Erick Brenstrum has a post about a landslide on Stewart Island in 1810, and Ross Marsden has a note on regional cloudscapes. With a team of seven bloggers and a mandate to generate regular material, it promises to be a must visit site for anyone with weather watching tendencies. I hope they can also match some the excellent blog coverage The Weather Channel provides for big US weather events.

[John Martyn, RIP]