The cracks are showing

petermann_breakup-1_web copy.jpg Arctic warming is taking a toll on more than sea ice: two of Greenland’s largest glaciers have experienced significant breakups over the last month, according to researchers at Ohio State University. The Petermann glacier in the far northwest of the island has lost a 29 square kilometre chunk of its floating ice tongue, and a big crack further back suggests another large piece could be about to break off. Meanwhile, the Jakobshavn Isbrae on the west coast – the largest glacier in Greenland – has retreated further inland this summer than at any time in the last 150 years, and possibly up to 6,000 years.

Further south, a team led by Ted Scambos at the University of Boulder has examined the rate of ice loss from the glaciers of south east Greenland, previously thought to be too small to contribute much to the overall mass balance of the ice sheet. Using a combination of laser altimetry and satellite imaging, they estimate that the region is losing about 100 cubic kilometres per year, a substantial part of the overall loss.

While we’re up there, the Arctic sea ice is still melting fast. Cryosphere Today shows the current area to be 3.68m km2, homing in on last year’s record. The fat lady’s still in her hotel…

Celia of the seals

sealhat.jpg It appears that my wish is someone’s command. Last month, blogging on the continuing break-up of the Wilkins ice shelf, I noted a reference to “seal hats” as data gathering devices and expressed a wish to see them. And here they are! Little devices glued to the heads of elephant seals that gather data as the seals as they go about their daily business. A new paper in the Proceedings of the National Academy of Science explains:

Here, we show that southern elephant seals (Mirounga leonina) equipped with oceanographic sensors can measure ocean structure and water mass changes in regions and seasons rarely observed with traditional oceanographic platforms. In particular, seals provided a 30-fold increase in hydrographic profiles from the sea-ice zone, allowing the major fronts to be mapped south of 60°S and sea-ice formation rates to be inferred from changes in upper ocean salinity. […] By measuring the high-latitude ocean during winter, elephant seals fill a ‘‘blind spot’’ in our sampling coverage, enabling the establishment of a truly global ocean-observing system.

Abstract here, full paper here[PDF]. More coverage at New Scientist, e! Science News.

Once upon a time there was an ocean

Oldnorthpolemap.jpg The Arctic summer sea ice cover could be reduced by 2013 to “a few outcrops on islands near Greenland and Canada between mid-July and mid-September”, according to new research reported in The Observer [UK] today. The paper also suggests that this year could still see a new record minimum. Wieslaw Maslowski, the US Navy researcher who suggested in 2007 that the Arctic could be ice free by 2013, told Observer science editor Robin McKie:

‘It does not really matter whether 2007 or 2008 is the worst year on record for Arctic ice,’ Maslowski said. ‘The crucial point is that ice is clearly not building up enough over winter to restore cover and that when you combine current estimates of ice thickness with the extent of the ice cap, you get a very clear indication that the Arctic is going to be ice-free in summer in five years. And when that happens, there will be consequences.’

This is the first story I’ve found in a mainstream newspaper that has picked up on what those “consequences” might be, albeit in only the most general terms:

This startling loss of Arctic sea ice has major meteorological, environmental and ecological implications. The region acts like a giant refrigerator that has a strong effect on the northern hemisphere’s meteorology. Without its cooling influence, weather patterns will be badly disrupted, including storms set to sweep over Britain.

Or a run of warm wet summers.

The paper also talked to Mark Serreze from the NSIDC about the speed up in melt over the last week:

‘[…]Beaufort Sea storms triggered steep ice losses and it now looks as if it will be a very close call indeed whether 2007 or 2008 is the worst year on record for ice cover over the Arctic. We will only find out when the cover reaches its minimum in mid-September.’

The fat lady may just have got back into the limo and returned to her hotel for a snack.

[Update 12/8: The NSIDC has updated (11/8) its Arctic news page, commenting on the effect of storms on the ice, and noting that Amundsen’s long version of the NW Passage will be open soon.]

Ice ice baby

CTarctic4808.jpg The fat lady’s not yet in the building, but her limo’s outside the theatre. There’s another five or six weeks of melting to go, but there’s more than just sea ice melting in the Arctic, and more than my few meagre wagers riding on how summer turns out ‘oop North. Here’s a compendium of interesting recent stuff…

Continue reading “Ice ice baby”

Hole in the ice

BremenAMSR-E080702crop.jpg The National Snow & Ice Data Centre in the US is issuing regular (monthly, though they might have to become more frequent soon) updates on the progress of this year’s Arctic melt season. Today they released their report for June, and like their earlier reports (accessed from the drop down menu top right on the page), it includes a lot of very interesting reading. Here’s a highlight:

June sea ice extents in 2008 and 2007 are essentially identical, and near the lowest values for June ever recorded by satellite for the Arctic.

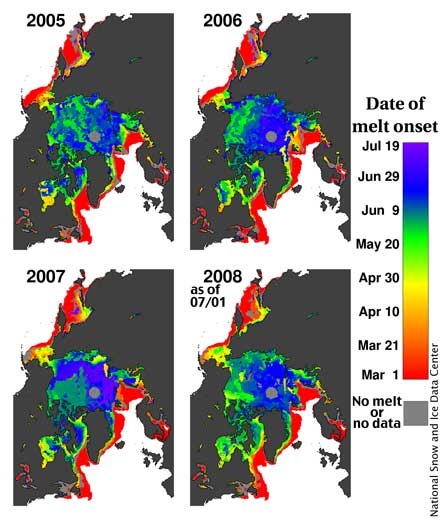
They note that the spatial pattern of melt this year is very different to last year, with much less melting in the Chuckchi Sea (top left on the pic at top – click for a bigger version), and much more to the north of Greenland and the Canadian archipelago. But the big news is that this year’s melt season started much earlier than usual. Take a look at this graphic:200807NSIDCmelt2.jpg

The blue bits show the areas that start melting latest. 2007 was close to the long term average in that respect, and the difference with this year is striking:

This year, sea ice in the Beaufort Sea began to melt on average 15 days earlier than normal, and 15 days earlier than last year. Surface melt in the Chukchi and East Siberian seas was 6 days earlier than normal, and 14 days earlier than in 2007. In the central Arctic Ocean, melt began around June 9th, which was 12 days earlier than normal and 9 days earlier than the year before.

Even the areas where the ice still looks pretty solid (north of Siberia) started melting weeks ahead of normal. The next month is going to be extremely interesting. The odds are tipping my way again…

Note: my new favourite site for monitoring the current sea ice area is the University of Bremen’s imagery. I don’t mean to be disloyal to Cryosphere Today, which remains essential, but Bremen’s images are higher resolution, and to my eye make what’s going on easier to follow. If we could just get some of CT’s features at Bremen, and vice versa… 😉

[This post updated July 4 to reflect amended NSIDC graphic and text (see comments). Doesn’t look as bad as it did – but that’s not much cause for comfort.]