On an island

EOBaffin.jpg

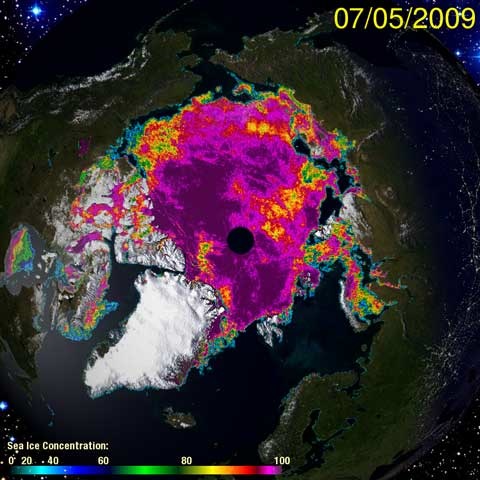
NASA’s Earth Observatory is without doubt one of my favourite web sites. As I write, the above view of sea ice off Baffin Island (or a version of it) is their Image of the Day, and aside from the obvious beauties of the swirls of melting sea ice (memorably described in a comment at RealClimate as “frappucino”), I reckon you can make out the two chunks of last year’s Petermann Ice Island that I blogged about last week. My two red arrows mark the huge relict chunks of ice shelf. Click on the image (or here) for the full NASA version (about 3.5MB), and then go and look at the icebergs pouring out of the fjords on Greenland’s west coast (top right of the big picture). Dramatic and lovely, and frightening at the same time.

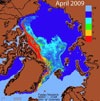
In other Arctic news, there are a new set of forecasts for this year’s minimum at the SEARCH Sea Ice Outlook site: most teams are picking a result somewhere between 2007 and 2008, but two of the sea ice modelling efforts are still suggesting a new record is possible. The NSIDC’s July 22nd update notes that 2009’s melt is now running ahead of 2008, and looking at their daily graph of extent, the current rate of melt seems to be faster than 2007. This has prompted some speculation about when the NE and NW Passages might open. Scanning the Cryosphere Today and University of Bremen maps, it looks as though the NE Passage (above Russia) might open soon. Blue colours on the CT image correspond the ice swirls on the NASA image above, and there’s still plenty of melt season to run. The NW Passage doesn’t look as sure a prospect: I think it could open, but perhaps only on the northern route. We live in interesting times…

Plus: great images of the Petermann Ice Tongue from the Greenpeace science team up there at the moment at the Guardian and Discovery Channel. Not to be missed.

[David Gilmour]

First we lose Manhattan…

It looks as though the Petermann Ice Tongue in northern Greenland is about to lose another major chunk of ice. This New Scientist video (accompanying text here) shows a team working on the tongue, documenting events as they happen. They expect a major break-up event within weeks:

When this happens, an island of ice the size of Manhattan, spanning 100 km2 holding 5 billion tonnes of ice, will break free and drift out to sea.

Researchers are concerned that the loss of this huge mass of ice might “uncork” the glacier, leading to a speed up and further ice loss.

Last year’s ice island started out at 25 km2, but has moved an amazing distance since it broke off in July 2008. By September it had moved south through Nares Strait (between Greenland and Ellesmere Island), and at that point the Canadian Ice Service installed a GPS tracking beacon. The ice island is now down to 21 km2 in area, drifting off the SE coast of Baffin Island. The massive berg has its own regularly updated page at the Canadian Ice Service (with satellite imagery), and you can follow its daily position here. I wonder how far a new Manhattan-sized island might get…

Meanwhile, the Telegraph reports that huge blobs of organic “goo” up to 15 miles long are appearing in the Chuckchi Sea and to the north of Alaska.

The US Coast Guard told the Anchorage Daily News that the strange find is not an oil product or a hazardous substance of any kind.

“It’s definitely, by the smell and make-up of it, some sort of naturally occurring organic or otherwise marine organism,” said Petty Officer 1st Class Terry Hasenauer. In recent history I don’t think we’ve seen anything like this,” he added.

Results of an analysis are expected next week

Thin ice #2

New analysis of Icesat data by a NASA team headed by Ron Kwok shows that from 2004 to 2008 Arctic winter sea ice “thinned dramatically”. Icesat measures the “freeboard” of the sea ice, the amount above water level. The graph below shows the extent of the decline, which is most marked in multi-year ice (ice that survives more than one summer).

Icethickness09.jpg

[Click image for bigger version]

In 2003, 62 percent of the Arctic’s total ice volume was stored in multi-year ice, with 38 percent stored in first-year seasonal ice. By 2008, 68 percent of the total ice volume was first-year ice, with 32 percent multi-year.

The information on ice thickness is critical to understanding what’s going on in the Arctic, as Kwok notes:

“Ice volume allows us to calculate annual ice production and gives us an inventory of the freshwater and total ice mass stored in Arctic sea ice,” said Kwok. “Even in years when the overall extent of sea ice remains stable or grows slightly, the thickness and volume of the ice cover is continuing to decline, making the ice more vulnerable to continued shrinkage. Our data will help scientists better understand how fast the volume of Arctic ice is decreasing and how soon we might see a nearly ice-free Arctic in the summer.”

NASA also provide some very nice visualisations of the data: animations of the changes in autumn and winter ice thickness as well as still images. Well worth a look. For more about NASA’s work on thickness, check this earlier post.

Also well worth checking out: The Standard posts a report a lecture about Andrill and the West Antarctic ice sheet by Prof Tim Naish. Earlier in the week, the Herald also reported on a lecture by Prof Peter Barrett that covered similar ground. I’m hoping to persuade the good professors to provide more detail here sometime soon…

The thin ice of a new day

arctic.seaice.color090705.jpgThe National Snow and Ice Data Centre (NSIDC) has just published its July sea ice news update on the state of the Arctic and the progress of the melt season. Under the heading Melt season in high gear, it gives an overview of June events, and the conditions at the start of the period of most rapid melt. Most interesting is their comment that weather patterns over the month were similar to those of 2007, when the record minimum was set:

This contrast between high and low pressure is broadly similar to the atmospheric circulation pattern that set up in 2007. In 2007, that pattern contributed to a significantly accelerated decline in ice extent during July, and a record minimum low in September. Will the same acceleration in ice melt occur this year? If so, a new record low minimum extent becomes more likely. So far, an acceleration has not been observed.

On the other hand, a peek at the IJIS graph shows that 2009 (red) has dipped below last year at the same time, and Cryosphere Today is showing large areas of ice break up (click on the thumbnail above for a larger version). CT’s metric (area, not extent) is also showing a steep decline. No sign of the fat lady yet…

Gone too soon

SIOJune2009iceages.jpg The June Sea Ice Outlook forecasts for the Arctic sea ice September minimum extent have been released today by SEARCH. Most groups are picking a minimum close to last year’s 4.7m km2, but the melt season is starting with an unusually small amount of multi-year ice. The report suggests that there is “a small but important probability of a major sea ice loss event this year, given that the ice is thinner and younger than previous years, combined with a possibility of atmospheric conditions that cause significant ice retreat.” The full range of forecasts is shown in this chart:

SIO_JuneReport2009.gif

The range of individual outlook values is from 4.2 to 5.0 million square kilometers. All estimates are well below the 1979–2007 September climatological mean value of 6.7 million square kilometers. Half of the responses are in the range of 4.9–5.0 million square kilometers; the remaining estimates are in the range of 4.2–4.7 (Figure 1, above). The uncertainty / error values, from those groups that provided them, are close to 0.5 million square kilometers, thus many of the values overlap.

Interestingly, the forecasts showing the lowest minima are based on sea ice modelling driven by atmospheric forcings and initialised with current sea ice conditions. The projection by Jinlun Zhang (next to lowest in the chart) suggests that even with conditions like last year — that is, without the Transpolar Express of warm southerlies that set up in 2007 — the 2007 record could fall. On the other hand, a Russian scientist suggest thats Pacific sea surface temps could be priming a cooler pattern than last year.

The full report [PDF] is a very interesting read for all ice watchers (and gamblers). On this guide to the form, it looks as though I’ll lose my bets – but the weather over the next two months will be the deciding factor. Do I feel lucky…?

[Michael Jackson RIP]