Hit somebody! (The hockey song)

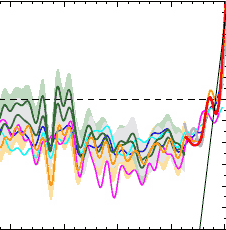
0901hockeythumb.png Expect a renewed interest in the shape of hockey sticks, as a new paper in the Proceedings of National Academy Of Sciences (PNAS) by Michael Mann (et al) finds that the last decade was the warmest for at least 1,300 years. The BBC headlines the story “Climate “hockey stick” is revived”, which rather stretches the facts about the controversy (nicely covered in the piece). More coverage at Mongabay, which notes:

The results confirm that temperatures today in the Northern Hemisphere are higher than those of the Medieval warm period, a time when the Vikings colonized Greenland are are believed to have become the first Europeans to visit North America.

Sounds like a red rag to sceptic bulls to me. Expect much nit-picking and fulmination. The rest of us will get on with trying to sort out the problem.

Mann et al. (2008). Proxy-based reconstructions of hemispheric and global surface temperature variations over the past two millennia. PNAS September 9, 2008 vol. 105 no. 36 (PDF available here)

You done my brain in

catbrain.jpg Opposing the ETS is easy for those politicians who remain sceptical of the reality of global warming. Heather Roy, the other ACT MP, showed her true colours in a press release at the end of last week. After the now ritual swipe at Winston Peters (and it is hard to resist, I must confess), she feels the need to explain the “greenhouse effect”:

By day the Earth is warmed by the sun’s rays, with some of that energy radiating back into space as infra-red radiation at night and being captured by ‘ Greenhouse’ gases. Unfortunately, the ‘ Greenhouse’ effect has been given a bad name – without it the Earth would be bitterly cold. The most effective greenhouse gas is water vapour – more commonly known as cloud. As most people know, there is seldom a frost after a cloudy night as the cloud traps the ground’s heat.

Not too bad, except for the fact that she confuses water vapour with cloud, which doesn’t bode well for her understanding of the big picture. But things rapidly get worse:

The second most important greenhouse gas is carbon dioxide. Although naturally-occurring, CO2 concentration in the atmosphere has risen over the past 200 years – which is blamed on human activity, especially burning coal and oil. These rising CO2 levels are blamed for global warming – which, it is widely purported, will cause more storms and a rising sea level. Other scientists argue that the CO2 variation is largely a result of natural factors. Therefore, our very expensive efforts to reduce CO2 emissions are wasted. I do not fully subscribe to the mainstream view, for which the science is inconclusive … but there can be no doubt about its political consequences.

“Other scientists” argue that CO2 rise is due to “natural factors”? That’s utter nonsense. No credible “scientist” argues any such thing. Some of the wilder shores of wingnuttery might – step forward EG Beck – but nobody that any responsible politician should be listening to. I wonder if Heather gets her health policy advice from a crystal healer? ACT is clearly parliament’s right wing sceptic rump. I can only hope they get nowhere near climate policy in any future government, and that their other policies are rather more evidence-based.

[Hat tip for lolcat to Jules’ Klimaatblog]

Celia of the seals

sealhat.jpg It appears that my wish is someone’s command. Last month, blogging on the continuing break-up of the Wilkins ice shelf, I noted a reference to “seal hats” as data gathering devices and expressed a wish to see them. And here they are! Little devices glued to the heads of elephant seals that gather data as the seals as they go about their daily business. A new paper in the Proceedings of the National Academy of Science explains:

Here, we show that southern elephant seals (Mirounga leonina) equipped with oceanographic sensors can measure ocean structure and water mass changes in regions and seasons rarely observed with traditional oceanographic platforms. In particular, seals provided a 30-fold increase in hydrographic profiles from the sea-ice zone, allowing the major fronts to be mapped south of 60°S and sea-ice formation rates to be inferred from changes in upper ocean salinity. […] By measuring the high-latitude ocean during winter, elephant seals fill a ‘‘blind spot’’ in our sampling coverage, enabling the establishment of a truly global ocean-observing system.

Abstract here, full paper here[PDF]. More coverage at New Scientist, e! Science News.

Once upon a time there was an ocean

Oldnorthpolemap.jpg The Arctic summer sea ice cover could be reduced by 2013 to “a few outcrops on islands near Greenland and Canada between mid-July and mid-September”, according to new research reported in The Observer [UK] today. The paper also suggests that this year could still see a new record minimum. Wieslaw Maslowski, the US Navy researcher who suggested in 2007 that the Arctic could be ice free by 2013, told Observer science editor Robin McKie:

‘It does not really matter whether 2007 or 2008 is the worst year on record for Arctic ice,’ Maslowski said. ‘The crucial point is that ice is clearly not building up enough over winter to restore cover and that when you combine current estimates of ice thickness with the extent of the ice cap, you get a very clear indication that the Arctic is going to be ice-free in summer in five years. And when that happens, there will be consequences.’

This is the first story I’ve found in a mainstream newspaper that has picked up on what those “consequences” might be, albeit in only the most general terms:

This startling loss of Arctic sea ice has major meteorological, environmental and ecological implications. The region acts like a giant refrigerator that has a strong effect on the northern hemisphere’s meteorology. Without its cooling influence, weather patterns will be badly disrupted, including storms set to sweep over Britain.

Or a run of warm wet summers.

The paper also talked to Mark Serreze from the NSIDC about the speed up in melt over the last week:

‘[…]Beaufort Sea storms triggered steep ice losses and it now looks as if it will be a very close call indeed whether 2007 or 2008 is the worst year on record for ice cover over the Arctic. We will only find out when the cover reaches its minimum in mid-September.’

The fat lady may just have got back into the limo and returned to her hotel for a snack.

[Update 12/8: The NSIDC has updated (11/8) its Arctic news page, commenting on the effect of storms on the ice, and noting that Amundsen’s long version of the NW Passage will be open soon.]

Ballad of broken seas

CRW_3037.jpg The Ministry for the Environment released an updated Coastal Hazards and Climate Change manual for local government last week, based on work done by NIWA. It incorporates the latest NZ thinking on where sea-levels are heading. If you’re planning to build something that has to last until the end of the century (and that covers a lot of coastal infrastructure), you should allow for half a metre of sea-level rise, and consider the consequences of an increase of up to 80cm. The report says:

For planning and decision timeframes out to the 2090s (2090–2099):

a. a base value sea-level rise of 0.5 m relative to the 1980–1999 average should be used, along with

b. an assessment of the potential consequences from a range of possible higher sea-level rises (particularly where impacts are likely to have high consequence or where additional future adaptation options are limited). At the very least, all assessments should consider the consequences of a mean sea-level rise of at least 0.8 m relative to the 1980–1999 average.

For planning and decision timeframes beyond 2100 where, as a result of the particular decision, future adaptation options will be limited, an allowance for sea-level rise of 10 mm per year beyond 2100 is recommended (in addition to the above recommendation).

Local authorities have a duty to understand this stuff (under the RMA and other legislation), so the report is highly detailed. If you’ve ever hankered after an in-depth understanding the processes that underlie storm surges, beach (and bach) erosion, tidal ranges and tsunamis, there’s no better place to start. If you want to see what impact that sort of rise might have on your area, try Global Warming Art’s excellent Google Maps mashup Sea Level Rise Explorer, or check NASA JPL’s new climate change site for the global sea level picture [Flash required].

Also released last week: the edited highlights (with pretty pictures) version of the Preparing For Climate Change guidance manual published last May which incorporates NIWA’s latest climate projections for NZ. Essential. And free.