High Water – NZ climate comic anthology

Scientists investigate how climate changes, politicians (should) decide what to do about it. Tough jobs. Artists have just as difficult a job: to comment on the reality and unreality they see in society’s responses to the climate threat, and by doing so motivate us to create a liveable future. In High Water, a new anthology of climate-inspired work by NZ comic artists, pulled together by Damon Keen and Faction Comics, that response ranges from the touching to the frightening, huge vistas seen through little frames — all presented in visually stunning stories drawn by NZ’s finest artists. The book kicks off with a superb little story by Dylan Horrocks, Dear Hinewai:

HorrocksHW

I’m a great fan of Dylan’s work ((That’s his image on the cover of The Aviator — see sidebar.)) — his latest, Sam Zabel and the Magic Pen is a real tour de force — and here he draws beautiful and bittersweet postcards from a future where New Zealanders are exploring a radically altered planet by airship ((Great minds, etc etc… 😉 )).

There is a lot of good stuff in High Water, but I have some personal favourites: Damon Keen’s The Lotus Eaters, which takes us on a trip from modern day Auckland through a grim future to the arcadia on the other side of our civilisation reminds me of the comics I grew up with (think Eagle), while Cory Mathis’ My Wife, The Mastodon looks at climate change through the eyes of ice age humans encountering neanderthals (and sabre tooth tigers). Chris Slane’s wonderful Dialogo di Galileo is a powerful poke at climate denial, with a great twist in the last frames.

SlaneHW

There’s an introduction by Lucy Lawless, in which she hits the nail rather more effectively on the head than our Prime Minister:

These eleven incredible artists have not stinted in imagining the gravest outcomes of man-made climate change. Perhaps a visual warning will work better than a written one, that requires imagination from a recalcitrant mind. Gorgeous work!

She’s right, you know. We need all hands to the pumps if we’re going to deal with the inundation coming our way, and High Water is a most welcome contribution.

To see more images from the anthology, and to get more background on the inspiration behind it, see this interview with editor Damon Keen. High Water, featuring the work of Dylan Horrocks, Sarah Laing, Katie O’Neill, Cory Mathis, Christian Pearce, Ned Wedlock, Toby Morris, Damon Keen, Chris Slane, Ross Murray and Jonathan King is being launched this evening in Auckland. Best wishes to all who sail in her…

The encroaching sea: new NZ sea level rise maps

This guest post is by Jonathan Musther, who has just published an amazing series of highly detailed maps projecting future sea level rise scenarios onto the New Zealand coastline. If you live within cooee of the sea, you need to explore his maps. Below he explains why he embarked on the project.

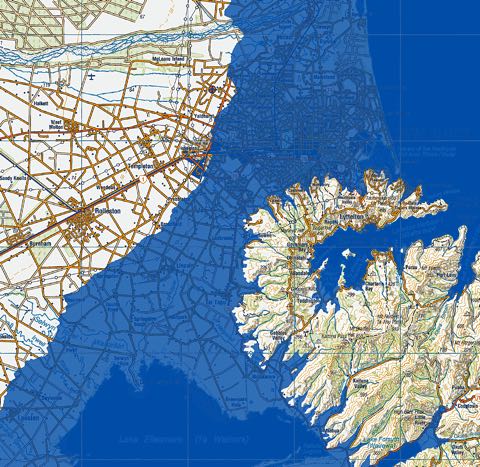
10mSLR-Christchurch480

The effect of 10m sea level rise on Christchurch: say goodbye to St Albans, prepare to paddle in the CBD. Full map here.

For humans, sea-level rise will almost certainly be the most directly observable effect of climate change, and specifically of global warming. As the climate changes, many of the effects will be subtle, or if not subtle, they will at least be very complex. Summers may be warmer, or cooler; we may experience more rain at some times of year, and less at others; tropical storms may increase and they may be sustained further from the equator, but all of these changes are complex, and not necessarily obvious against the background complexity of any climate system. In contrast, there is something obvious and unstoppable about sea-level rise, there is no question that it will send anyone in its path running for the hills.

For some time I have been involved in searching for land appropriate for specific uses such as arable farming, water catchment, and off-grid living. When searching for land in this way, there are many, many criteria to consider, and of course one of these is potential future sea-level. Using GIS (Geographical Information System) software, and elevation models of the New Zealand landscape, it is possible to visualise sea-level rise, and select sites accordingly. Naturally, the next question is what sea-level rise to consider. It is possible to place an upper-limit on sea-level rise – after all, there’s only a finite amount of ice that could melt – but beyond that, we’re limited to informed guesswork.

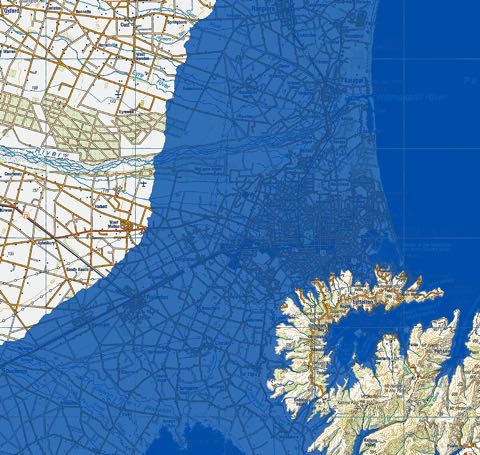
25mSLR-Christchurch480

25m sea level rise: a sunken city and Banks Island. Full map here.

What is the maximum possible sea-level rise? It depends who you ask. Many sources place the maximum potential sea-level rise at around 60-64 metres, but these figures are rarely referenced, and don’t concur with the latest research. Other sources place the figure at around 80-81.5 metres, and while this appears to be well referenced and researched, it is based on work that is somewhat out of date. The best estimates I’ve been able to locate, based on recent measurements (and lots of them) are around 70 metres, but quite what the margin of error is remains uncertain. Of course, when considering future sea-level, we must remember that here in the South Pacific, we will likely experience increased numbers of more powerful tropical storms, with associated storm surges.

80mSLR-Christchurch480

At 80m, West Melton is a seaside township. Full map here.

The maps I created showing sea-level rise for the whole of New Zealand depict rises of 10, 25 and 80 metres. I have certainly received criticism for not focussing on more modest sea-level rises (e.g. 1 or 2 metres), but there are some good reasons for this: firstly, the resolution of the elevation models of New Zealand do not allow accurate predictions of such small rises. Secondly, larger sea-level rises pose a huge threat, and are therefore worth considering. I made a point of avoiding time frame predictions when producing the sea-level rise maps, partly because the time frame is largely irrelevant (if 80% of our homes are flooded, it’s bad news, no matter when) and partly because the range of expert estimates is huge. Study after study shows that we have underestimated ice-sheet instability, and it is almost universally accepted that large sea-level rise will be a consequence. Unfortunately, most studies place this sea-level rise at some unspecified time in the future – when, we’re not sure, but it’s far enough away that we needn’t worry…

So is a 10 or 25 metre sea-level rise likely? Unfortunately, the broad answer is yes. The Greenland, West and East Antarctic ice sheets are showing growing instability, and many researchers agree that they may have past a ‘point of no return’. Remember, the Greenland ice sheet alone, if completely melted, would lead to approximately a 7 m rise in global sea-level. Of course, we return to the issue of when this is likely to happen, and on that, the jury is out.

I firmly believe that to be good scientists, we must investigate the possibility of large sea-level rise, and its consequences. The time frame is unclear, the absolute rise is also unclear, but there really is something unstoppable about rising oceans. We are now well outside the sphere of collective human experience and expertise, and we should be very careful to prepare, as best we can, for a range of scenarios.

The Age of Sustainable Development

It is profoundly depressing to hear pundits and politicians talking about the prospects for economic growth with no reference to either equity or environmental constraints. In the case of New Zealand a “rock star” economy can apparently develop accompanied by dismaying levels of child poverty, excited expectations of new oil and gas discoveries which spell disaster for the climate, and a burgeoning dairy industry paying scant attention to the environmental consequences of its rapid growth.
Fortunately there are more discerning economists on the world stage for whom economic growth is only welcome when it means an end to poverty and when it fully respects strict environmental limits. Jeffrey Sachs, Director of the Earth Institute  at Columbia University, is an outstanding example. His latest book The Age of Sustainable Development is heavily focused on the ending of poverty in parts of the world where it remains endemic and is relentless in its recognition of the severe environmental strains that economic development and soaring population growth are placing on the earth systems on which human life depends.

The book was developed as part of a global open online course of the same name offered by the Earth Institute and already taken, Sachs reports, by tens of thousands of students around the world.

Continue reading “The Age of Sustainable Development”

Totten hots up, ice shelves melting: it’s grim down south

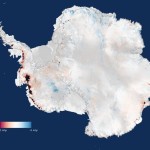
AntarcticaCryosat2Much news in recent weeks from Antarctica, and none of it good. An Argentinian base on the tip of the Antarctic Peninsula recently reported a new high temperature record for the continent — 17.5ºC. A team of scientists has discovered that East Antarctica’s Totten Glacier — which drains a catchment that contains enough ice to raise sea levels by 3.5 metres — is vulnerable to melting caused by warm ocean water lapping underneath the ice and reaching inland ((Greenbaum JS et al, (2015), Ocean access to a cavity beneath Totten Glacier in East Antarctica, Nature Geoscience, doi:10.1038/ngeo2388)). Another group has stitched together satellite data on ice shelf thickness gathered from 1994 to 2012 and found that the ice shelves — mostly stable at the beginning of the period, are now losing mass fast ((Paolo, F.S. et al, (2015), Volume loss from Antarctic ice shelves is accelerating, Science, doi/10.1126/science.aaa0940)). From the abstract:
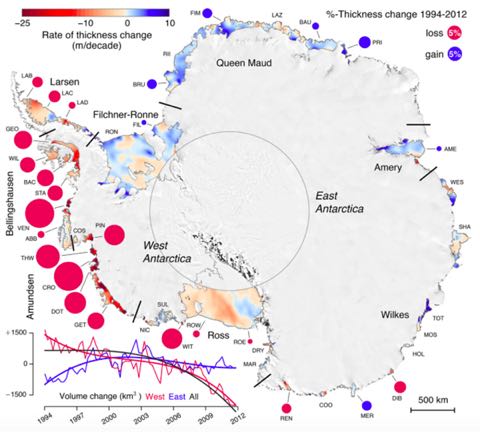
Overall, average ice-shelf volume change accelerated from negligible loss at 25 ± 64 km3 per year for 1994-2003 to rapid loss of 310 ± 74 km3 per year for 2003-2012. West Antarctic losses increased by 70% in the last decade, and earlier volume gain by East Antarctic ice shelves ceased. In the Amundsen and Bellingshausen regions, some ice shelves have lost up to 18% of their thickness in less than two decades.

The Amundsen region is home to the Pine Island Glacier, notorious for its current rapid loss of mass, and probably already past the point of no return for long term total melt. The map below shows the big picture: large red dots are ice shelves losing mass. Blue dots are shelves gaining mass.

Antarcticiceshelves

Ice shelves are important features of the Antarctic cryosphere. They buttress the ice piled up on the land, slowing down the flow of ice into the ocean. As the shelves lose mass, the flow of ice from the centre of the continent can speed up, adding to sea level rise. There’s a very good overview of the process — and the findings of the Paulo et al paper — in this excellent Carbon Brief analysis.

The study of the Totten Glacier — one of the fastest thinning glaciers in East Antarctica — is the first to look at the detail of the sea floor and ice thickness in the area. The study finds that there are “tunnels” under the ice leading into a deep trough inland that cold convey warm water inland — the same process that has destabilised the Pine Island Glacier in West Antarctica. As the authors suggest, rather drily, “coastal processes in this area could have global consequences”.

These signs of rapid changes around the coasts of Antarctica, together with hints that large parts of the huge East Antarctic ice sheet are at risk of following West Antarctica into the sea, suggest that even if sea levels only rise by a metre by the end of this century as the IPCC projected last year, the longer term picture will be a great deal wetter than that. After all, there is the equivalent of 60 metres of sea level rise locked up in East Antarctica.

For a very good overview of the state of our understanding of what’s going on in Antarctica, I recommend a listen to VUW’s Professor Tim Naish being interviewed by Radio New Zealand National’s Kim Hill last Saturday. Naish even covers what’s happening to the sea ice down there, but a longer term study of the sea ice is getting under way, led by another VUW prof — Jim Renwick.

Leyland and Carter: the rebuttal that isn’t and the hypocrisy that is

CarterFlatEarth.jpgSciblogs editor Peter Griffin recently gave climate denial activists Bryan Leyland and Bob Carter a “right of reply” to my post pointing out the errors and inconsistencies in a Dominion Post op-ed penned by the pair. Griffin took this action because of vociferous complaints from Leyland, who took offence at my discussion of his expertise (non-existent) and history of campaigning against action on climate. The result is billed as a “rebuttal”, but it isn’t, as I shall demonstrate.

The Sciblogs “rebuttal” is a mishmash of a so-called “fully referenced” version (pdf) of the op-ed that Leyland says was supplied to the Dominion Post, but he and Carter also prepared a very long-winded “response” (pdf) to the debunking of their piece by David Wratt, Andy Reisinger and Jim Renwick in the DP. The latter is a real eye-opener…

Life is too short to do another point-by-point demolition ((Leyland & Carter may be retired, with nothing better to do than promote their crank viewpoints, but I have grapes and truffles to nurture through to harvest, and a book to write)), so I’ll select a few key issues that demonstrate that although they claim to be discussing science in a scientific manner, what they are actually doing is having the equivalent of an argument in a pub — prepared to say anything if they think it will help them “win”.

Continue reading “Leyland and Carter: the rebuttal that isn’t and the hypocrisy that is”