Ignoring the future? Sea level rise and NZ’s planning guidelines

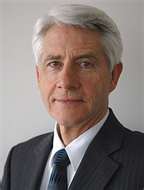
A question-time exchange in the New Zealand Parliament a few days ago seemed worth drawing to the attention of Hot Topic’s readers. Green MP Kennedy Graham (pictured) put this question to the Minister for Climate Change Issues:

Is he concerned by a recent report of an international team of scientists that, even with a two degree Celsius rise in average global temperature, future generations could face sea levels of up to 12 to 22 metres higher than at present?

Kate Wilkinson, the Minister of Conservation, replied on behalf of the Minister for Climate Change Issues:

Yes. The estimates of sea level rise in this report are in line with estimates from the science community over the past few years. But I note that the author himself puts these estimates in context by stating that such changes could take centuries or millennia and that “The current trajectory for the 21st century global rise of sea level is 2 to 3 feet …”.

Graham’s follow-up question pointed out that the current Government guidelines for councils for sea level rise for 2100 are lower than the level estimated by scientists and asked whether the need for correction would be admitted.

Continue reading “Ignoring the future? Sea level rise and NZ’s planning guidelines”

Cartophilia (something to pore over)

Windmap

Click on the image. Wait. Watch and be mesmerised by this visualisation by Hint.fm of current wind flow over the USA. It’s a tremendous way to get a feel for the shape of the weather. Something similarly hypnotic and revealing of weather patterns is the animation of global total precipitable water (that is, atmospheric moisture content) from the Cooperative Institute for Meteorological Satellite Studies at the University of Wisonsin-Madison. I haven’t embedded it because it’s a big animation, but it’s well worth a few bits of bandwidth.

Carbonmap

The Carbon Map is another tour de force of data visualisation — changing the shapes and sizes of countries on a global map to show how they measure on a number of indices: area, population, wealth, historic emissions, current emissions, carbon reserves and so on. The image I’ve grabbed shows the exposure of countries to sea level rise. More about the map and its creation at the Guardian.

Updated to add this amazing NASA animation of global ocean currents over 2005/7. Just look at those whorls spinning off the bottom of Africa…

[youtube]CCmTY0PKGDs[/youtube]

A blast from the past (if we knew now what we knew then)

[youtube]OmpiuuBy-4s[/youtube]

Peter Sinclair’s recent Climate Denial Crock of the Week is fascinating viewing. He has unearthed a video of a talk given by climate scientist Mike McCracken thirty years ago and asks him in a recent interview what he would say differently today.

Very little has changed. The younger McCracken:

“CO2 probably has been very high in past geologic terms but certainly not in past historic times, and so we’re really doing a giant experiment and the question is what is the outcome going to be?”

Continue reading “A blast from the past (if we knew now what we knew then)”

Prat watch #5: Ignorance is bliss

What happens when you deny things? Well, if you deny the reality of global warming, and if you are to be in any way self-consistent, then you have to deny every bit of evidence that it might be happening. Here’s a classic example, drawn from New Zealand’s very own little corner of the climate crank echo chamber, Richard Treadgold’s “Climate Conversation Group” blog. Treadgold concludes a recent post thus:

Once more: let’s stop accepting this palpable nonsense that climate change is responsible for anything.

Climate change means global warming. Global warming has not happened for about 15 years, unless you take a micrometer to the thermometer. And if you have to do that just to detect warming, then it’s hardly dangerous, is it?

Oh – if it didn’t happen, then it didn’t cause anything! No droughts, no wildfires, no floods, no storms. No ice melt.

Look at the bit I’ve emphasised. No warming for 15 years? Tell that to the planet, Richard. Here’s what the World Meteorological Organisation says about the first decade of the 21st century:

…climate change accelerated in 2001-2010, which was the warmest decade ever recorded in all continents of the globe.

No warming for 15 years? After we’ve had the warmest decade ever recorded in all continents of the globe?

Continue reading “Prat watch #5: Ignorance is bliss”

Hypocrisy rules: Monckton ducks debate

[Youtube]DCoi94n0aJg[/youtube]

Peter Hadfield, aka video blogger potholer54, notes with some interest that while the noble Lord, Christopher, the discount Viscount Monckton of Brenchley has plenty of time on his current US trip to indulge in fantasies about the President’s birth, long Skype chats with classrooms of students, and addresses to California politicians, he has been unable to find the time to respond to the very public debate with Hadfield that he had committed to on Anthony Watts µWatts blog. The uncharitable might suggest this was because he was getting a drubbing. There’s a big difference between winning a debate through oratory, one of the potty peer’s genuine accomplishments, and living by the undeniable facts. Full text of Hadfield’s open letter here, together with a list of his debunking videos. Good value.

See also: Climate Crocks, Barry Bickmore, and Eli’s burrow.

[Lemon Jelly]